
K8s Runtime Security
Secure a Kubernetes environment using in-house offerings and runtime security tools like Falco.
medium

To access material, start machines and answer questions login.

Welcome back to another security room, where the quest to become a security-savvy engineer will continue. As a engineer, you may securely set up your environment and configure your cluster following k8s industry best practices while ensuring you avoid some pitfalls with microservices architecture. Having done all this, you may be resting easily, thinking your cluster is safe from bugs and hackers. Unfortunately, that hypothetical bubble is about to burst, as in this room, we will be learning about threats that can emerge after a containerised application is running. That is at runtime.
Runtime security, or more specifically, in our case, runtime security, can be one of the trickiest aspects of cluster security. As engineers, it's our job to ensure a environment is secured against known vulnerabilities or attacks. Still, a vulnerability will sometimes arise after our application starts running (a zero-day threat). Attacks can also unfold at runtime, such as privilege escalation attempts. Runtime security can be seen as the last line of defence. Ideally, our secure cluster configurations and things like would prevent any attempts at compromising your environment, but the reality is that sometimes hackers find new exploits or gaps in configurations; as a Engineer, it falls on us to make sure these events are detected. It's time to continue your time at Laboratories by learning the ins and outs of runtime security, the offerings available to us, and their implementation in a cluster.
With this being a security room, it is assumed that the basics of (as covered in Intro to ) are in that noggin of yours, as well as knowledge of the underlying technology that is built on (covered in Intro to Containerisation and Intro to Docker). The introduction to this room mentions a hypothetical where a cluster has been securely set up, follows best security practices and developed, taking into account problems associated with Microservices architecture. This knowledge is recommended and covered in the following rooms: , K8s Best Security Practices and Microservices Architecture.
- Understand Auditing and how it can be used to trace and troubleshoot security events
- Understand the various problems and solutions surrounding runtime security in
- Understand Falco, how it works and how it can be used in a cluster for real-time threat detection
- Understand the importance of end-to-end monitoring and how other tools can work along with Falco to achieve this
Click to continue to the next task!

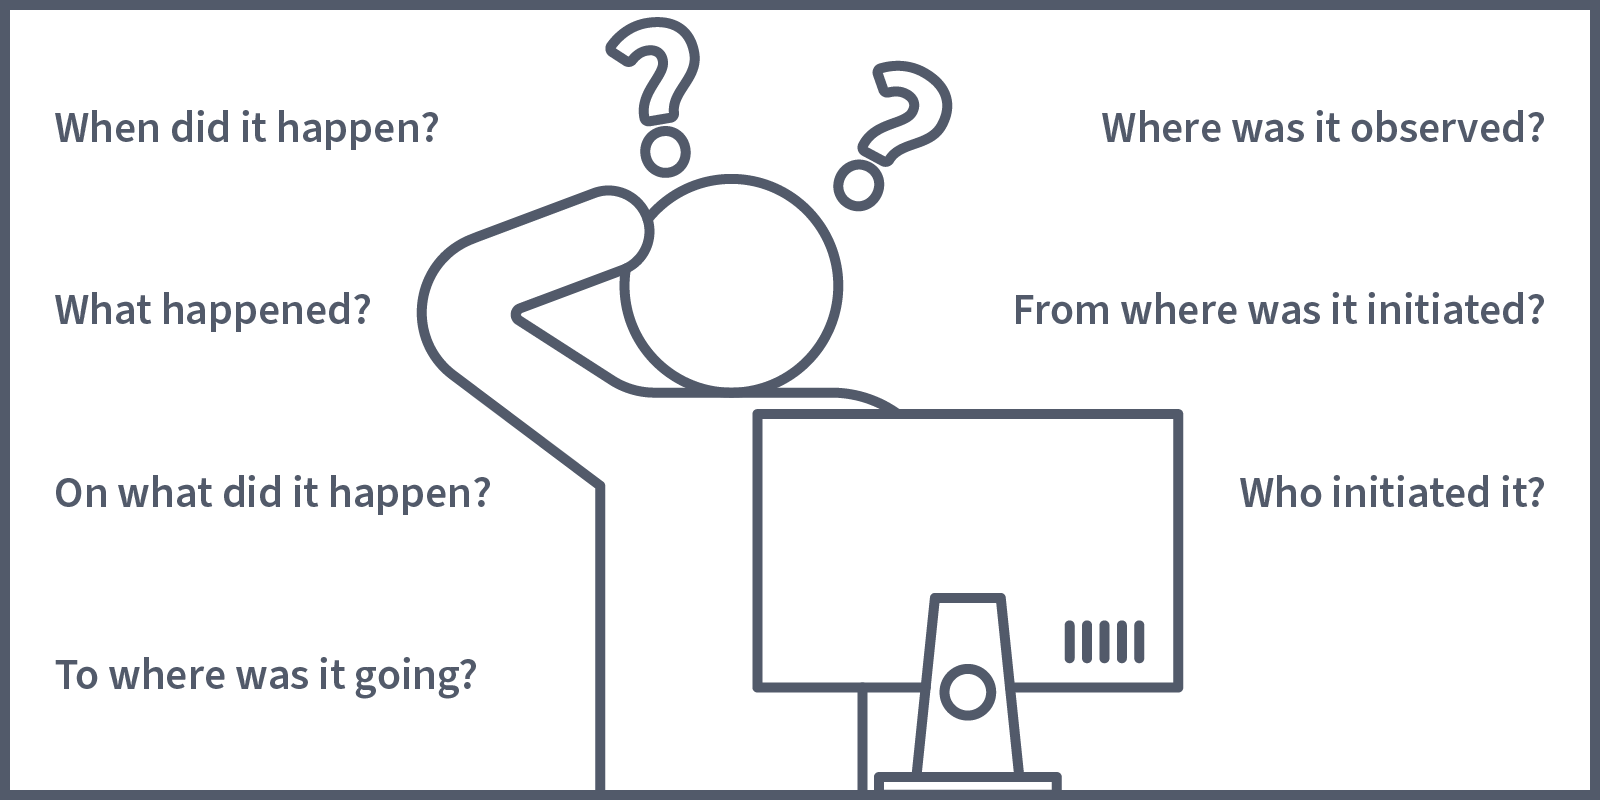
We will kick off this room by looking at what has built in that can help us in our quest for a secure runtime environment. Spoilers: it's not a lot, but it is important to understand what offers and how this can be utilised for runtime security. Before defining what is provided, let's imagine a scenario where it is needed. Picture this: you're going about your day, doing your thing, when all of a sudden, you notice something strange. You see that pods running in a deployment are not running with the image they are supposed to. Someone has changed the image to one you don't recognise. This has not been discussed in any of your stand-up meetings or mentioned in any communications. You have many questions, and the first place you go looking for answers is the logs. Then, you check Events (contained in the output of kubectl describe command) but still can't find what you're looking for. You need something that can tell you when this resource was changed and who performed the change. This information (as well as other information useful in a security context) is captured in an audit log using Auditing.
Auditing provides users/cluster administrators with a set of chronological records which document sequences of action in a cluster. These records are helpful in a security context as they record actions performed by users, applications (that use ) and the control plane itself that can provide valuable insights, answering questions like:
In a typical production cluster, there are going to be A LOT of events. We're now going to take a look at how we can configure our cluster to capture specific events. Before doing this, though, we need to understand two terms that are critical when defining our criteria for an audit event: stages and levels.
Stages
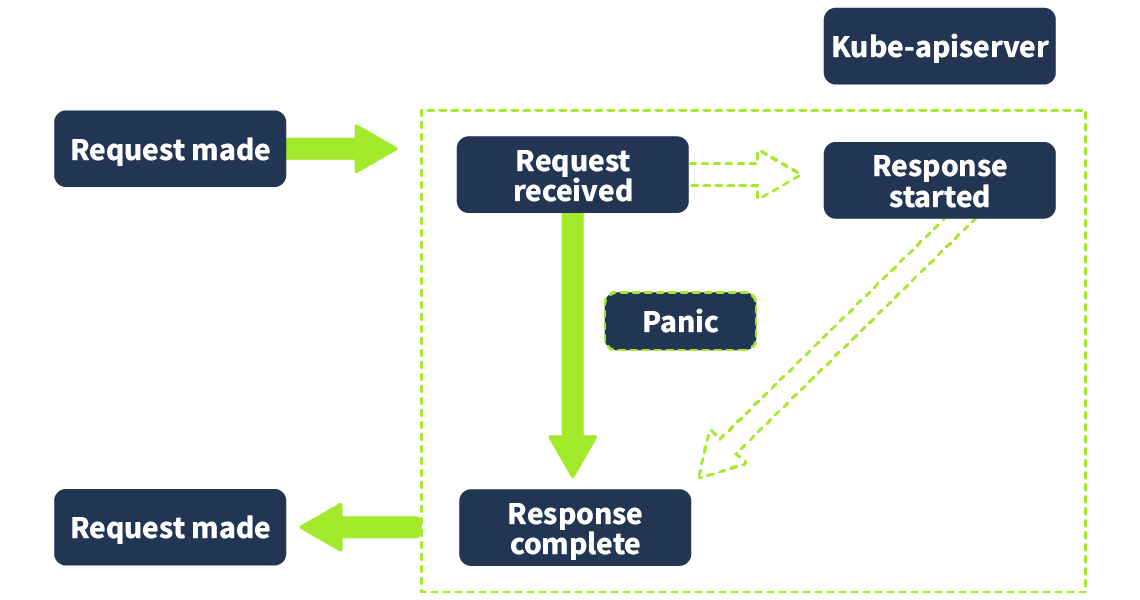
An audit log can be captured at various stages of a request in the kube-apiserver component (where all requests are sent). The different stages are defined as follows:
RequestReceived: The audit handler (in the kube-apiserver) has received the request, but no response has been generated yet.
ResponseStarted: This is when the response headers have been sent out, but the response body hasn't. This stage will only be present for long-running requests such as “wait” (a command you can use to wait for a condition to be met, such as the running status of a resource).
ResponseCompleted: When the response body has been completed and sent out.
Panic: This is an event generated when a panic occurs (critical error causing failure)
Levels
We use levels to tell how much event data we want to be captured in our audit log. There are four levels in total. As the level increases, more data is captured:
None - This tells not to log this request
Metadata - This tells only to log the request metadata
Request - This tells to log the request metadata and the request body
RequestResponse - This tells to log the request metadata, request body and response body.
Defining Audit Policy
Now that stages and levels have been defined, we are going to take a look at how we define what events we want to be audited (and what data should be included) in our cluster using an audit policy. The official documentation defines an example audit policy, which we can take a look at now:
apiVersion: audit.k8s.io/v1 # This is required.
kind: Policy
# Don't generate audit events for all requests in RequestReceived stage.
omitStages:
  - "RequestReceived"
rules:
  # Log pod changes at RequestResponse level
  - level: RequestResponse
    resources:
    - group: ""
      # Resource "pods" doesn't match requests to any subresource of pods,
      # which is consistent with the RBAC policy.
      resources: ["pods"]
  # Log "pods/log", "pods/status" at Metadata level
  - level: Metadata
    resources:
    - group: ""
      resources: ["pods/log", "pods/status"]

  # Don't log requests to a configmap called "controller-leader"
  - level: None
    resources:
    - group: ""
      resources: ["configmaps"]
      resourceNames: ["controller-leader"]

  # Don't log watch requests by the "system:kube-proxy" on endpoints or services
  - level: None
    users: ["system:kube-proxy"]
    verbs: ["watch"]
    resources:
    - group: "" # core API group
      resources: ["endpoints", "services"]

  # Don't log authenticated requests to certain non-resource URL paths.
  - level: None
    userGroups: ["system:authenticated"]
    nonResourceURLs:
    - "/api*" # Wildcard matching.
    - "/version"

  # Log the request body of configmap changes in kube-system.
  - level: Request
    resources:
    - group: "" # core API group
      resources: ["configmaps"]
    # This rule only applies to resources in the "kube-system" namespace.
    # The empty string "" can be used to select non-namespaced resources.
    namespaces: ["kube-system"]

  # Log configmap and secret changes in all other namespaces at the Metadata level.
  - level: Metadata
    resources:
    - group: "" # core API group
      resources: ["secrets", "configmaps"]

  # Log all other resources in core and extensions at the Request level.
  - level: Request
    resources:
    - group: "" # core API group
    - group: "extensions" # Version of group should NOT be included.

  # A catch-all rule to log all other requests at the Metadata level.
  - level: Metadata
    # Long-running requests like watches that fall under this rule will not
    # generate an audit event in RequestReceived.
    omitStages:
      - "RequestReceived"
Note that the “rule” field must be contained in an audit policy for it to be valid. All rules defined under that field are then evaluated in a top-down order.
Lets now consider some best practices to consider when defining audit policies:
- For sensitive resources (anything containing security-sensitive information, such as secrets or config maps), log only at the Metadata level; otherwise, the sensitive information will be included in the audit log.
- Read-only URLs should generally not be logged. Given the context for why we want our audit logs (trying to find information about security-relevant events such as a resource change), read-only URLs are unlikely to be involved, so not logging them can reduce the volume of logs, making it significantly easier to find the information we want.
- A general best practice is to log all (non-read-only URL) resources at least at a Metadata level, and if a resource is critical, it should be logged at a RequestResponse level (unless sensitive information is contained). Below is an example audit policy that logs all resources at a Metadata level.
# Log all requests at the Metadata level.
apiVersion: audit.k8s.io/v1
kind: Policy
rules:
- level: Metadata
Before finishing this task, let's look at one more example. We've looked at what Kubernetes Auditing allows us to do and how we can use Audit policies to define what stage to capture the audit log and how much data should be captured for it. There's only one thing left to look at. The audit log! Here is an example of what an audit log may look like when capturing a pod creation event:
{
  "kind": "Event",
  "apiVersion": "audit.k8s.io/v1",
  "level": "Request",
  "auditID": "3928b929-4c7d—8243-e5ea-4fc57cfd5c9a",
  "stage": "ResponseComplete",
  "requestURI": "/api/v1/namespaces/default/pods",
  "verb": "create",
  "user": {
    "username": "system:serviceaccount:default:example-suspicious-user",
    "groups": [
      "system:serviceaccounts",
      "system:serviceaccounts:default",
      "system:authenticated"
    ]
  },
  "sourceIPs": [],
  "userAgent": "kubectl/v1.18.0 (linux/amd64) kubernetes/9e99141",
  "objectRef": {
    "resource": "pods",
    "namespace": "default",
    "name": "my-pod"
  },
  "responseStatus": {
    "code": 201
  },
  "requestReceivedTimestamp": "2024-07-18T10:15:30.000Z",
  "stageTimestamp": "2024-07-18T10:15:31.000Z"
}
Another thing to consider as a engineer is that they need to be secured once these audit logs are captured. Audit logs, once captured, can be secured using methods such as secure transmission (ensuring is enabled) and access control (restricting access to audit logs using ). That does it in terms of a general overview of auditing and how it can be used to detect certain activity across our cluster at runtime. Answer the questions below before going on to the next task!
In which request stage will the response headers have been sent out but not the response body?
Which level will capture the most data?
What field must be contained in an audit policy for it to be valid?
At what level is it recommended to log sensitive resources (like secrets)?

Shift Left, Shield Right
Runtime security was introduced in the introduction task as the practice of ensuring applications remain secure during runtime; you can think of all the efforts before runtime (secure setup, , etc) as supporting the key concept of shifting left. Ensuring security is in place and considered front the very first stages of development. When we discuss runtime security, we are focusing on how we shield right. That is, ensure our applications are protected during runtime. This task will take a deeper look at how this can be achieved with , the different kinds of tools that can help us do this, and some of the underlying concepts that allow these tools to work.
The Ephemeral Problem
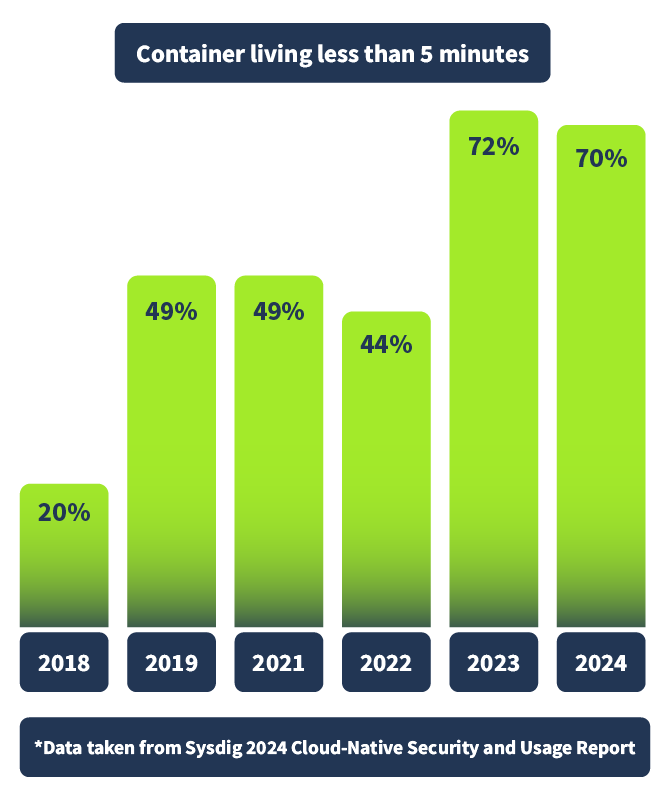
So, before diving into what tools can help us shield right by detecting runtime threats in our environment, let's address the ephemeral elephant in the room. One of the biggest challenges in securing a containerised environment, like one deployed in , is the tracking of events. This is because of the ephemeral nature of containers, meaning they are often short-lived. Spun up for the execution of a script or to handle an increased workload, then back down again. In fact, Sysdig, who provide very valuable insights in their annual "Cloud-Native Security and Usage Report (opens in new tab)", found in their latest report (2024) that a whopping 70% of containers live less than 5 minutes, as shown below.
This poses a challenge in the world of digital forensics, a world we need to engage with to troubleshoot security events at runtime or prevent them from happening in the first place. Due to their short lifespan, this troubleshooting won't be done at the event's origin, the , like in a monolithic application, as it will no longer exist. It also causes challenges when pulling information such as IP addresses, as this information will be obtainable along with a ID. Still, it is very likely that a new (with a new IP) will have been spun up in its place by the time this investigation is underway. Imagine trying to investigate a crime where the scene of the grim disappears after 5 minutes. So, short of a Sherlock Holmes plug-in, we need to start looking to other tools to help us secure our in runtime.

Runtime Security Tools
As covered in the previous task doesn't offer a whole lot in terms of runtime security. It offers us audit logs via Auditing, which allows us to track resource requests in our cluster. However, it does nothing with this information. No analysis is done, and no alerting is in place. If we want to take our Runtime Security to the next level, we need to bring in some help. That is 3rd party tools which allow us to lockdown our environment at runtime. There are two types of runtime security tools: runtime enforcement and auditing tools. Before we take a look at some examples, it's important to understand system calls, as a lot of these tools utilise these to enforce/audit security in a runtime environment.
System Calls
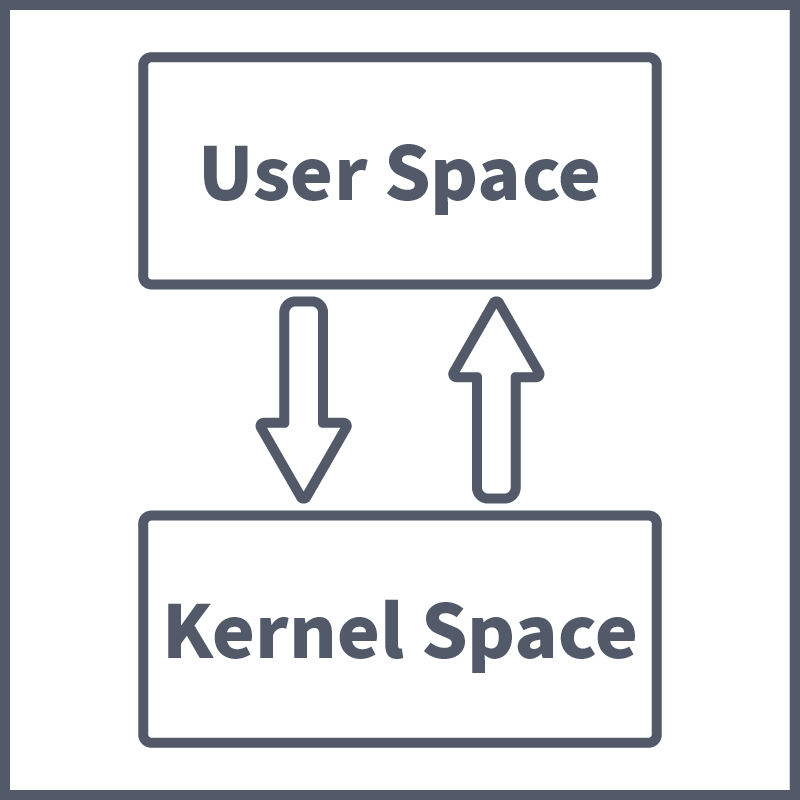
System calls are an important security concept to understand, especially in the context of runtime security. System calls (or syscalls) are communication that takes place between a running process (in the user space) and the kernel (in the ). These communications take place when a running process does not have the required permissions to perform a task, as the user space where processes run is highly restricted as opposed to the kernel space, which has unrestricted access to hardware/system resources. And so, the running process asks the kernel to perform the said task on its behalf. These system calls are useful in determining what a process is trying to do at runtime and, therefore, important to define going forward. With that done, let's look at some of the Runtime Security tools available to us.
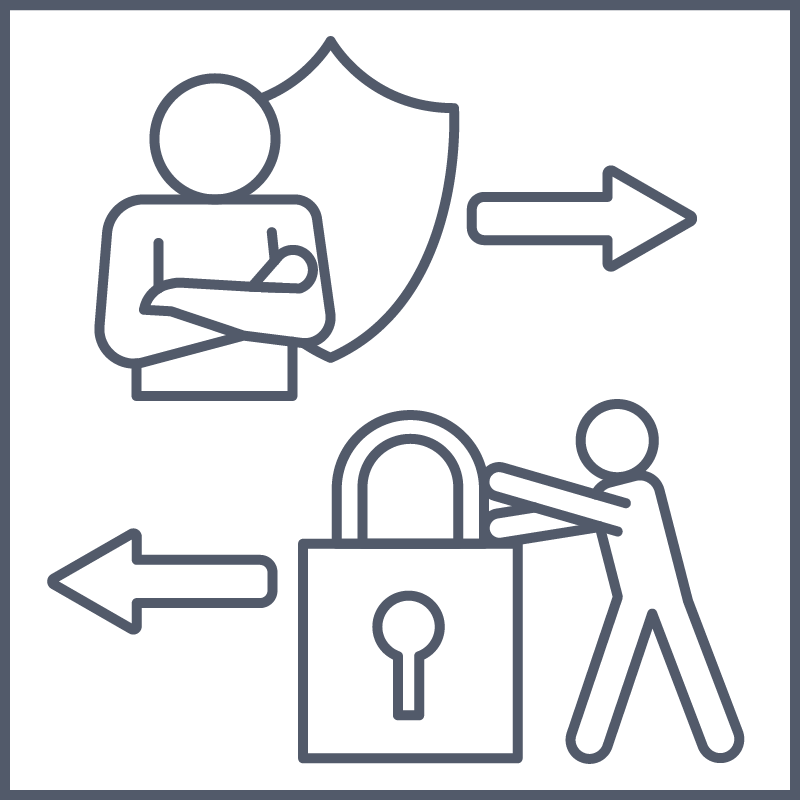
Security Runtime Enforcement Tools
Security runtime enforcement tools allow you to define policies that can minimise the impact of a threat when it appears in your runtime environment. It does this by restricting the access rights and permissions of resources within the environment. In other words, these are threat mitigation tools rather than threat prevention. You may be thinking, "Wow, these sure sound a lot like ", and you wouldn't be wrong. and enforcement tools are similar in nature in that they prevent containers from performing specific actions, but the key difference here is that enforcement tools enforce access controls at a kernel level. This is very useful in a context as it almost provides a second layer of security. In a scenario where a environment is compromised, these enforcement tools, which work at a kernel level, can mitigate the impact of, for example, a compromised by restricting its access to external resources. Let's now take a look at some examples of these tools.
AppArmour: AppArmour defines itself as an "easy-to-use" application security system. It's a kernel module that protects both the operating system and applications from internal and external threats. Policies can be defined in AppArmour that enforce good behaviour, preventing known and unknown (e.g. zero-day attacks) application flaws from being exploited. The policies, in a nutshell, define what system resources an application can access and with what privileges.
Seccomp: Seccomp (standing for secure computing mode) is an enforcement tool that operates at the kernel level. It works by filtering system calls, only allowing processed to perform certain calls (exit(), sigreturn(), read() and write()) to already open file descriptors (a process unique identifier for a file or other input/output resource). This secure state is enforced using Seccomp, and if a process tries to make any other call, it is terminated by the kernel using SYGKILL or SYGSYS. Seccomp profiles are -formatted policies that define what system calls are allowed and the default action if other calls are attempted. allows Seccomp profiles to be automatically applied to pods/containers. More on this here (opens in new tab).
SELinux: SELinux is very similar to AppArmour in that it is a Kernel Module which allows access controls to be implemented to protect a runtime environment. The decision between AppArmour and SELinux primarily comes down to personal preference over any significant positives vs negatives debate. The benefits of tools like SELinux, AppArmour, and SELinux are that they are not restricted to environments, but all workloads, so they can benefit setups that use a combination of containers and VMs.
Auditing Tools
When we talk about auditing tools in this context, we are talking about an extension to the auditing, which comes out of the box. Auditing tools in this context are used for real-time threat detection, that is, the analysis of an audit log/event so that reactive action can be taken (if desired). The best example of a tool that fits this purpose for a workload is Falco. Falco is a very important tool when it comes to runtime security, so important that it warrants its own Tasks. So, without further ado, answer the questions below and continue to the next room, where we will look at Falco in-depth.
What percentage of containers live less than 5 minutes in 2024 according to the annual report provided in this task?
What security concept, covered in this task, is a communication that takes place between a running process and the kernel?
Which security runtime enforcement tool works by filtering system calls, only allowing processed to perform certain calls to already open file descriptors?

Addressing the Headache
By now, it should have hopefully been made clear that securing a containerised environment at runtime comes with many complications and difficulties. The ephemeral nature of containers poses a forensics challenge to the foundations of cloud-native computing, making it more complicated to determine what an intrusion looks like. No longer is there a single point of entry where a perimeter can stand guard, determining what can be let in or out. Now, we have externally accessible containerised workloads which can be scaled up or down. How, then, with all these difficulties, can we detect threats in real-time in a containerised workflow like our environment? With a nifty tool called Falco!

What is Falco?
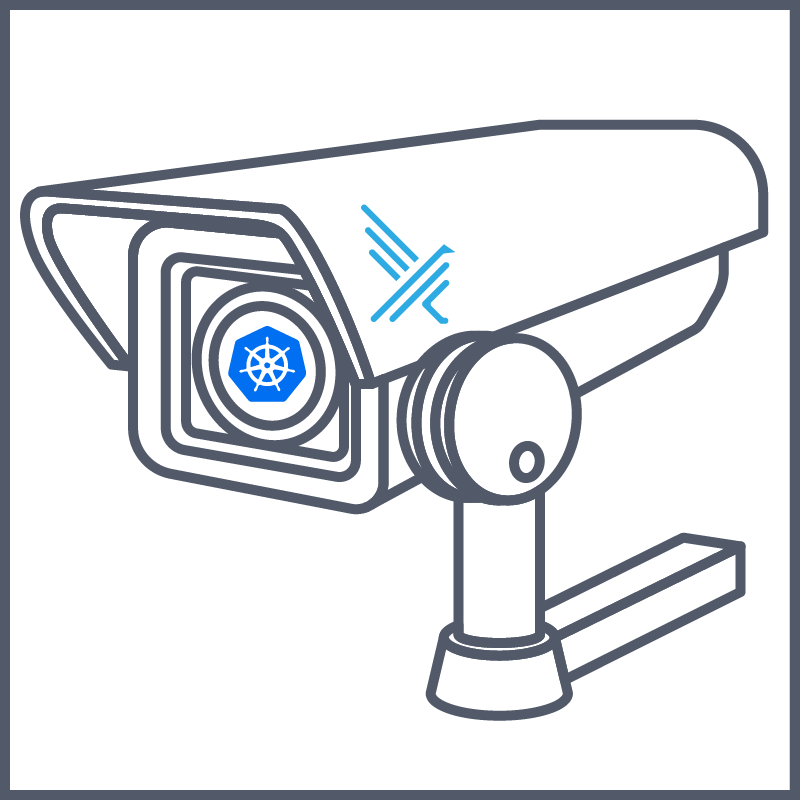
Falco is a runtime threat detection engine. In a nutshell, it analyses the behaviour of a system (in our case, imagine a environment), compares the behaviour observed against a list of predefined threat conditions, and, crucially, an alert is triggered if a positive match is found. In that way, Falco can be thought of as a security camera for modern applications. It monitors behaviour and alerts based on certain findings but will NOT shut down any detected threats (of course, automation can be set up to handle certain kinds of threats, but it's important to note that this is not within Falco's functionality). Falco was created by Sysdig and, as of 2024, reached the Graduation stage of CNCF (Cloud Native Computing Foundation), and so is the de facto standard for intrusion detection in cloud-native environments.
That sounds great, right? But does this work? How does Falco achieve this? Well, Falco is able to gain deep visibility into , host and cluster activity by analysing kernel system calls (as mentioned in the last task). As well as kernel system calls, Falco can analyse events from other data sources, most notably in our case, , via audit logs (as covered in task 2). On top of this Falco added application context to its findings to give improved insights, making our life as a engineer a lot easier. Below is an overview of the Falco architecture. We will cover how Falco works in depth so all these pieces and how they connect are clear.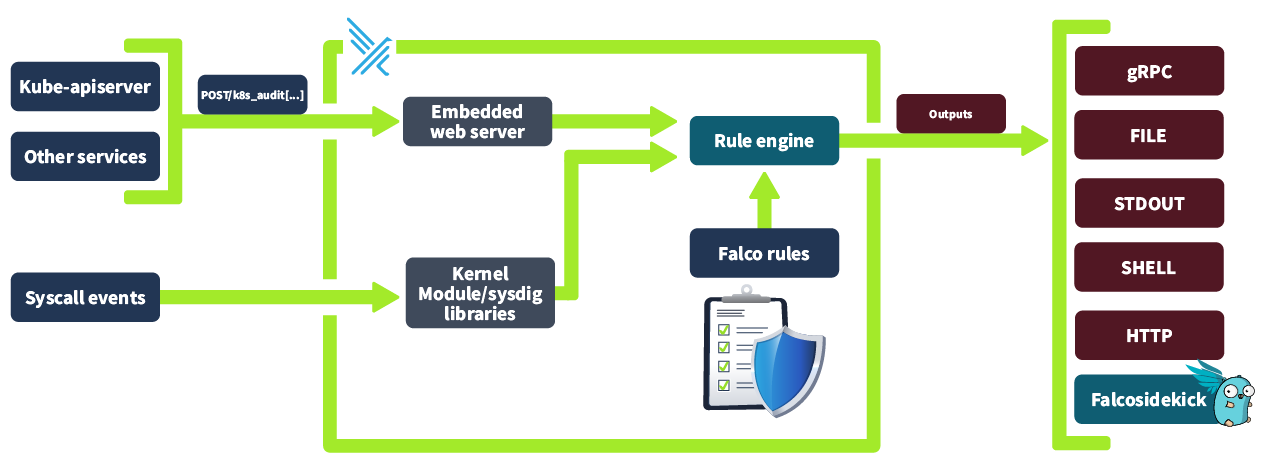
eBPF vs Kernel Modules
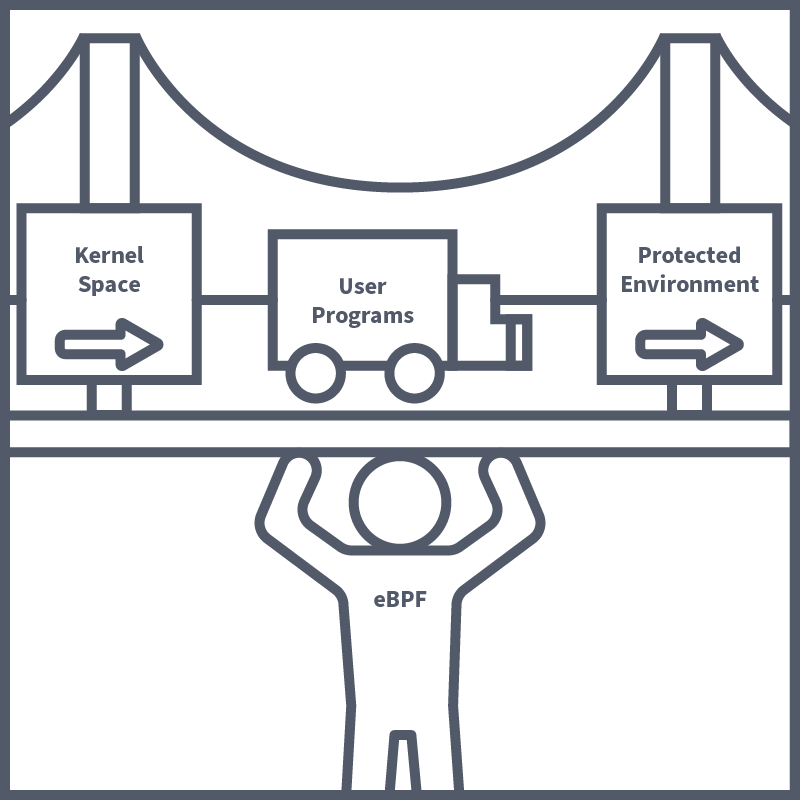
Before we dive deep into the inner workings of Falco, it's important to understand how one of the core technologies of which it is built works. This technology is eBPF (extended Berkely Packet Filter). It was mentioned above that Falco works by drawing insights from analysing kernel system calls; it is here where eBPF plays its part. eBPF is a kernel technology that allows engineers to make programs which run securely in the kernel space. The kernel space is highly restricted, and for good reason too, as a bug or error in a kernel program can cause a kernel panic, corrupted data and all sorts of catastrophes. It's because of this that applications running in the user space are blocked from direct access to the kernel space. This does cause problems in a security context, however, as access being blocked to the kernel space restricts visibility to low-level network and security events. These events are crucial for tools like Falco to function and for other tools that provide security insights.
eBPF is yet another hero coming to the rescue of engineers in pursuit of securing their environments. It solves this problem by allowing programs to run in a protected environment within the kernel space, which ensures the code is safe to run before being executed. These programs can be attached to various hooks and events in the system and allow tools like Falco to have a deeper level of access to kernel operation, allowing for in-depth analysis of security events without increasing the risk of a system crash.
Another method of analysing kernel-level system operations is using Kernel Modules. Kernel Modules allow engineers to extend the kernel's functionality, which can be done by loading custom code into the kernel. Kernel modules can be leveraged to capture detailed information about process execution (such as process context switches, creation, and termination). The kernel module is the default driver that will be enabled when Falco is installed.
We're about to go into detail about the workflow of Falco and the key components that allow it to work. One of those key components is the drivers, aka how the system call events are captured in the kernel space. This is why eBPF and Kernel Modules were defined, as these are the two driver options available in Falco. The biggest factor that would inform the decision over which driver you should choose is the ability to install kernel modules in an environment. Some environments (such as GKE and the Google Engine) do not allow (or trust) kernel modules, so eBPF would be chosen for this instance. There are, of course, other factors, such as security, isolation, performance, etc, to consider, but for this lesson, it is only important to understand that these are both methods of capturing system call information in the kernel space. Another important note in the context of this room is that both of these drivers will work in a environment.
Falco Workflow
Take a look at the diagram below. This illustrates how Falco works under the hood:
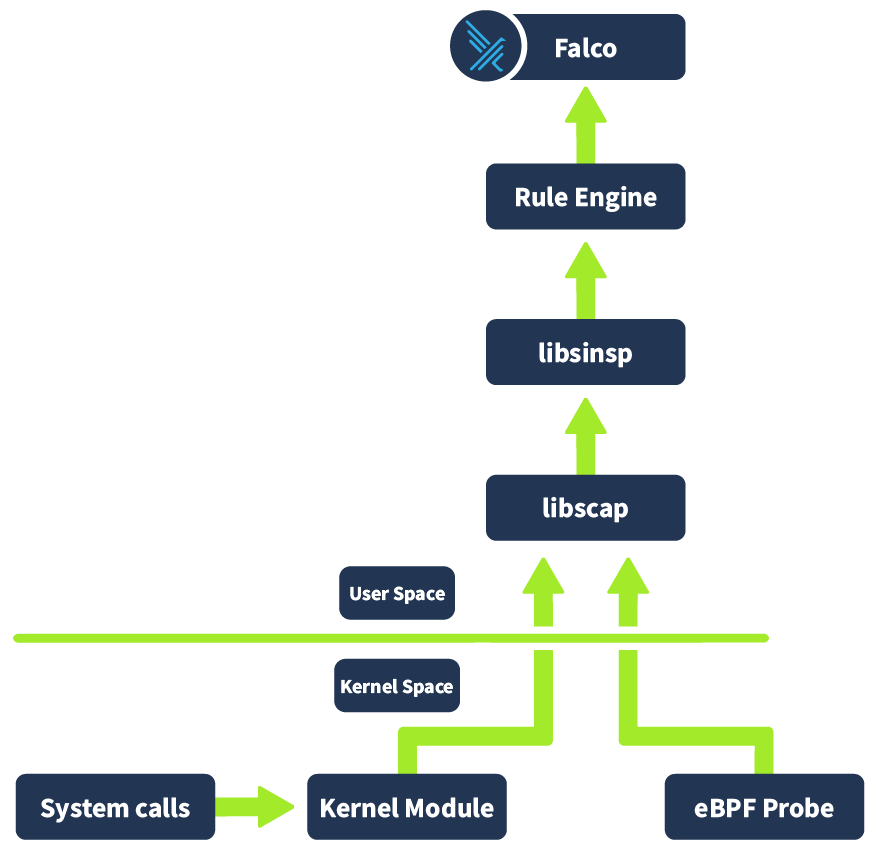
Let's try to understand this better by following an event from its origin as a system call in the kernel space to its evaluation and assessment in Falco. First off, the system call occurs in the kernel space, and whichever driver is installed (e.g. Kernel Module or eBPF probe) captures information about this event. This information is then placed in a ring buffer (a mechanism the Kernel provides for efficient communication between kernel space and user space). This information is then collected by libscap (library for system capture), a userspace library which forwards these invents to libinsp (as well as implementing state collection r/w of scap files where captured system events and state information is stored). Libinsp (library for system inspection) enriches the events received from libscap with machine state (current state of the system, in what environment has this event occurred? etc), adding context to the raw events. These enriched events are evaluated by a Rule engine, which will be elaborated on in the next task. If an event matches a rule (either included by default or defined by a user), it generates an alert that is sent to the Falco userspace program. The Falco program then sends out the alert to whichever alert channel has been configured. The available alert channels are: standard output, a file, Syslog, a spawned program, an (S) endpoint, a client via the or finally Falco sidekick (covered in an upcoming task).
That's a lot of information, and it's that way because solving problems such as difficulties detecting real-time threats in a cloud-native environment like a environment takes a lot. This "under the hood" logic enables Falco to analyse events from system calls, as well as other sources such as audit logs, provide valuable security insights, and alert us to their presence. Take a moment to let the information digest, take another look at the diagrams in this task and try to visualise the workflow, if you like, before answering the questions below and going on to the next task, where we will be taking a look at Falco from a practical/user perspective.
Falco can gain deep visibility into a Kubernetes runtime environment by analysing events from various sources. Which source (covered in task 3) is available in Kubernetes?
What allows user programs to run securely in a protected environment within the kernel space?
Enriched events are compared against _____, which can either be included by default or user-defined.

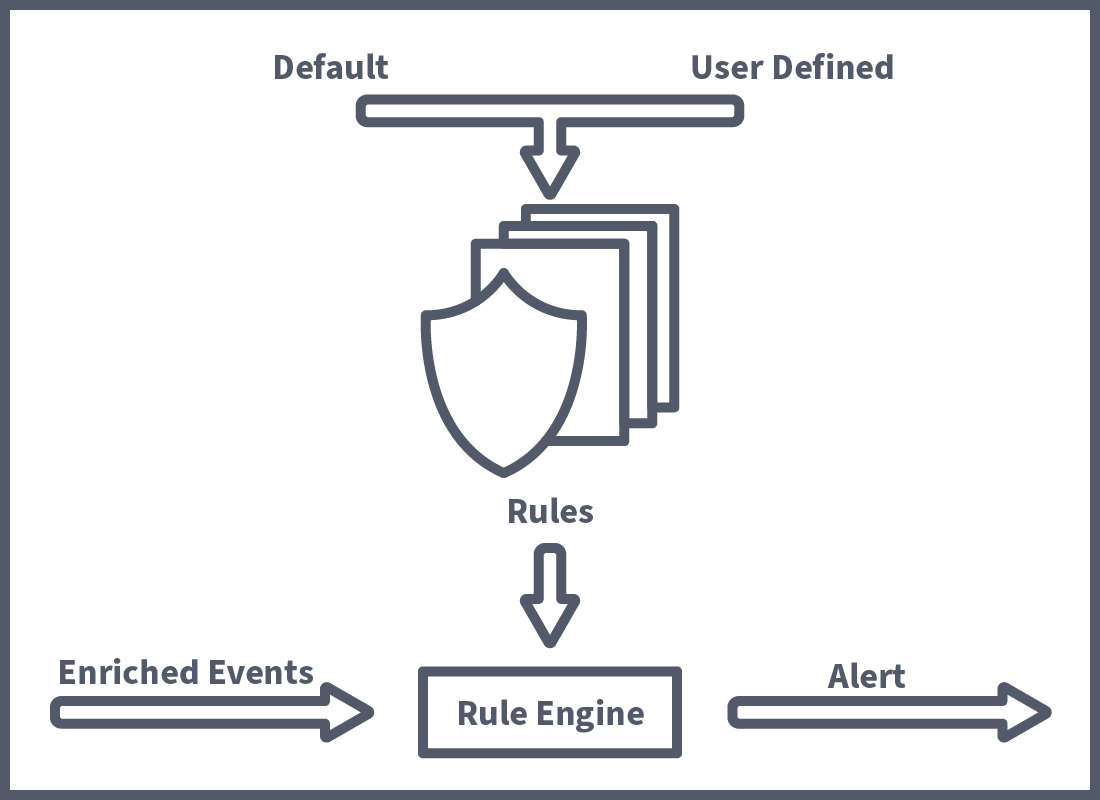
The previous task defined how Falco works. This task will discuss some key Falco concepts that allow us, as engineers, to unlock the tool's true power. First off, we're going to take a look at how the rule engine mentioned in the previous task works. As covered, the rule engine receives enriched events to analyse. These events can come from various sources, such as system calls, and K8s Audit log events, but other sources can be added using plugins. Plugins include a lot of interesting options, such as devices and the like, but are slightly out of the scope of this room. These events are then compared to a set of rules, including some predefined by Falco and custom rules made by the user. We'll now take a look at how rules are defined so you can use them to detect custom runtime events.
Building a Rule
As mentioned, you can harden the K8s runtime environment by setting up real-time threat detection using Falco rules. We will learn how, as a Engineer, you would write these Falco rules. A Falco rule is defined in . Below is an empty rule example with the required fields. We're going to go through each of the fields and start to populate this rule as we go along:
- rule:
  desc:
  condition:
  output:
  priority:
The rule and description fields are as they sound. The rule can be named as the user sees fit, and the description should describe the purpose of the role. Next up is the condition field, likely the most important part of the rule definition. The condition field is made up of different "conditions" (e.g. process name = bash) and operators (e.g. and, or); events will be compared against these conditions and operators, and if "TRUE" triggers an alert. We will now take a look at the syntax of conditions in a Falco rule. To begin to understand the syntax, let's take a look at what a condition that alerts when a bash shell is run inside a container looks like:
container.id != host and proc.name = bashThis statement is looking for an event which has happened in a (if an event occurs on the host system .id will equal host; therefore, this event checks for the inverse, making sure the event has occurred in a ) and that the process being run is bash (proc.run = bash). However, currently, this condition will be met not only when the bash shell is run inside the but on every single subsequent event that happens after (because we have not specified a specific system call to filter on, so all events such as file creation etc will match these criteria). This will result in alert systems being flooded, which is bad practice. To better tailor our alert, we can add some conditions to ensure the alert is only triggered on a successful shell attempt. As mentioned, this is happening because we have not specified a system call to filter on. We can specify this by providing an event type (evt.type):
evt.type = execve and evt.dir = < and container.id != host and proc.name = bash
The event type we are filtering inspects a spawned process (execve). Evt.dir means event direction, a value of ">" is an entry event and means the system call is invoked, aka Falco has detected the intent to perform a system call. A value of "<" is an exit event and means it occurs after a system call has taken place; we use this in our context to get Falco to determine when the process has been spawned, aka a user has successfully run a bash shell in a , Okay that's a lot of syntax (and if you're hungry for more feel free to dive deeper into what is possible with conditions here (opens in new tab)) so let's take a step back and fill out that template with what we've learned so far:
- rule: container_shell_detection
  Desc: a rule that detects shell activity in a container
  condition: >
    evt.type = execve and
    evt.dir = < and
    container.id != host and
    proc.name = bash
  output:
  priority:
Next up, we have output. Output is used to provide some information in the alert. You can populate this field with a text string describing the event and reference fields (the same ones available to you when creating a condition) to provide additional metadata surrounding the event. This is done by prepending a per cent character (%) in front of the fields; the value of this field will then be returned as its value when output (kind of like printf if you're familiar). So, for example, if we wanted our output to include the username, ID, name, process name, parent process and the command line used to invoke the process, your output field would look like this:
Shell Detected in Container
(user=%user.name container_id=%container.id container_name=%container.name
shell=%proc.name parent=%proc.pname cmdline=%proc.cmdline)
Finally, we have priority, which is used to categorise the event's severity and is included in the alert output. The options are: Emergency, Alert, Critical, Error, Warning, Notice, Informational and Debug. For our purposes, let's choose "Warning". Put that all together, and we have a fully defined rule:
- rule: container_shell_detection
  Desc: a rule that detects shell activity in a container
  condition: >
    evt.type = execve and
    evt.dir = < and
    container.id != host and
    proc.name = bash
  output: >
     Shell Detected in Container
    (user=%user.name container_id=%container.id container_name=%container.name
    shell=%proc.name parent=%proc.pname cmdline=%proc.cmdline)
  priority: WARNING
Rule Efficiency with Macros and Lists
Now that you know how to define a Falco rule let's take a look at how we can make these rules more efficient and our lives easier with Macros and Lists. Let's start with Macros.
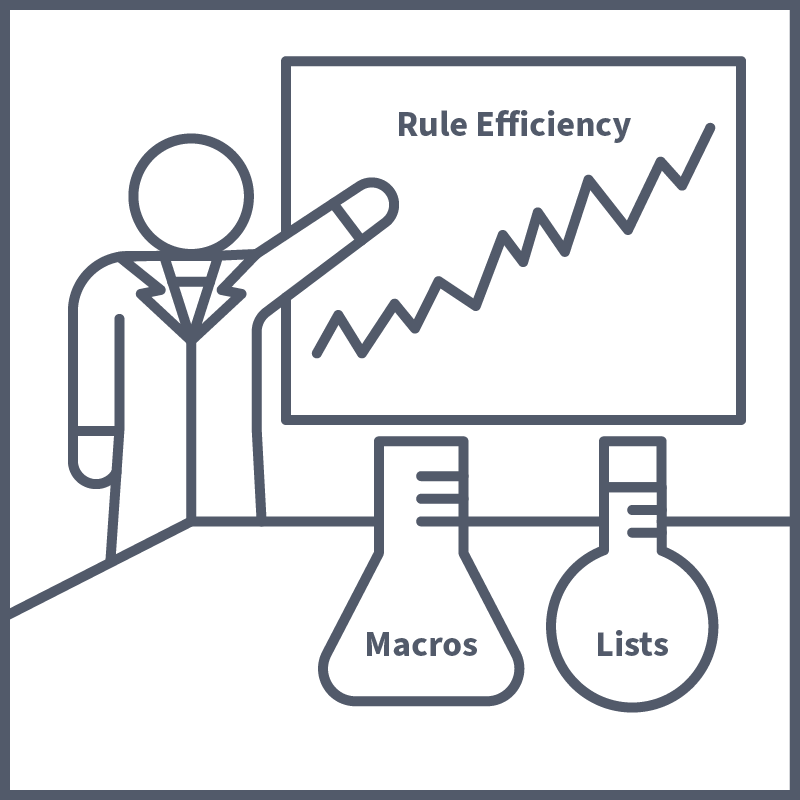
Macros are used in Falco rule definition as a way to abbreviate conditions that are used frequently across multiple rules; this saves time, meaning a condition that is used repeatedly doesn't have to be typed out every single time. Part of the reason why the above example was chosen is because the conditions defined are very common in Falco's rule definition. So common this is the condition covered in the Falco documentation when discussing rule definition, and there exists two Macros by default which can be used to abbreviate two of the conditions above:
A default macro for the condition exists but would be defined like so:
- macro: container
  condition: container.id != host
A default macro for the spawned process condition exists but would be defined like so:
- macro: spawned_process
  condition: evt.type = execve and evt.dir = <
With these Macros both defined, our condition field would no longer need to be defined like this:
condition: >
    evt.type = execve and
    evt.dir = < and
    container.id != host and
    proc.name = bash
But like this:
condition: >
    spawned_process and
    container and
    proc.name = bash
Both rules and Macros are defined in the file rules/falco_rules.yaml. However, when deployed in a Kubernetes cluster, this file will be contained within a Falco pod in the /etc/falco directory.
Next up, we have lists, which are a handy way to reference a collection of “items” in a condition. Items can be anything from processes you want to check for to a directory which contains sensitive files. Let’s consider the latter example; we could define a list which includes all the sensitive directories we want to check for like so:
- list: sensitive_directories
  items: [/k8slabs/security,/k8slabs/subjects/results,/k8slabs/config]
We can then use this list in a Macro or condition, like so:
- macro: sensitive_access_attempt
  condition: env.arg.target in (sensitive_directories)
With that covered, you now have all the knowledge required to build custom rules. As mentioned, there are macros which are included by default, but as a engineer, the job can fall on you to make your (and your team's) life easier by defining macros specific to your environment and threat events that you want to detect, lists can be utilised in the process of this Macro definition to make your life even easier. Hopefully, these last two tasks have communicated how powerful Falco can be as a runtime threat detection engine in and how you can unlock that power by defining Falco rules.
When defining a Falco rule condition, what snippet could be used to match bash processes?
What can be used to reference a collection of items in a condition?
What can be used to abbreviate conditions which are frequently used?

Now that Falco has been thoroughly covered and it's been discussed how the tool can be used to detect threats at runtime in a cluster and alert when they do emerge, we're going to take a look at some other tools we can use in conjunction with Falco to translate those alerts into visualised patterns that are easy to analyse. Our main goal here is to increase visibility at runtime; Falco is our detection engine and lets us know what's going on via alerts; let's look at how, as Engineer, we can increase the visibility of those alerts using Falcosidekick, and Grafana.
What is Falcosidekick?
Falcosidekick isn't another tool entirely but a companion project to Falco that can be enabled during/after configuration. Its primary function addresses an issue users were running into when using Falco. That issue is the limited options for alert outputting that are available out of the box, which, if you remember, are: standard output, a file, syslog, a spawned program, a (S) endpoint or a client via the . These options are helpful in a great number of cases, but modern IT infrastructures are made up of all kinds of tools and services; it's only natural that users started to want Falco integration to said tools and services. This is where Falcosidekick comes in.
At the time of writing, Falcosidekick enables the forwarding of Falco events/alerts to 60+ services (this number is one that keeps growing over time). This greatly increases the power of Falco and allows for easier integration into almost any environment. This allows for integration to ChatOps tools like Slack and Microsoft Teams when events happen, as well as custom forwarding rules to allow for granular control over this so messages are only sent out for critical events and not spammed in various channels. This also allows for integrations with various cloud services, meaning functions can be spun up, and mitigative actions can be performed (using, for example, functions if you're familiar with them). Most importantly for this task though, it allows for the forwarding of Falco events to monitoring and logging platforms. This integration allows us to greatly increase our visibility of security threats at runtime in a environment. More on this later in the task.

Another feature included with Falcosidekick that helps with the visibility and monitoring of security events at runtime is the optional webUI component. This web-based user interface gives users a quick view of what's going on in their Falco environment. The component can be enabled and accessed via port forward in a environment. Here, you can find menus allowing you to look over events that have occurred and drill down to get more information on them. You can also visualise key data points via dashboards, which help track things like the volume of events per data source. All this to say, Falco is the hero who saves the day (at runtime), and every hero has their sidekick who can bring a little more to the table.
What are and Grafana?
More Tools! Yep, your already large arsenal of tools is about to grow. Many issues in tend to have some open-source solutions in the form of nifty tools, and as we've seen so far, runtime security is no different. is an open-source systems monitoring and alerting tool, it was first built in 2012 at SoundCloud. It is now a stand-alone, open-source project attached to no company and is also part of CNCF. collects and stores timestamped metrics information, known as time series data. This time series data can be stored alongside optional key-value pairs known as labels. In terms of what metrics are collected, there can be a wide variety of different system metrics. Usually, what is collected in is performance metrics.
As with all tools, how they are used is usually different depending on where it is they are being used; maybe you're monitoring a front-end application and want to track response times or timeouts, or perhaps you need to monitor database call rates or response times on the back end, in most cases both are useful. In a security context, these metrics can be useful in troubleshooting an ongoing incident, with time series data often providing insights into what resource is being leveraged in an attack, when the attack started (and if it's still ongoing) and suspicious spikes in traffic. As mentioned, all of these metrics help provide insights, but where needs some help is the visualisation of these metrics. This is where Grafana comes in.
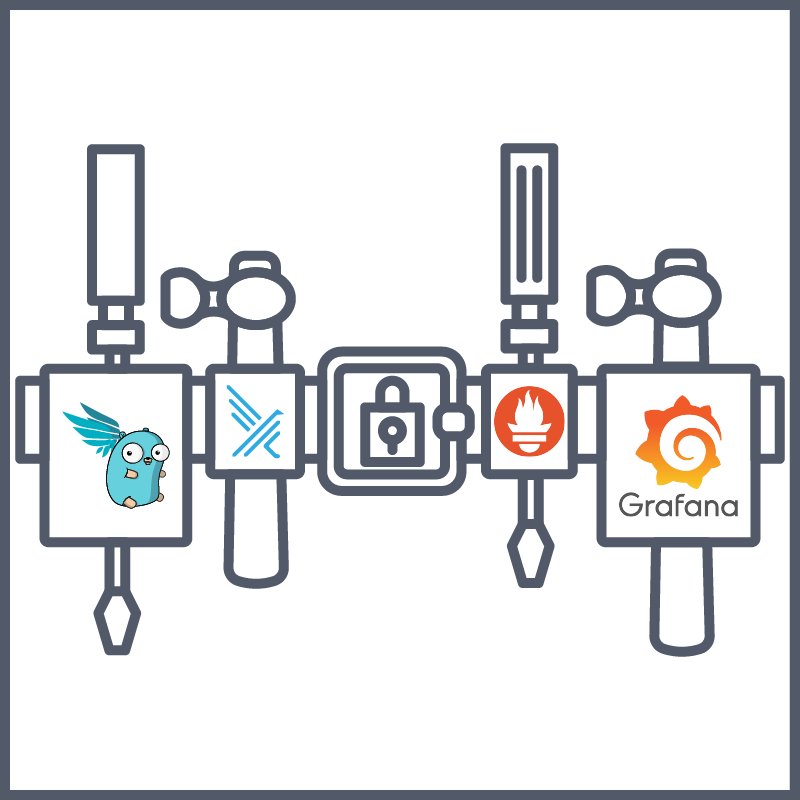
Grafana is an interactive data visualisation platform which was developed by Grafana Labs. Grafana allows for collected data to be visualised using charts and graphs. These charts and graphs can be grouped together into a dashboard, these dashboards can be made for specific purposes, for example, one monitoring front-end performance and another the back-end performance. These dashboards can then be made accessible to relevant teams; this ensures high levels of team-wide visibility of a system, meaning performance issues that threaten an application's robustness or emerging security incidents can be spotted quickly.
The data that is being visualised can be collected from all kinds of sources. In our case, it's most important to note that data can be collected from a cluster, but all sorts of other cloud and non-cloud services can be monitored using Grafana.
The Dream Team
There's been a lot of talk about monitoring, metrics, and data sources, and it's easy to get lost in the weeds when there are so many tools on the table, each with a similar job. Let's look at each of the tools discussed and how their distinct purposes and strengths can work together to create one efficient runtime security solution. Our mission when creating our runtime security solution is to ensure security threats, performance anomalies and the like that emerge at runtime are detected as soon as possible to mitigate impact; the key to all of this is detection and visibility.
First off, as we have established, we use Falco to define rules that detect threats at runtime. There are a number of built-in rules that detect common system call events associated with security threats. Custom rules can be defined depending on the needs of your application and other data sources for events (such as audit logs). This covers the detection side of things. Falcosidekick can be used to gain a level of visibility over alert triggers and events, but to gain greater levels of insight and visibility; we bring in . Falcosidekick, as mentioned, also functions as a forwarder; we can then use this to forward Falco events to . This then allows for the collection of Falco alerts or system call data as time series data perfect for detecting trends and anomalies. The final piece of the puzzle is Grafana, which is very commonly used as a visualisation layer on top of , allowing for the creation of graphs/dashboards which can give the team easy-to-read visualised data that tracks metrics like event rate per second, alert triggers in a group of resources etc. This example, common in real-life implementation, hopefully gives you an idea of how these tools can leverage each of their respective strengths to create one efficient solution.
By now, it should be clear that a key skill that is developed as a engineer is acquiring knowledge of the ocean of tools available in this space and knowing how they work and can be used together to solve the issues that come our way when securing dynamic, often cloud-based solutions. With that said, answer the questions below, and then I think it's time to get hands-on!
Which tool covered in this task can be used as a visualisation layer and allows collected data to be visualised as charts and graphs?
Which tool covered in this task collects and stores time series data?
Which tool covered in this task is a companion project that can act as a forwarder for Falco?
Set up your virtual environment


Now coming to the end of your first month here at Laboratories, you're starting to feel comfortable in your routine. This routine continues with another daily stand-up call. This time, your teammates are having a conversation regarding the runtime security currently in place. The problem raised is that a decision was made to introduce Falco into the company's tech stack, but the employee who set it up left shortly after; because of this, the tool has yet to be tested or optimised. Your growing confidence gives you the push you need to volunteer for this one and you are assigned the ticket. Now it's time to put your money where your mouth is, money in this case being your ability to implement, test and configure runtime security in using Falco.
Let's get started, shall we? Click the green "Start Lab Machine" button, and allow 2 minutes for the to boot up. The machine will start in Split-Screen view. In case the is not visible, use the blue Show Split View button at the top of the page. Once booted up, run the following command to start the minikube cluster:
user@tryhackme$ minikube start
Give it a few minutes and the cluster will eventually start. After waiting a few minutes run the following command:
user@tryhackme$ kubectl get pods
Here you should be able to see the Falco pod running; this means the system calls, and Kubernetes audit events in our cluster are being monitored and evaluated against Falco rules. We can see this in action by triggering one of these rules. Take, for example, a shell being spawned inside a . This is a good event to track, as it can sometimes be the first step attackers take when attempting to escalate privileges. Because of this, it is a rule built into Falco by default. Let's test our cluster and see if it is being monitored. First, let's spawn a shell in a to trigger the rule (replacing falco-pod-name with the name of the falco pod running in the cluster):
user@tryhackme$ kubectl exec falco-pod-name -it -- /bin/sh
Then exit the container:
# exit
Now check if the alert was triggered. You can check this in the Falco logs. Run the following command to check:
user@tryhackme$ kubectl logs falco-pod-name | grep shell
Looks good! The event can be seen, which means Falco is monitoring our cluster at runtime! However, the rules that have been defined are good for common use cases. It was mentioned in earlier tasks that custom rules can be defined for those cases you want to monitor in your cluster which aren't covered by the default rules. Falco was initially installed in the cluster using helm using the default_values.yaml file located in ~/Documents/falcoctl-local.
user@tryhackme$ cd ~/Documents/falcoctl-local
You can add custom rules in this YAML file, and then when rebuilt using Helm, Falco events against these custom rules will also be evaluated. Let's apply a custom rule now. You can open the YAML file for editing by navigating to this directory and running (this example uses vi/vim but feel free to use your preferred text editor):
user@tryhackme~/Documents/falcoctl-local$ vi default_values.yaml
The file should open on a block where custom rules are defined (if not, navigate to line 437); here, a rule is defined that detects the use of a command within a container. However, the process being monitored has been left blank. Make a change to this rule so that it monitors for the use of the curl command in a container. Once done, save the changes. Now that the values have been updated, the Falco instance running in our cluster needs to be updated with these values. This can be done with the following:
user@tryhackme~/Documents/falcoctl-local$ helm upgrade falco ../falco -f default_values.yaml -n default
With this rule applied, it is time to test it. We have a pod running in the cluster that runs a curl command on boot. To test this rule, let's delete it. Since this pod is part of a deployment, it will self-heal and the pod will restart once deleted:
user@tryhackme~/Documents/falcoctl-local$ kubectl delete pod k8s-labs-deployment-5c655669dc-srrxmNow let's see if the rule triggered by checking the logs:
user@tryhackme~/Documents/falcoctl-local$ kubectl logs falco-pod-name | grep curlIt looks like it did; not only that but there's a directory mentioned in the curl command ran. Before navigating to this directory run the following command to grab the base64 signature of the custom rule you have configured:
user@tryhackme~/Documents/falcoctl-local$ sed -n '439,449p' default_values.yaml | base64 -w 0
Finally, navigate to the directory mentioned in the curl command, there should be a file there but it's encrypted. You can use the base64 signature of the configured rule to decrypt this file! Inside you will find the flag!
user@tryhackme$ sudo openssl enc -aes-256-cbc -d -in <file-name-here> -out flag.txt -pass pass:"base64-signature-goes-here"
With that, you have closed yet another ticket at Laboratories. Word of your progress has begun to circulate at the company and you have proven yourself quite an asset to the team.
What is the Base64 Encoded Custom Rule?
What is the THM flag value?

You made it! Here we are at the end of the room, and journeying through this room should have taught you quite a few things. First and foremost, securing a runtime environment is not easy. This goal of securing our environment at runtime comes with all kinds of problems and challenges. Thankfully for us, those who have trodden this path before us have considered these problems and devised a solution using runtime security tools like Falco. Let's summarise what was covered in this lesson:
- No matter how by the book your cluster configuration is, you need to be prepared for threats that can emerge at runtime.
- offers little in terms of runtime security, but audit logs allow us to gain insight into events occurring in our cluster and can be controlled using audit policies.
- There are different kinds of tools that can be used to secure our environment at runtime. Runtime enforcement tools, which allow for policies to be defined to mitigate the impact of certain security events and Audit tools, which allow for insights to be developed and observed by the analysis of audits, logs and other sources such as system calls to detect threats in real-time.
- Falco is a runtime threat detection engine which assesses events from different sources such as system calls (using a kernel module or eBPF) or audit log, against a list of predefined and (if defined) custom rules, alerting if a condition is met.
- As a engineer, you can implement tighter runtime security by defining Falco Rules to track events specific to your environment. Falco rules must contain name, description, condition, output and priority fields and can be made more efficient using macros and lists.
- The key to ensuring security at runtime is combining the power of runtime security tools like Falco with monitoring platforms like and Grafana, which increases team-wide visibility of runtime threats. This is done by utilising Falcosidekick to forward events to .
With all that knowledge safely transferred to your brain, Laboratories can easy knowing that not only has their infrastructure been securely configured following best security practices but is also being secured at runtime and continually monitored by you and your fellow team members. They're so pleased with your progress that they've decided you have passed your probation and deserve a cake! Long after the cake is gone, though, you will be left with the real prize here: the knowledge of how to secure a cluster.
All Done!
Ready to learn Cyber Security?
TryHackMe provides free online cyber security training to secure jobs & upskill through a fun, interactive learning environment.
Already have an account? Log in