AI System Reconnaissance
Discover AI infrastructure by scanning ML services, frameworks, and extracting metadata from APIs.
medium

To access material, start machines and answer questions login.
In the previous room, we looked at how to assess the threats that systems introduce to an organisation. That gave you a framework for thinking about what could go wrong when components are part of the infrastructure. This room takes a different angle. Instead of modelling threats, we go looking for the actual systems on a live network. The two skills are complementary but distinct: threat modelling works with assumptions about what exists, while reconnaissance confirms what is actually deployed and exposed.
When organisations add capabilities, their networks change in ways that most security teams never see. New services appear on unfamiliar ports. APIs respond in formats that standard scanners do not recognise. platforms, model registries, and experiment-tracking servers are deployed with default configurations that prioritise ease of use over security.
What is Reconnaissance
reconnaissance is the practice of identifying these components, understanding what they are, and what they expose. You still use tools like and curl, but the targets are different. Standard scanning wordlists and service detection miss infrastructure entirely because they were not built to find it.
Why This Matters Right Now
In January 2026, security researcher Maor Dayan ran a targeted Shodan scan and found 42,665 exposed agent instances (opens in new tab) on the public internet. 93.4% were vulnerable, and many were leaking keys through unauthenticated connections. Around the same time, GreyNoise captured over 91,000 attack sessions targeting deployments in three months. Attackers are already scanning for infrastructure at scale. Traditional tools miss it entirely.
By the end of this room, you will be able to find, fingerprint, and enumerate components in any target environment, and you will understand exactly what each one exposes.
This room answers:
- What does infrastructure look like on a network, and which ports and protocols give it away?
- How do you tell a Triton inference server from a regular , or an MLflow tracker from a Flask app?
- What sensitive information can you pull from exposed services using nothing more than curl?
- How do attackers scan for these systems at scale, and what does that look like from the defensive side?
By the end, you will be able to find, fingerprint, and enumerate components in any target environment.
Scenario
You are a security engineer at Cyphira, a mid-size fintech company that deployed several -powered features over the past year without a security review. Your CISO read a threat report about attackers hijacking exposed infrastructure and wants answers: which systems do we have, what they expose, and how an attacker could find them? Your job is not to break anything. It is to find everything.
Learning Objectives
This room focuses on infrastructure reconnaissance. Other rooms in the module cover architectural design, threat modelling, and . Here, we stick to discovery and enumeration. By the end, you will be able to:
- Identify the common components of a production / system and the ports, protocols, and paths each one exposes
- Fingerprint and services by analysing headers, response structures, error messages, and endpoint naming conventions
- Enumerate model metadata, experiment histories, and deployment configurations from exposed tracking servers and inference endpoints
- Map how components expand the traditional network attack surface, including new data flows, internal APIs, and supply chain dependencies
- Apply a structured reconnaissance methodology using existing security tools with -specific configurations
- Recognise the logging and monitoring signatures that indicate -focused reconnaissance activity against your infrastructure
Prerequisites
This room expects you to have covered the following room:
- / Security Threats (or equivalent understanding of system architecture and security concepts)
You should also be comfortable with basic command-line tools such as , curl, and grep, and be familiar with how requests and APIs work. No prior or engineering experience is needed.
Let's get started.
I understand the learning objectives and am ready to learn about AI system reconnaissance!
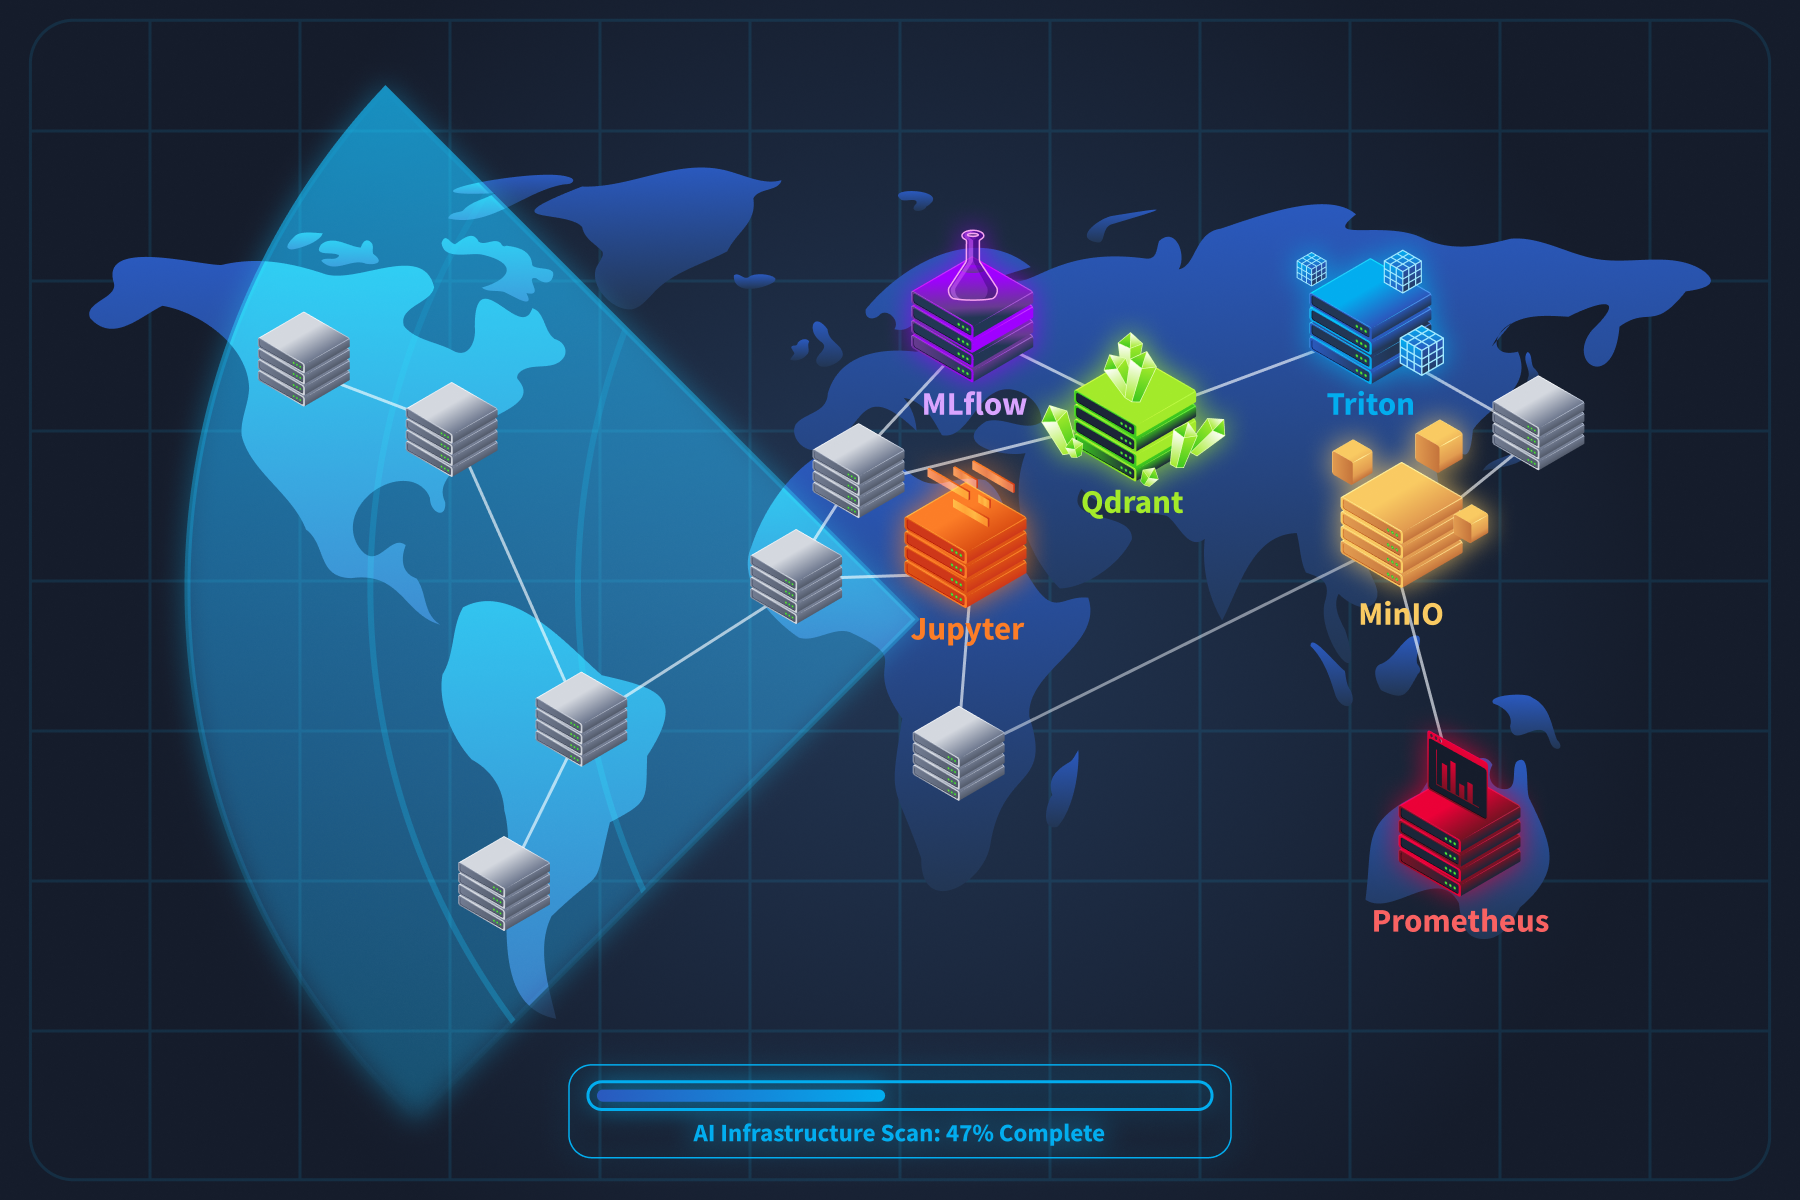
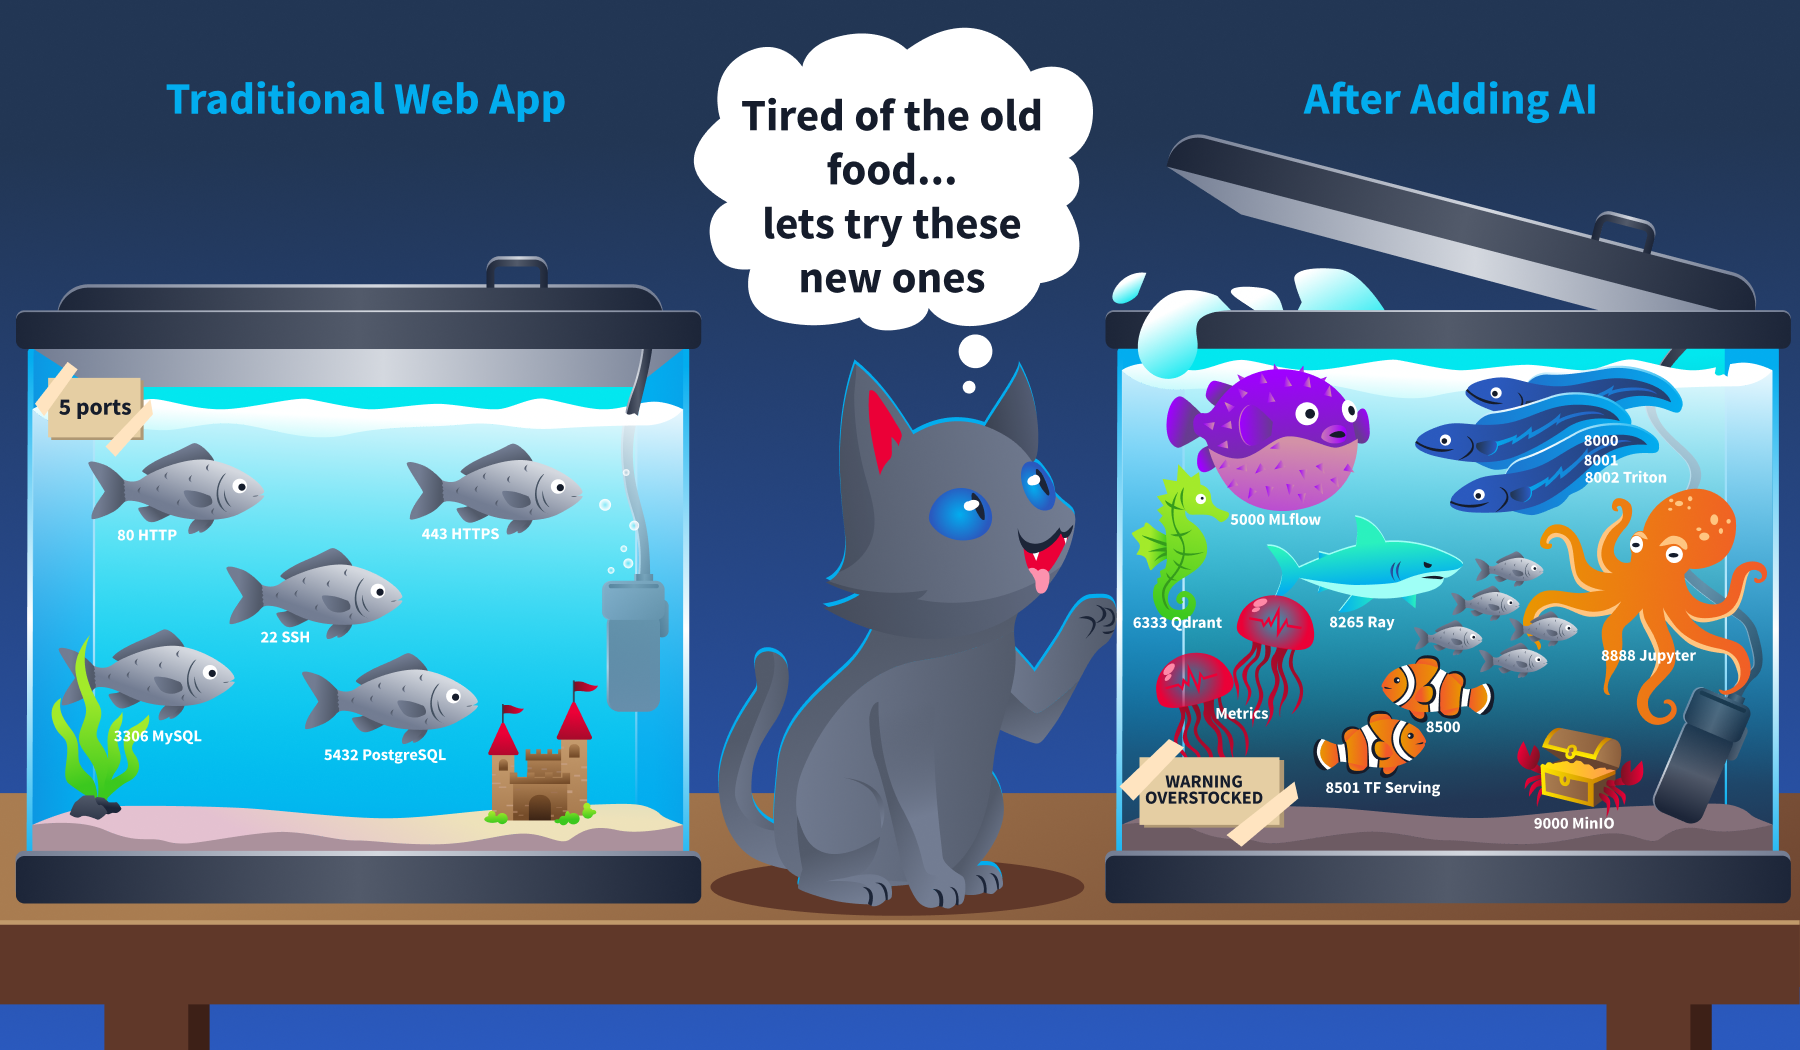
Now that we know what this room is about, let's talk about what you are actually looking for. When you scan a traditional network, you know what to expect. Web servers on ports 80 and 443. on 22. Databases on 3306 or 5432. You have seen these a hundred times. infrastructure looks nothing like that. It runs on ports most security professionals have never targeted, speaks protocols that standard scanners misinterpret, and exposes APIs that return data formats you will not find in any conventional web application.
Before we start probing anything, we need a mental map of the components. Think of this task as building your target list.
The Infrastructure Stack
A production system is not a single server. It is a collection of specialised services that handle different parts of the machine learning lifecycle. Here is what you will encounter during reconnaissance.
Model Serving Endpoints
These are the frameworks that load trained models into memory and expose prediction APIs. They are the front door of any deployment.
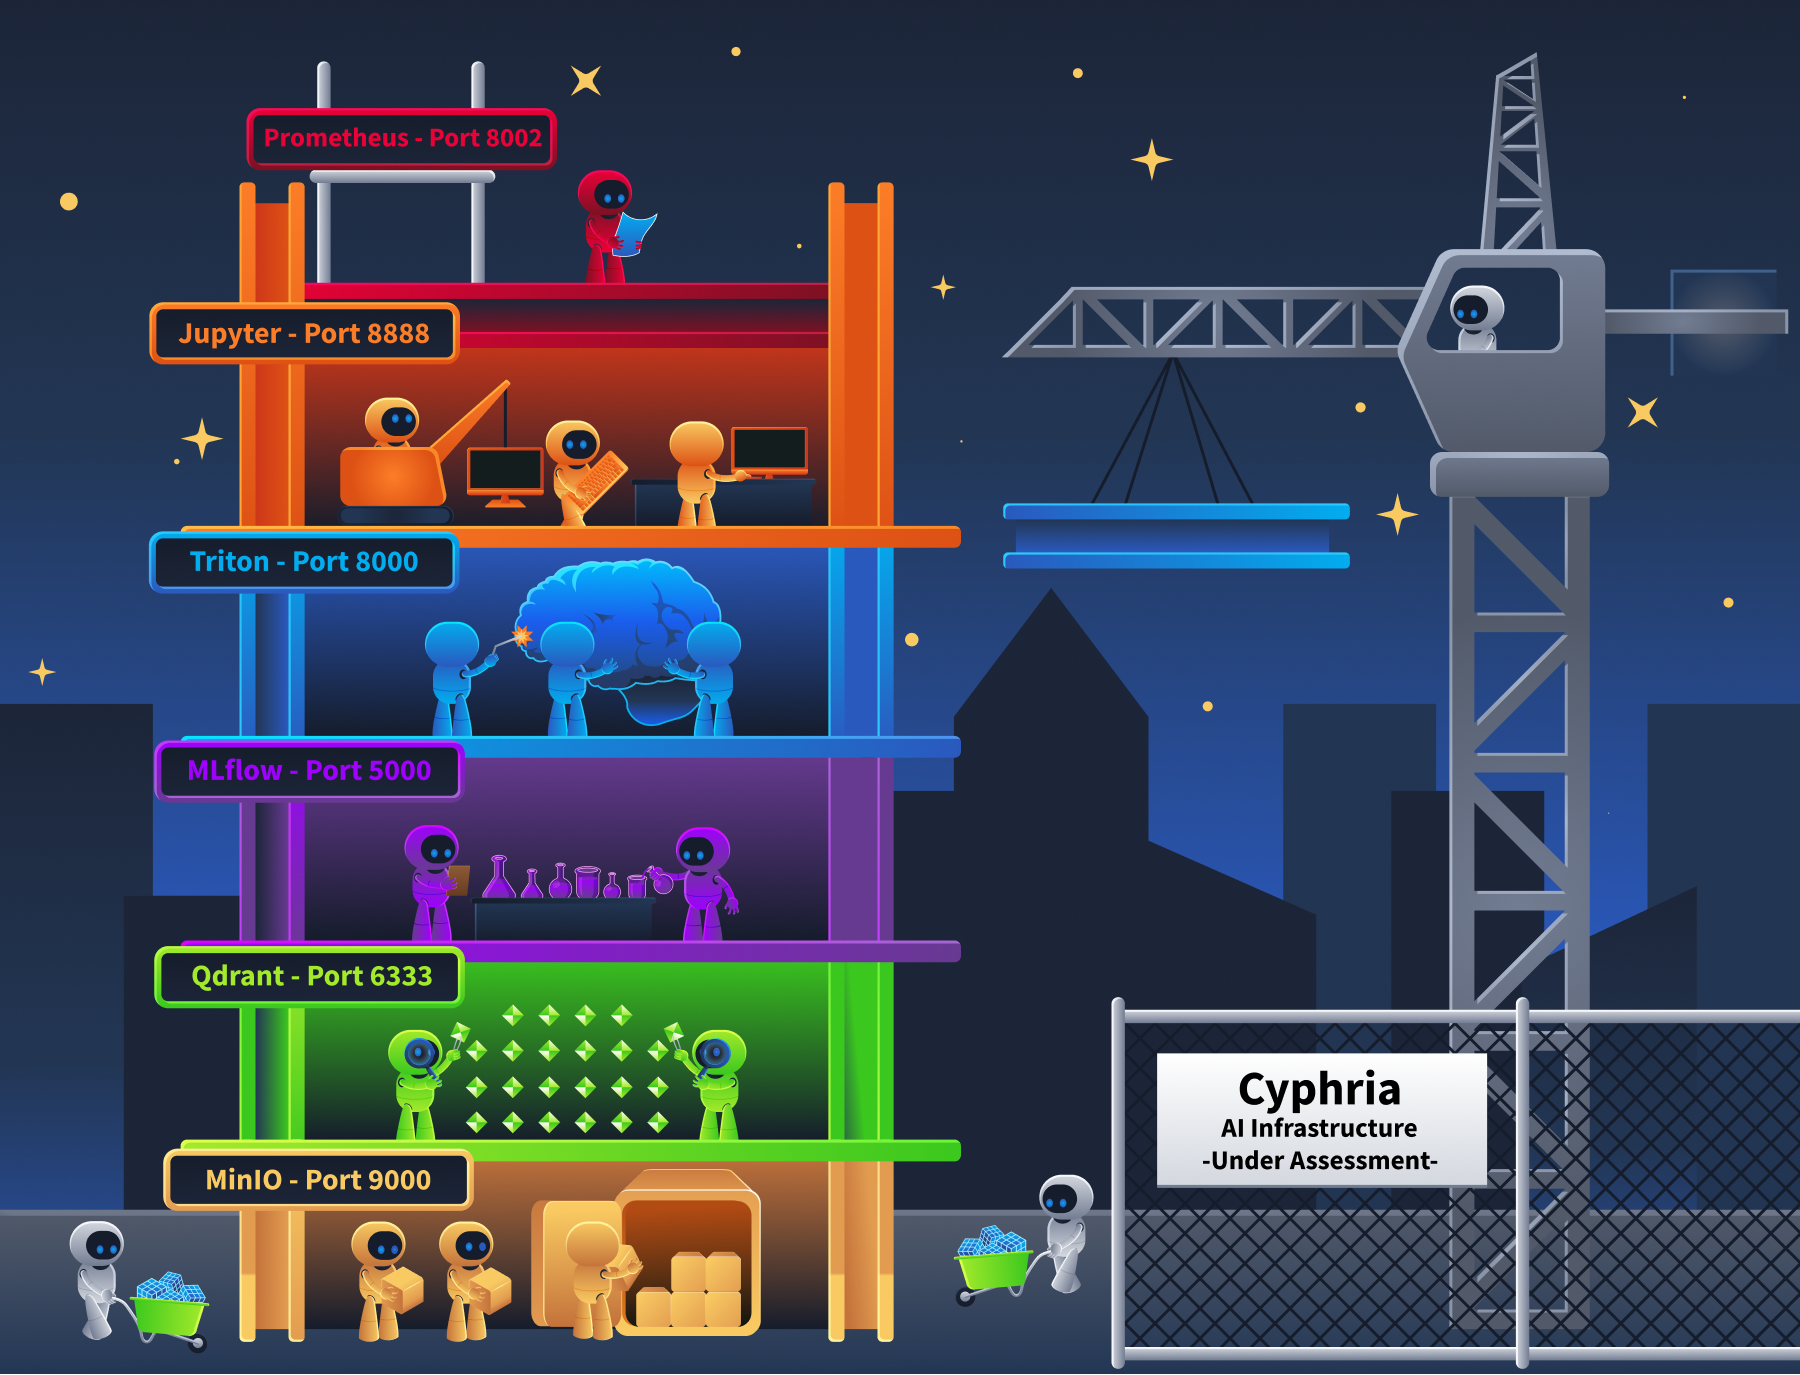
- NVIDIA Triton Inference Server is one of the most common. It exposes on port 8000, on port 8001, and metrics on port 8002. Three ports for one service.
- TensorFlow Serving uses on 8500 and on 8501.
- TorchServe exposes inference on 8080, a management on 8081, and metrics on 8082.
- For -specific deployments, Ollama runs on port 11434, and vLLM typically serves on port 8000. Both expose OpenAI-compatible formats.
Why do many of these expose both and at the same time? is faster for streaming large payloads between internal services. / is easier for client applications to consume. So they run both.
Orchestration and Experiment Tracking
These platforms manage the entire lifecycle, from experiment design through to model deployment. They are the highest-value targets during reconnaissance because they contain everything.
- MLflow Tracking Server runs on port 5000.
- It records every experiment, every hyperparameter configuration, every training metric, and every model artifact the organisation produces.
- If you find an open MLflow instance, you have found their complete research history.
- Kubeflow runs on (ports 80/443) and orchestrates training , notebook servers, and model deployments.
- Ray exposes a dashboard on port 8265 and a server endpoint on port 8000.
The ShadowRay campaign we mentioned in Task 1 targeted exactly this dashboard.
Vector Databases
These store embeddings (numerical representations of documents) and power semantic search for . If an organisation has an chatbot or knowledge assistant, there is almost certainly a vector database behind it.
- Qdrant runs on port 6333 for and 6334 for .
- Weaviate runs on port 8080 and includes a GraphQL endpoint. Milvus uses port 19530.
- Chroma runs on port 8000.
What makes these interesting from a recon perspective is that their schema endpoints reveal which model the system uses and what kind of data it contains. A collection called "internal-hr-policies" with 768-dimensional vectors tells you quite a lot about what that system is doing.
Model Registries
A stores the actual model files. Serialised .pkl, .pt, .onnx, and .mar files, along with version history, stage transitions (staging, production, archived), artifact URIs pointing to cloud storage, and the identity of who created each version. An unsecured registry is the single highest-value reconnaissance target. It maps the organisation's entire product portfolio in one place.
Supporting Infrastructure
- Jupyter notebooks (port 8888) often run with
--ip=0.0.0.0and no authentication. That gives direct terminal access to anyone who reaches the port. Data scientists also routinely store cleartext credentials in notebook cells. - MinIO (ports 9000 and 9001) provides S3-compatible object storage for model artifacts. Bucket listing is frequently enabled.
- Prometheus metrics endpoints on model servers (Triton on 8002, TorchServe on 8082) leak model names, batch sizes, GPU utilisation, and inference latency. You can map the entire deployment topology without ever touching the inference API.
Port and Protocol Reference
Here is the reference table you will use for the rest of this room. Keep it handy.
| Component | Default Port(s) | Protocol(s) | Recon Endpoints |
| NVIDIA Triton (Loads models into memory and serves predictions at scale) |
8000, 8001, 8002 | HTTP, gRPC, Prometheus | /v2/health/ready, /v2/models |
| TensorFlow Serving (Google's model serving framework for TensorFlow models) |
8500, 8501 | gRPC, HTTP | /v1/models/<name> |
| TorchServe (PyTorch's official model serving framework) |
8080, 8081, 8082 | HTTP | /ping, /models |
| Ollama (Local runtime for running LLMs on your own hardware) |
11434 | HTTP | /api/tags, /api/show |
| vLLM (High-throughput LLM serving engine with OpenAI-compatible API) |
8000 | HTTP | /v1/models |
| MLflow (Tracks experiments, stores models, and manages the ML lifecycle) |
5000 | HTTP | /api/2.0/mlflow/experiments/search |
| Kubeflow (Kubernetes-native platform for orchestrating ML pipelines) |
80, 443 | HTTP | /pipeline/apis/v1beta1/pipelines |
| Ray (Distributed compute framework for scaling AI workloads) |
8265, 8000 | HTTP | /api/jobs/, Ray Dashboard |
| Qdrant (Vector database for semantic search and RAG pipelines) |
6333, 6334 | HTTP, gRPC | /collections |
| Weaviate (Vector database with built-in GraphQL and module system) |
8080 | HTTP, GraphQL | /v1/schema, /v1/meta |
| Milvus (Distributed vector database for large-scale embedding storage) |
19530 | gRPC | Port 19530 connection |
| Jupyter Notebook (Interactive coding environment used by data scientists) |
8888 | HTTP | /api/kernels, /api/contents |
| MinIO (S3-compatible object storage often used for model artifacts) |
9000, 9001 | HTTP (S3-compatible) | Bucket listing |
| Prometheus metrics (Not a standalone AI service; exposed by Triton on 8002, TorchServe on 8082, and other ML servers as a built-in monitoring endpoint) |
8002, 8082 | HTTP | /metrics |
That is 14 components across 20+ ports. Compare that to a traditional web application, which might add 3 to 5 ports to a network. Adding an AI stack roughly triples the attack surface at the network layer alone.
Case Study: What Exposed AI Infrastructure Actually Looks Like
In Task 1, we mentioned that a January 2026 Shodan scan found 42,665 exposed AI agent instances. Let's break down what those instances actually were, because the number alone does not tell you much. The detail does. The most commonly exposed services included MLflow dashboards sitting on port 5000 with no authentication. Unauthenticated Jupyter notebooks on port 8888, some already compromised with cryptomining malware (Monero miners like peer2profit), deployed by earlier attackers who found them first. Open Ray dashboards on port 8265. Triton inference endpoints on port 8000.
These were not isolated findings. They were connected systems. IBM X-Force documented this pattern in their 2025 research on ML training infrastructure attacks (opens in new tab). In one case, they mapped a complete chain: a Jupyter notebook running on Azure ML contained cleartext MLflow credentials in a notebook cell. Those credentials pointed to an MLflow tracking server. The MLflow server's model registry contained artifact URIs pointing to S3 storage buckets holding the actual model files. Every component trusted the network boundary, so compromising one compromised the rest.
The Shodan dorks that found these services were not complicated:
port:5000 "MLflow"for exposed MLflow instancesport:8888 title:"Home Page - Select or create a notebook"for unauthenticated Jupyter notebookshttp.title:"Ray Dashboard"for exposed Ray cluster dashboardsport:8001 "triton"for Triton gRPC endpoints
Simple queries. Massive results. That is why the port reference table above matters. If you know the ports and the service banners, finding AI infrastructure is not hard. The hard part is knowing to look in the first place.
Agent Exercise
Now let's put what you learned into practice. Open the Cyphira Network Scanner agent.
You are starting the Cyphira AI Audit. The internal subnet is 10.10.45.0/24. Your job is to find every AI component on this network.
Step 1: Scan for AI services.
- Run the following Nmap command against the subnet, targeting the AI-specific ports from the reference table:
-
nmap -p 5000,6333,6334,8000,8001,8002,8888,9000,9001 -sV 10.10.45.0/24
- Review the results.
- Note which hosts have open ports and what service strings reports for each one.
Step 2: Identify the components.
- Now check for standard services to get the full picture:
-
nmap -p 22,80,443,5432 -sV 10.10.45.0/24
- Compare these results against Step 1.
- Which hosts are running only traditional services? Which are running infrastructure?
Step 3: Spot the non-obvious ones.
Using the port reference table from this task, match each open port to the component it likely belongs to. Note down the IP address, port, and your best guess at the component. You will confirm your identification in Task 3.
Submit your findings by answering the questions below.
What is the IP address of the host running an HTTP service on port 8888 in your scan results?
Which port does MLflow Tracking Server run on by default?
In Task 2, we built a mental map of the infrastructure stack: components, ports, and protocols. Now we need to figure out what is actually running behind each open port. This is where fingerprinting comes in. Standard service detection (Nmap -sV) often mislabels AI services. It sees HTTP on port 8000 and calls it "http-alt" It sees gRPC on port 8001 and does not know what to do with it. If you rely on the default Nmap output alone, you will miss what these services actually are.
Fingerprinting AI services requires a different approach; you need to look at:
- headers
- JSON response structures
- Error messages
- Endpoint naming conventions
Each AI framework has its own distinct signature, and once you know what to look for, identification becomes quick and reliable.
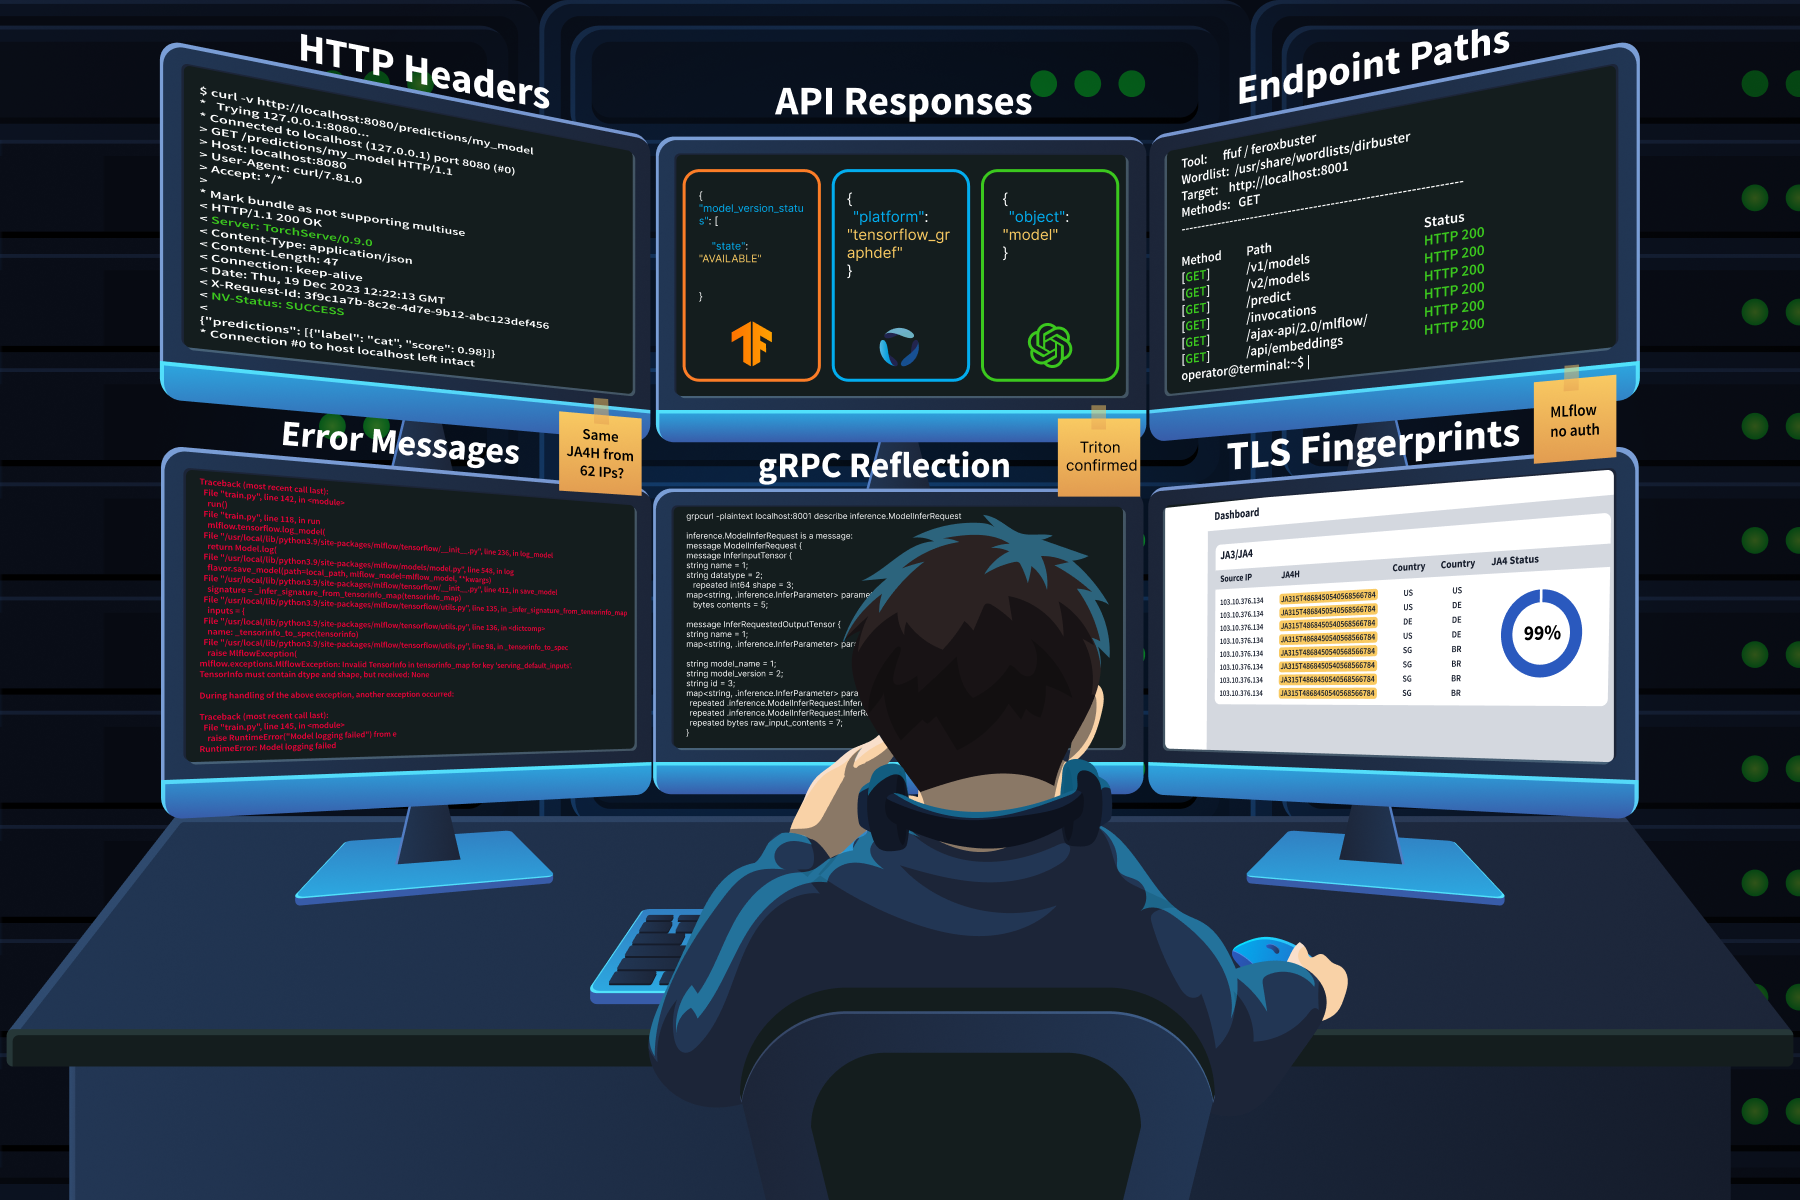
Header Fingerprinting
Response headers are often the fastest way to identify an AI framework. Many inference engines broadcast their identity unless an administrator specifically masks them behind a reverse proxy.
- TorchServe returns a
Server: TorchServe/0.x.xheader.- That is a direct identification with no ambiguity.
- Triton Inference Server includes a
NV-Statusheader in its responses.- It also responds to a specific request header: if you send
endpoint-load-metrics-format: text, triton returns hardware telemetry (CPU and GPU utilisation numbers) directly in the response headers. - No other framework does this: if you see GPU utilisation data in an HTTP header, you are talking to Triton.
- It also responds to a specific request header: if you send
- FastAPI-based ML services show
server: uvicornin the response.- When you combine that with routes like
/predictor/embeddings, you have a strong indicator of a Python ML backend.
- When you combine that with routes like
- OpenAI-compatible wrappers (vLLM, LiteLLM, Ollama) return
x-request-idheaders and structured JSON with an"object": "model"field on their/v1/modelsendpoint.
API Response Signatures
Each framework returns distinctly structured JSON. Once you have seen these a few times, you can identify the framework from the response body alone.
- TensorFlow Serving returns:
{"model_version_status": [{"version": "1", "state": "AVAILABLE"}]} - Triton returns:
{"name": "fraud_detector", "versions": ["1"], "platform": "tensorflow_graphdef"} - MLflow error responses include stack traces referencing mlflow.server and mlflow.tracking namespaces.
- Even the error tells you what you are talking to.
- OpenAI-compatible endpoints return:
{"object": "model", "id": "llama-3.1-8b", "created": 1700000000}
If you hit an endpoint and get back JSON containing "object" : "model", you are talking to something that speaks the OpenAI API format. That narrows it down to vLLM, LiteLLM, Ollama, or a custom wrapper.
Error Message Fingerprinting
This is one of the most reliable identification techniques, and it works because AI inference APIs are rigid. They expect specific tensor shapes and data types. Send something wrong, and they complain in ways that reveal exactly what they are.
The technique is simple: send a deliberately malformed payload and read the error response.
- Send a flat list of integers to a TensorFlow Serving endpoint that expects a complex tensor object, and you get back an error mentioning
tensorinfo_map. That string only appears in TF Serving errors. - Send a bad request to an MLflow server, and the stack trace references
mlflow.server,mlflow.tracking, ordatabricksnamespaces. - MLflow path traversal errors (CVE-2024-1558) go further, exposing full server filesystem paths.
- Databricks Mosaic AI returns Java exceptions
io.jsonwebtoken.IncorrectClaimExceptionfor malformed tokens. That is an instant identifier.
The reason this technique works so well is that frameworks produce errors that are much more verbose than those in traditional web applications. Data scientists need detailed debugging information during model development. Those debug-friendly defaults rarely get turned off before production deployment.
Endpoint Naming Conventions
Traditional REST APIs use resource nouns: /users, /accounts, /products. AI endpoints use computational action terms that stand out immediately during directory brute-forcing.
- Inference endpoints:
/predict,/invocations(the SageMaker convention),/infer,/generate,/embeddings,/score - Model management:
/v1/models,/v2/models - MLflow internal API:
/api/2.0/mlflow/(this prefix is distinctive and does not appear in any other framework) - Kubeflow pipelines:
/pipeline/apis/v1beta1/
If you are running ffuf or feroxbuster against a target, add these paths to your wordlist. Standard wordlists from SecLists will not include them.
gRPC Fingerprinting
Many AI services expose gRPC alongside HTTP.
- Triton uses gRPC on port 8001.
- TensorFlow Serving uses it on port 8500.
Traditional HTTP scanners miss these entirely because gRPC is a binary protocol that does not respond to standard HTTP probes.
The tool for this is grpcurl. If reflection is enabled (common in development environments that get pushed to production without hardening), you can dump the entire protobuf schema:
grpcurl -plaintext target:8001 listgrpcurl -plaintext target:8001 describe inference.GRPCInferenceService
That output reveals all available RPCs, the exact structure of every input tensor, and the format of every output. Think of it as the gRPC equivalent of finding a /openapi.json file on a REST API.
TLS Fingerprinting (JA3/JA4)
AI deployments have distinctive TLS signatures because internal service-to-service traffic is dominated by Python libraries (requests, urllib, implementations) rather than web browsers. JA3 and JA4 hash analysis can differentiate automated ML pipeline traffic from human web browsing at the network level.
The GreyNoise research we will cover in the case study below found that 99% of the attack traffic in one campaign shared the same JA4H signature, despite originating from 62 different IP addresses across 27 countries. That kind of uniformity points to shared automation tooling, and it is exactly what JA4 fingerprinting is designed to catch.
Case Study: GreyNoise LLM Endpoint Reconnaissance
Between October 2025 and January 2026, GreyNoise captured over 91,000 attack sessions targeting AI deployments through their Ollama honeypot infrastructure. One campaign stood out. Over 11 days starting December 28, attackers generated 80,000+ requests probing conversational endpoints to determine whether each target was compatible with OpenAI, Gemini, or Anthropic API schemas. They targeted over 73 different LLM model endpoints, including GPT-4o variants, Claude models, Llama, Gemini, DeepSeek, Mistral, Qwen, and Grok.
The fingerprinting technique was simple and effective. The attackers sent innocuous prompts: "hi" appeared 32,716 times. "How many states are there in the United States?" appeared 27,778 times. "How many letter 'r' are in the word strawberry?" was another common test. These prompts were not random. Each one produces a response that differs in structure, format, and content depending on which model is running behind the endpoint. By comparing the response format to known API schemas, the attackers could identify the exact model and proxy configuration without triggering any content moderation filters.
GreyNoise traced the IPs and found overlap with infrastructure previously used to exploit over 200 known CVEs, including React2Shell (CVE-2025-55182). Their assessment: "Professional threat actor conducting reconnaissance. The infrastructure overlap with established CVE-scanning operations suggests that this enumeration feeds into a larger exploitation pipeline. They're building target lists."
This is AI fingerprinting at scale. No exploitation. No payloads. Just systematic identification of what is deployed and how it responds.
Agent Exercise
Let's fingerprint the services you discovered in Task 2. Open the Cyphira Service Prober agent below. You know the IPs and ports from your scan results. Now you need to figure out what framework is running behind each one.
Step 1: Check the HTTP headers on the MLflow host.
- Run the following command against the service you found on port 5000:
-
curl -v http://10.10.45.12:5000/
- Look at the Server header in the response.
- What does it tell you about the framework?
Step 2: Probe the inference server's model endpoint.
- Run this against the service on port 8000:
-
curl http://10.10.45.15:8000/v2/models
- Examine the JSON response.
- Look for the
platformfield. - This tells you which ML framework built each model.
Step 3: Trigger an error message.
- Send a malformed request to the inference endpoint:
-
curl -X POST http://10.10.45.15:8000/v2/models/fraud_detector/infer -d '{"bad": "data"}'
- Read the error response.
- It will contain specific field names and data type expectations that confirm the framework identity.
Step 4: Check for gRPC reflection.
- Run this against the gRPC port you found on the same host:
-
grpcurl -plaintext 10.10.45.15:8001 list
- If reflection is enabled (a feature that lets any client query the server for its full API schema without prior knowledge), you will see the complete list of available services.
Step 5: Probe the remaining services.
- Check the vector database and Jupyter notebook hosts:
-
curl http://10.10.45.18:6333/collectionscurl http://10.10.45.20:8888/api/kernels
- Note what each response reveals about the service.
- Save your findings for Task 4.
Submit your findings by answering the questions below.
Which unique HTTP response header does the service on 10.10.45.15:8000 return to identify as an NVIDIA product?
When you run grpcurl against 10.10.45.15:8001, what is the name of the inference service listed in the reflection output?
In Task 3, we identified the framework behind each service. Now we need to extract everything those services are willing to hand over.
This is the part of reconnaissance where findings start getting serious.
- Fingerprinting tells you "that is an MLflow server."
- Enumeration tells you "that MLflow server contains 4 experiments, 3 production models, artifact URIs pointing to ://cyphira--models/, and the models were created by J.Chen( Enginner) at Cyphira"
One is identification. The other is intelligence.
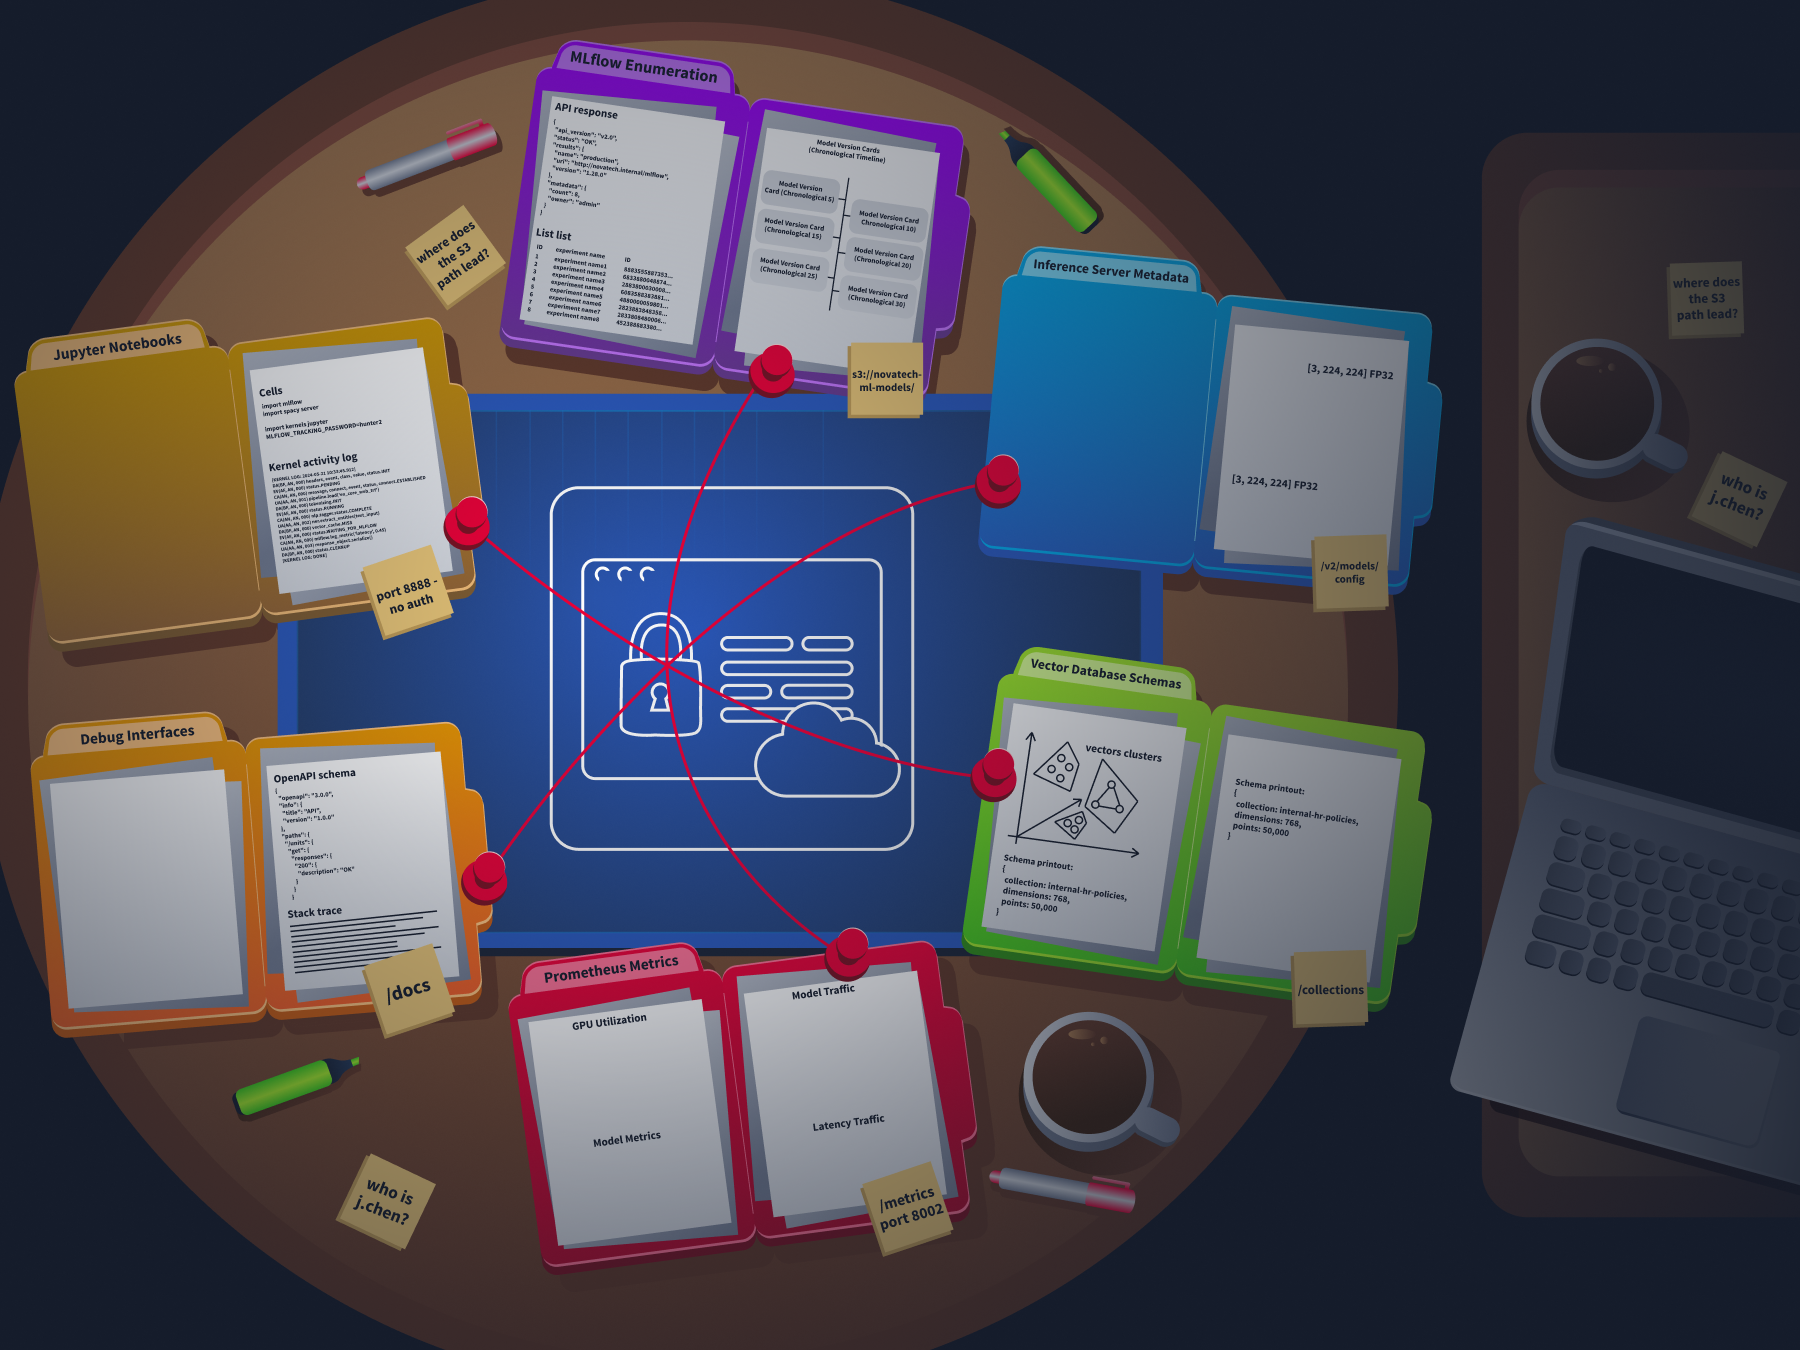
MLflow Enumeration
MLflow is the most rewarding service to enumerate because it stores everything in one place and exposes it through a clean . If you find an open MLflow instance, here is the chain you follow.
Step 1: List all experiments.
POST /api/2.0/mlflow/experiments/search
The response returns every experiment on the server with its name and internal ID. Experiment names often reveal project codenames and business objectives: fraud-detection-v3, rag-embeddings-tuning, customer-churn-prototype.
Step 2: List registered models.
GET /api/2.0/mlflow/registered-models/list
This returns the full model inventory. Every model the organisation has built and registered. Names, descriptions, and creation timestamps.
Step 3: Get model version details.
GET /api/2.0/mlflow/model-versions/search
This is where it gets serious. The response includes the source field, which contains the artifact URI. That URI frequently points to internal cloud storage: s3://internal-ml-models-corp/experiments/1/artifacts/ or a similar path. It also includes the user_id of the data scientist who created each version, creation timestamps, and stage labels showing which models are in production versus staging.
Step 4: Search training runs.
POST /api/2.0/mlflow/runs/search
Submit this with an empty body or a filter, and you get back hyperparameters, training metrics, and custom tags. Tags are particularly valuable. Teams use them for internal project codenames, Git commit hashes that link back to proprietary source code, and deployment environment identifiers.
Step 5: List downloadable artifacts.
GET /api/2.0/mlflow/artifacts/list
This lists the actual model files available for download. At this point, you have mapped the organisation's entire ML portfolio through five calls.
Inference Server Metadata
Triton and TensorFlow Serving both expose metadata endpoints that tell you exactly how to talk to the model.
- On Triton
GET /v2/models/<name>/configthe response includes input tensor names, their multi-dimensional shapes, accepted data types (FP32, UINT64, INT8), the maximum batch size, and the backend framework (tensorflow_graphdef, pytorch_libtorch, onnxruntime).- This is the equivalent of getting a complete database schema. It tells an attacker exactly how to format a valid inference request.
- On TensorFlow Serving
GET /v1/models/<name>/metadatareturns the same kind of input/output specifications, shape, dtype, and name for every input and output the model expects.
Vector Database Enumeration
Vector databases reveal what data the AI system is working with and which embedding model processes it.
- On Weaviate,
GET /v1/metareturns the server version and installed modules.GET /v1/schemareturns every class definition, including property names and the vectoriser module configuration.- That vectoriser field tells you which embedding model the system uses.
- Weaviate also exposes
/v1/graphqlfor full schema introspection and data querying on unauthenticated instances.
- On Qdrant,
GET /collectionsit lists all collection names.GET /collections/<name>returns vector dimensions, the distance metric, and the total point count.- A collection named
internal-hr-policieswith 768-dimensional vectors and 50,000 points tells you a lot about what that RAG system indexes.
- On Chroma, older versions expose
GET /api/v1/collectionswithout authentication by default.
Prometheus Metrics as Intelligence
Model servers often expose /metrics on a dedicated port (Triton on 8002, TorchServe on 8082). These -format endpoints return:
- Model names and version numbers currently loaded
- Inference request counts and latency percentiles
- Batch sizes being processed
- GPU memory utilisation per model
This is passive intelligence. You learn the deployment topology, which models handle the most traffic, how much GPU capacity backs them, and whether the system is under load. All without sending a single request to the inference API itself.
Debug Interfaces and Information Leakage
FastAPI-based ML services auto-generate /docs (Swagger UI) and /openapi.json. Both expose the full request/response schema, authentication requirements, and example payloads for every endpoint. Free reconnaissance.
MLflow's GraphQL endpoint /graphql has historically bypassed the REST API's authentication controls. An unauthenticated attacker could query internal resolvers like mlflowSearchRuns and mlflowGetRun, extracting host machine usernames, source code paths via mlflow.source.name tags, and the full project inventory. Appending ?debug=true or ?verbose=1 to AI gateway endpoints can trigger raw stack traces that reveal filesystem paths, installed library versions, and, occasionally, hardcoded credentials that failed to load from environment variables.
Jupyter Notebook Enumeration
GET /api/kernels on an unauthenticated Jupyter instance returns the names, kernel IDs, and last activity timestamps of running kernels. Enough to infer what code is executing. But the real value is in the notebook cells. Data scientists routinely store cleartext credentials for MLflow (MLFLOW_TRACKING_USERNAME, MLFLOW_TRACKING_PASSWORD), cloud storage access keys, and Hugging Face tokens directly in their code. This is often the bridge between compromising one service and gaining access to everything else in the stack.
Case Study: IBM X-Force ML Training Infrastructure Attack Chain
In 2025, IBM X-Force Red documented (opens in new tab) a complete attack chain that demonstrates exactly what this task teaches.
The attack started with a phishing attempt targeting a data scientist, which gave the attackers access to an Azure ML environment. Inside a Jupyter notebook, they found cleartext MLflow credentials stored in a cell. Using those credentials, they ran MLOKit, a CLI tool built by IBM's X-Force Red team specifically for MLflow reconnaissance.
MLOKit automated the entire enumeration chain. list-models to inventory every registered model. download-model to pull version metadata and artifact URIs. The tool walked the same API endpoints we covered above, but in an automated sequence. The entire ML portfolio was exfiltrated through standard REST API calls that the MLflow server treated as normal authenticated requests.
The chain went:
- Jupyter notebook (credentials) to MLflow tracking server (model registry) to S3 storage (model artifacts).
- Three components, each trusting the one before it.
- The security failure was not a software vulnerability. It was that each service was accessible, and the credentials to connect them were sitting in a notebook cell.
IBM later extended MLOKit to support SageMaker and other platforms, adding modules for list-notebooks, add-notebook-trigger (for code execution via lifecycle configurations), and poison-model (for overwriting model artifacts). The tool is open-source on GitHub (opens in new tab).
Agent Exercise
- Start with the MLflow server.
- Query the experiments endpoint:
curl -X POST http://10.10.45.12:5000/api/2.0/mlflow/experiments/search -H "Content-Type: application/json" -d '{}'. - Note down the experiment names and IDs.
- Query:
curl http://10.10.45.12:5000/api/2.0/mlflow/registered-models/list - Identify all model names, their current stage (Production, Staging, Archived), and version numbers.
- Query:
curl http://10.10.45.12:5000/api/2.0/mlflow/model-versions/search - This is where the serious intelligence lives.
- Look for the artifact URI (the S3 path where model files are stored) and the user ID of the person who created each model version.
- Query:
curl http://10.10.45.15:8000/v2/models/fraud_detector/config. - Extract the input tensor name, shape, data type, and max batch size.
- This tells you exactly how to format a valid inference request to this model.
- Query:
curl http://10.10.45.18:6333/collections/internal-kb-embeddings. - Extract the vector dimensions, point count, and any payload schema fields.
- What kind of data is this RAG system indexing?
- Query:
curl http://10.10.45.20:8888/api/contents. - Look for notebook files.
- Then check the contents of the most recently active notebook.
- Data scientists often leave credentials in their code cells.
What MLflow REST API endpoint would you use to retrieve the artifact storage location for a specific model version?
What is the cleartext password for the MLflow service account stored in the Jupyter notebook on 10.10.45.20?
In previous tasks, we identified components in the network, determined which framework each component runs on, and extracted metadata from their APIs. Those are individual findings. This task is about connecting them.
- A single exposed MLflow server is a finding.
- The difference between a list of findings and an attack surface map is the connections between them.
How Expands the Traditional Attack Surface
In Task 2, we catalogued 14 components across 20+ ports. Compare that to a traditional web application, which adds roughly 5 ports to a network, but the port count alone is not the full picture.
These services constantly talk to each other. The inference server pulls features from the vector database. The orchestration platform pushes model updates to the registry. Jupyter notebooks connect to everything. scrapes metrics from every service. If one component binds to 0.0.0.0 instead of 127.0.0.1, the entire internal mesh becomes reachable.
The security perimeter for an deployment is not the external . It extends deep into the internal communication pathways between these services. Overly permissive network policies and the absence of between data-hungry components are the norm, not the exception.
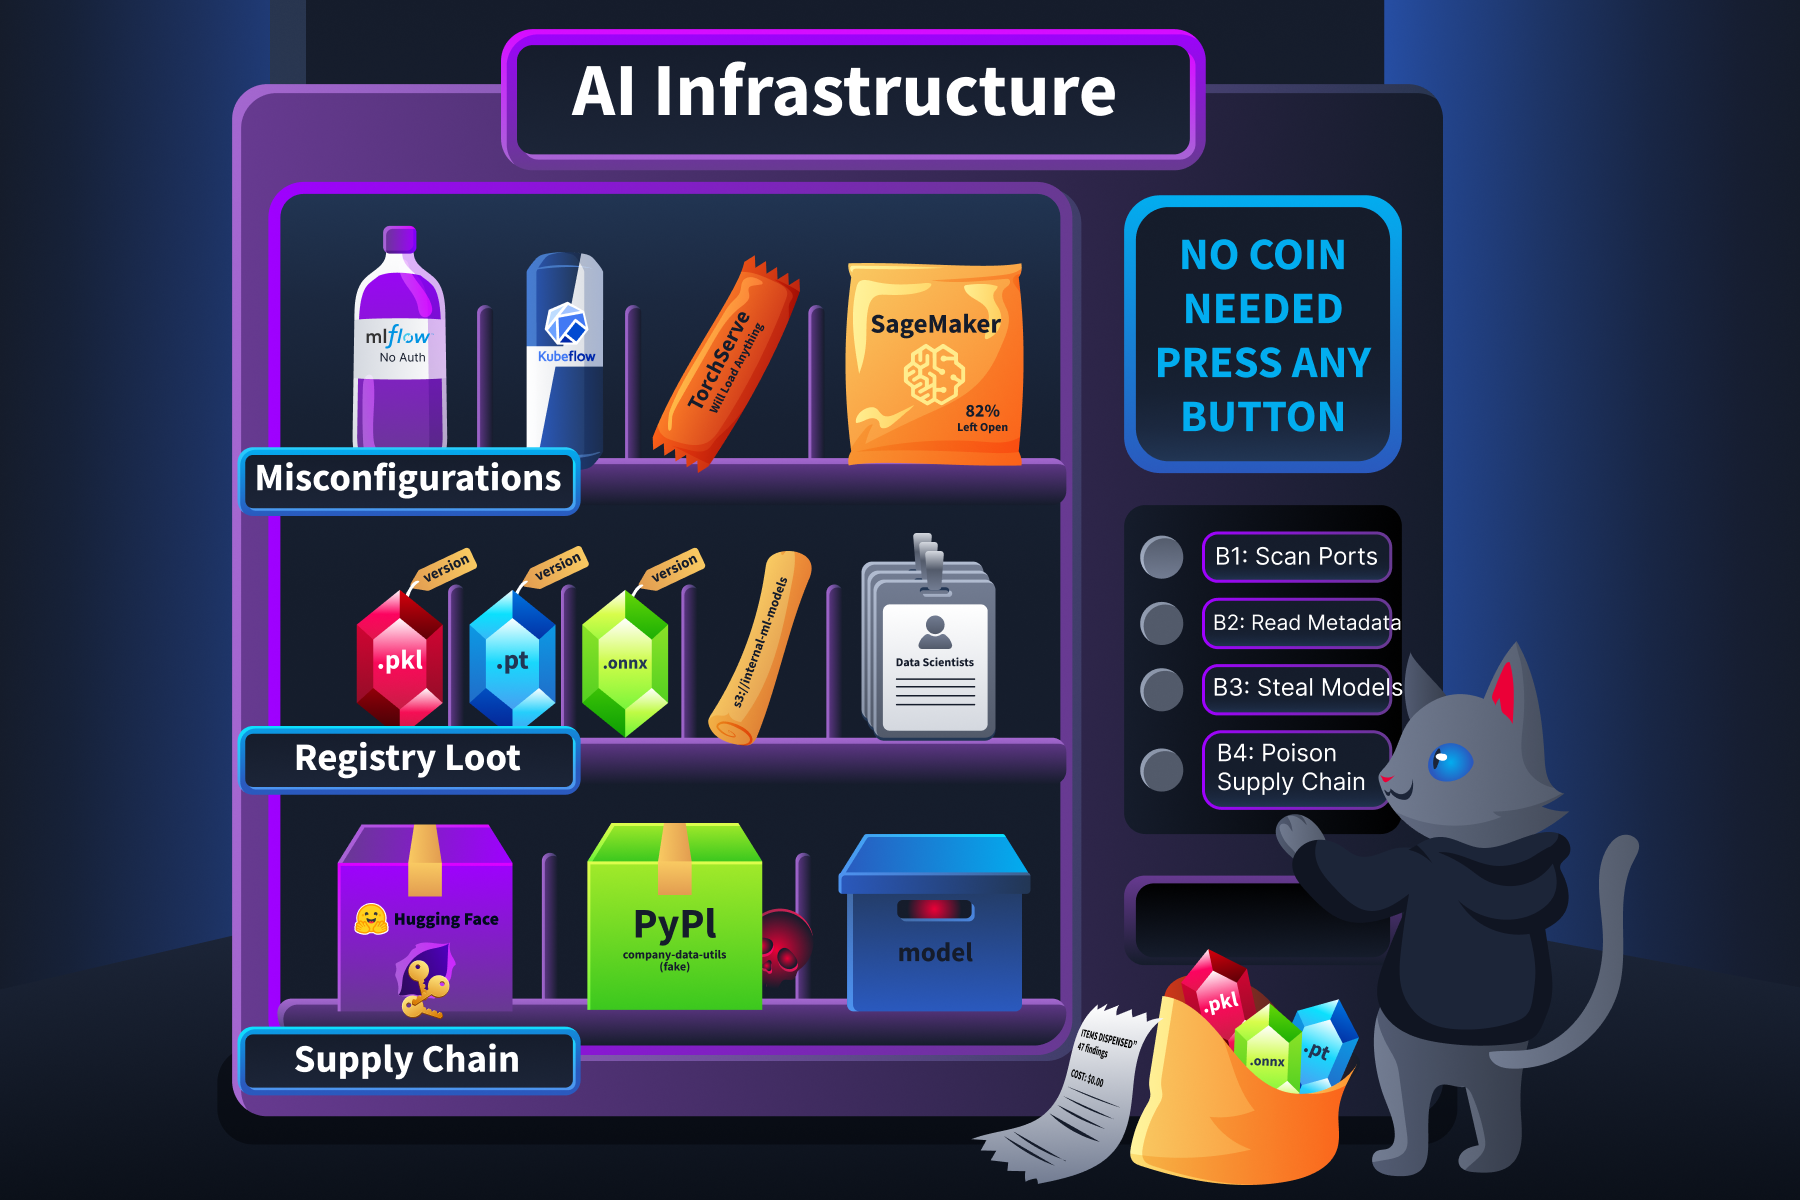
Platform Misconfigurations That Attackers Map
Every major platform has documented misconfigurations that turn routine deployments into reconnaissance targets.
MLflow shipped without authentication by default before version 2.x.
- Even after authentication was added, -2026-2635 revealed that MLflow's
basic_auth.inifile contained hardcoded default credentials. - Attackers running mass port scans on port 5000 could authenticate using these defaults.
- CVE-2026-2033 went further: a directory traversal flaw in the artifact handler allowed unauthenticated remote code execution.
- Both scored CVSS 9.8.
Kubeflow dashboards are frequently deployed without OIDC authentication and exposed via a basic Kubernetes LoadBalancer or NodePort.
- An unauthenticated user can access the full Kubeflow interface and spawn Jupyter notebooks, which are attached to Kubernetes service accounts with cluster-level permissions.
- That is a direct path from an open dashboard to container orchestration access.
TorchServe exposes a management API on port 8081 that allows dynamic model registration from arbitrary URLs.
- If that port is accessible, an attacker can instruct the server to download and load a malicious .mar (Model Archive) file from an external server.
- TorchServe executes initialisation code during model loading, so loading a crafted archive achieves remote code execution.
SageMaker notebooks with DirectInternetAccess: Enabled accept inbound connections from the internet.
- A 2024 cloud security report found that 82% of organisations using SageMaker had at least one notebook configured this way.
Model Registries: The Highest-Value Target
We covered MLflow enumeration in Task 4. Now let's talk about why an unsecured registry is the single most damaging reconnaissance finding.
A registry does not just store model files. It stores the complete lineage:
- Model names
- Version history
- Stage labels (staging, production, archived)
- Creation timestamps
- Run IDs linking back to full training metadata
- Artifact URIs revealing internal cloud storage paths
- User ID of every contributor
One open registry maps the entire ML product portfolio. IBM X-Force documented the exploitation pattern:
- An attacker finds MLflow credentials in a Jupyter notebook
- They run MLOKit against the registry
- Then exfiltrate every model artifact
The registry is the map that tells the attacker where everything else is stored.
Supply Chain Reconnaissance
AI systems depend heavily on external resources, and those dependencies are discoverable during reconnaissance.
Hugging Face tokens appear in GitHub repositories via simple dorks: filename:.env HF_TOKEN.
- They appear in
.envfiles, CI/CD pipeline logs, and Kubernetes secrets. - A compromised token grants read and write access to the organisation's private models and datasets on the Hugging Face platform.
Dependency confusion applies to ML pipelines just as it applies to traditional software.
- ML projects have large
requirements.txtfiles with internal package names. - If an internal package like
company-data-utilsis not registered on PyPI, an attacker can register it there. - Kubeflow pipelines that build containers at training time pull packages live, so a typosquatted or misconfigured package can execute code inside the training cluster.
Model download sources are identifiable during reconnaissance.
- If the organisation pulls models from the Hugging Face Hub or the PyTorch Hub, the download paths are visible in configuration files, notebook cells, and container build logs.
- An attacker who can inject a malicious model into an upstream source (or replace one via a compromised HF token) poisons the entire supply chain.
MITRE ATLAS Mapping
Everything we have covered in this room maps to the MITRE ATLAS framework. ATLAS is modelled after ATT&CK but specifically covers adversarial threats to AI and ML systems. It contains 15 tactics, 66 techniques, and 46 sub-techniques as of late 2025.
Here is how the room's content connects:
| Room Content | ATLAS Technique |
| Port scanning for AI services, probing endpoints | AML.T0006 (Active Scanning) |
| Locating model registries and training artifacts through unsecured APIs | AML.T0007 (Discover ML Artifacts) |
| Finding exposed HF tokens and poisoned dependencies | AML.T0010 (ML Supply Chain Compromise) |
| Enumerating LLM configurations and API compatibility | AML.T0014 (Discover ML Model Family) |
| All of the above, collectively | AML.TA0002 (Reconnaissance tactic) |
ATLAS techniques are not just labels. They provide a shared vocabulary for communicating findings. When you write a reconnaissance report, mapping each finding to an ATLAS technique ID tells the reader exactly what category of activity you performed and what risk it represents.
Case Study: ShadowRay Campaign (CVE-2023-48022)
The ShadowRay campaign (opens in new tab) is the clearest example of how reconnaissance of a single AI component cascades into full infrastructure compromise.
Ray's Job Submission API on port 8265 shipped without authentication by design. Anyscale, the company behind Ray, maintained that Ray should run only within trusted network boundaries and that the lack of authentication was an intentional feature, not a bug. They disputed the CVE. Attackers disagreed.
- Using Shodan, they identified over 230,000 publicly exposed Ray dashboards. Once they found an open dashboard, they submitted malicious jobs through
/api/jobs/containing multi-stage payloads. - The first stage performed reconnaissance on the compromised host: reading
/etc/passwdto enumerate users and runningprintenvto dump environment variables and harvest tokens and other cloud credentials. Using those stolen credentials, the attackers pivoted laterally across cloud infrastructure. - The primary objective was resource theft. The attackers hijacked GPU compute nodes and deployed XMRig cryptocurrency miners. They capped usage at 60% and disguised their processes as legitimate kernel workers to avoid detection.
The ShadowRay 2.0 variant, active from late 2025, added significant sophistication.
- Attackers used LLMs to generate adaptable malware payloads and established through hidden cron jobs and systemd services.
- They hosted their payloads on GitLab and, when those repositories were taken down, migrated them to GitHub within days.
- The campaign also deployed sockstress (a exhaustion tool) against production websites, turning the operation into a multi-purpose botnet.
Why this matters for this room: the entire ShadowRay chain started with reconnaissance. Finding an exposed dashboard (Task 2). Confirming it was Ray (Task 3). The was unauthenticated and ready for job submission (Task 4). One exposed component, discovered through the same techniques we have been practising, led to credential theft, lateral movement, and large-scale resource hijacking.
Agent Exercise
Now let's connect your findings to the bigger picture. Open the Cyphira Threat Mapper agent.
You have spent three tasks discovering, fingerprinting, and enumerating services on the Cyphira network. You have a list of findings: exposed services, model metadata, artifact URIs, user , cleartext credentials, and supply-chain dependencies. This exercise asks you to map those findings to techniques and connect them to real-world incidents.
Step 1: Review your findings.
- Ask the agent to summarise the Cyphira findings from Tasks 2-4.
- It will present a consolidated list of everything discovered so far.
- Make sure it matches what you found.
Step 2: Classify the findings.
- The agent will present scenarios one by one.
- Each scenario describes a specific reconnaissance activity from the Cyphira audit.
- Your job: identify which technique ID applies to each scenario.
- Use the mapping table from the task content as your reference.
Test your understanding by answering the questions below
The Cyphira Jupyter notebook at 10.10.45.20 contains a Hugging Face token (hf_kR7mXpQvL9nJwT2yBcDfAeGh8iKlMnOp). The internal-kb-embedder model on MLflow references sentence-transformers/all-MiniLM-L6-v2 as its base model. What ATLAS technique ID covers the risk of these exposed supply chain dependencies?
You scanned the Cyphira subnet with nmap, probed endpoints with curl, and extracted metadata from MLflow APIs. All of these activities fall under one overarching ATLAS tactic. What is its ID?
By now, you have scanned for components, fingerprinted the frameworks behind them, extracted metadata from their APIs, and mapped how they all connect to form an attack surface. That is a lot of techniques spread across four tasks.
This task pulls them together into a repeatable methodology you can use on any engagement. Then it flips the perspective and shows you what that methodology looks like from the other side, in someone else's logs.
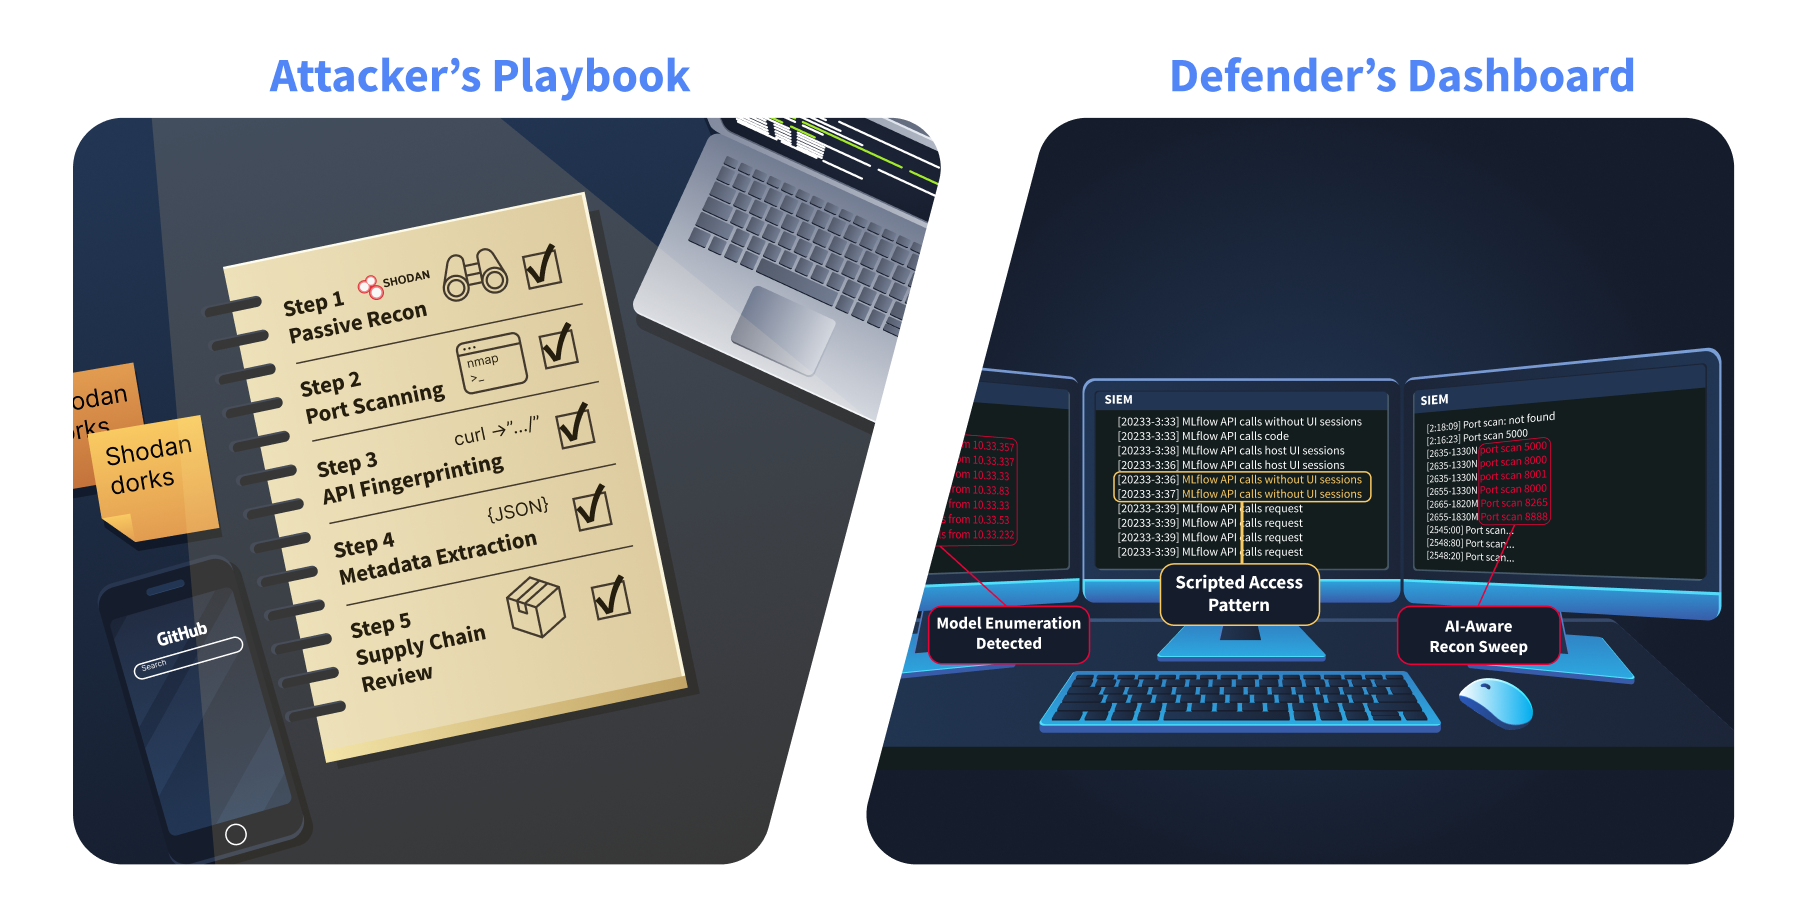
The 5-Phase Reconnaissance Methodology
Think of this as a checklist. It follows the same order we covered in the room, but structured as a process you can run start to finish.
Phase 1: Passive Reconnaissance
Before you touch the target network, see what is already publicly visible.
- Search Shodan, Censys, and FOFA for service banners on the organisation's IP ranges.
- The dorks from Task 2 work here:
port:5000 "MLflow",port:8888 title:"Home Page - Select or create a notebook",http.title:"Ray Dashboard".
- The dorks from Task 2 work here:
- Search GitHub for leaked credentials.
filename:.env MLFLOW_TRACKING_URI,filename:.env HF_TOKEN,filename:config.json model_name site:github.com.
- These turn up MLflow connection strings and Hugging Face tokens more often than you would expect.
Check arXiv and engineering blogs for published model architectures.
- Teams regularly publish papers describing the exact frameworks and infrastructure they use.
- This maps to ATLAS technique AML.T0000 (Search for Victim's Publicly Available Research Materials).
Check DockerHub and GitHub Container Registry for organisation-named ML images. Public container images frequently contain hardcoded configurations. Look at job postings. A listing for an "MLflow Administrator" or "Kubeflow Platform Engineer" tells you exactly what is deployed.
Phase 2: Active Scanning
Target the AI-specific ports from the Task 2 reference table:
nmap -p 5000,6333,8000,8001,8002,8080,8265,8500,8501,8888,9000,11434,19530 -sV --script=http-title,http-headers <target>
That single command covers most serving components.
- Pay attention to gRPC services on ports 8001 and 8500 that may report as generic.
- Follow up with grpcurl for anything that looks like gRPC.
- Check for Prometheus metrics endpoints (`/metrics`) on every discovered service.
- These are often on separate ports (8002 for Triton, 8082 for TorchServe) and leak deployment topology.
Phase 3: API Fingerprinting
Run ffuf or feroxbuster with an -specific wordlist against every discovered service. Your wordlist should include:
/v1/models/v2/models/v2/health/ready/api/2.0/mlflow/experiments/list/api/2.0/mlflow/registered-models/list/pipeline/apis/v1beta1/pipelines/api/serve/deployments//v1/schema/v1/meta/api/kernels/api/contents/openapi.json/docs/graphql/metrics/api/tags/api/show/collections/healthz/ping
For each endpoint that returns a 200, apply the fingerprinting techniques from Task 3: check response headers, parse JSON structure, and look at error messages from malformed requests.
Phase 4: Metadata Extraction
For every confirmed AI service, run the enumeration chain from Task 4.
- On MLflow: Experiments, registered models, model versions (with artifact URIs and user IDs), training runs, and artifact listings. Five API calls that map the entire ML portfolio.
- On Triton or TF Serving: Model config endpoints for tensor specs and framework identification.
- On vector databases: Schema and collection endpoints for data type and embedding model identification.
- On Jupyter: Kernel listings and notebook cell contents for cleartext credentials.
Phase 5: Supply Chain Review
Identify model download sources visible in configurations, notebook cells, and container build logs. Check whether internal model artifact buckets (S3, GCS, MinIO) are publicly readable. Audit requirements.txt and Pipfile contents for internal package names that could be squatted on PyPI. Check container registries for image pull access without credentials.
Tool Reference
Here is a quick reference for the tools that support each phase:
| Tool | What It Does | Phase |
| Shodan / Censys / FOFA | Internet-wide search for AI service banners | Phase 1 |
| GitHub search (dorks) | Find leaked credentials and configs in public repos | Phase 1 |
| Nmap (with NSE scripts) | Port discovery and service version detection | Phase 2 |
| grpcurl | Interact with gRPC services, dump protobuf schemas if reflection is enabled | Phase 2 |
| ffuf / feroxbuster | Directory brute-forcing with AI-specific wordlists | Phase 2, 3 |
| curl | Manual HTTP probing, header analysis, error triggering | Phase 3, 4 |
| MLOKit (IBM X-Force Red) | Automated MLflow enumeration and model exfiltration | Phase 4 |
| Nuclei (ProjectDiscovery) | Template-based scanning for known AI service misconfigurations | Phase 2, 3 |
| Agrus Scanner | Purpose-built shadow AI detection with 50+ AI-specific probes across all 65,535 ports | Phase 2 |
What Your Reconnaissance Looks Like From the Other Side
Everything you just learned has a signature in logs. If you understand what your activity looks like to a defender, you become better at both attack and defence.
Model enumeration pattern
- A burst of sequential GET requests to
/v2/modelsfrom a single IP. Normal users do not query model listings repeatedly in rapid succession. - In a SIEM, this appears as 10-50 requests to the same endpoint within seconds, all from a single source.
Scripted MLflow access
- API calls to
/registered-models/listand/model-versions/searchwithout a corresponding UI session. - The MLflow web interface generates specific session cookies and additional requests.
- Raw API calls without those are a clear indicator of scripted enumeration.
- This is the exact pattern MLOKit produces.
Prometheus scraping from outside the monitoring stack.
-
/metricsrequests from IPs not in the known monitoring CIDR. - Your server has a known IP.
- Anyone else reading those metrics is performing reconnaissance.
AI-aware port scanning.
- Port scans that hit 5000, 8000, 8001, 8080, 8265, 8888 in sequence from the same source.
- That is not a random scan.
- That is someone running the same Nmap command from Phase 2 of this methodology.
Path traversal against MLflow artifacts.
- Requests containing
../or%2e%2e%2fagainst MLflow artifact endpoints. - This signals someone probing for CVE-2026-2033.
Jupyter access without a session.
/api/kernelsand/api/contentsrequests without a valid session cookie.- Either an attacker found the notebook server, or an automated tool is enumerating it.
Quick Wins for Reducing Your Reconnaissance Surface
These are not full hardening guides. The AI Threat Modelling Assessment room covers mitigation in depth. These are the changes you can make today that have the greatest impact on reducing what an attacker can discover.
- Enable MLflow authentication. Set
MLFLOW_TRACKING_USERNAMEandMLFLOW_TRACKING_PASSWORD, or deploy behind an authenticating reverse proxy - Disable Jupyter's
--allow-rootand--ip=0.0.0.0flags in production. Require token authentication. Never bind to 0.0.0.0 without a VPN or ingress-level auth - Block AI-specific ports at the network perimeter. Ports 5000, 8000 through 8002, 8080, 8265, 8500/8501, 8888, and 9000 should never be internet-facing without explicit intent
- Disable Triton's model control endpoint with
--model-control-mode nonein production to prevent unauthenticated model loading and unloading - Restrict Prometheus metrics endpoints to your internal monitoring CIDR. The
/metricsendpoints on Triton (port 8002) and TorchServe (port 8082) expose model names, GPU utilisation, batch sizes, and deployment topology. They should only be reachable from your monitoring stack, not from the general network. - Rotate and scope Hugging Face tokens. Use fine-grained tokens with read-only permissions and minimal scope
- Strip debug headers and verbose error messages from service responses before they reach untrusted networks
- Audit MinIO and bucket policies hosting model artifacts. Model weights should not be in publicly readable buckets
Case Study: Hugging Face Spaces Breach (June 2024)
In June 2024, attackers gained unauthorised access to the Hugging Face Spaces (opens in new tab) platform and accessed authentication secrets stored by developers in their hosted applications. These secrets included HF tokens that could access private models, datasets, and configurations.
- The breach demonstrated exactly what Phase 1 and Phase 5 of the methodology target.
- HF tokens stored in application secrets are the same kind of credential that shows up during passive reconnaissance through GitHub dorks, .env files in public repos, and / pipeline logs.
- Once an attacker has a valid HF token, they have read and write access to whatever that token is scoped to.
Hugging Face's response mapped directly to the "Quick Wins" list above. They revoked compromised tokens, recommended that all users migrate to with minimal scope, and advised against storing tokens in application secrets where platform compromises could expose them.The lesson is straightforward.
The credentials that Phase 1 passive reconnaissance discovers (GitHub dorks, exposed .env files) are the same credentials that get compromised in platform breaches. Rotating and scoping tokens is not just a best practice. It is the direct countermeasure to both reconnaissance and breach exposure.
Agent Exercise
Time to flip perspectives. Open the Cyphira Analyst agent below.
Everything you did in Tasks 2 through 5, scanning ports, probing endpoints, querying APIs, extracting metadata, left traces in logs. This exercise puts you behind the dashboard. You are now the defender looking at what your own reconnaissance activity looks like from the other side.
Step 1: Request the logs.
- Ask the agent to show you the recent alerts from the Cyphira .
- It will present a set of log entries showing network activity against the infrastructure.
Step 2: Classify each log entry.
For each log entry, identify:
- What reconnaissance phase it belongs to (Passive, Active Scanning, Fingerprinting, Metadata Extraction, or Supply Chain Review)
- What specific activity it represents (model enumeration, scripted access, port scanning, etc.)
Step 3: Recommend defences.
- For each log pattern you classify, recommend which quick win from the task content would detect or prevent that activity.
- The agent will validate your recommendations.
Step 4: Spot the attacker versus normal traffic.
- The agent will present some log entries that look like normal operational traffic mixed in with reconnaissance patterns.
- You need to distinguish between legitimate activity and suspicious scanning.
- Not everything in the logs is an attack.
Test your understanding by answering the questions below
A SIEM log shows requests to /api/2.0/mlflow/registered-models/list from an IP with no corresponding MLflow UI session. What tool's access pattern does this match?
What is the single most effective quick win for preventing unauthenticated access to the MLflow tracking server?
You made it through the Cyphira Audit. Let's recap what we covered, map it to industry frameworks, and set you up for what comes next.
Mapping to Industry Frameworks
The techniques and findings from this room align with several widely adopted security frameworks. This mapping helps you communicate your reconnaissance results in language that security leaders, auditors, and compliance teams already understand.
(Adversarial Threat Landscape for Systems)
is the primary framework for -specific threats. Here is how this room maps:
| Room Content | Technique ID | Technique Name |
|---|---|---|
| Shodan and GitHub dorks for infrastructure | AML.T0000 | Active Scanning |
| Locating model registries and artifacts through unsecured APIs | AML.T0048 | Discover Artifacts |
| Finding exposed HF tokens and | AML.T0040 | Supply Chain Compromise |
| Enumerating configs and schema compatibility | AML.T0069 | Discover System Information |
| All reconnaissance activities collectively | AML.TA0002 | Reconnaissance (Tactic) |
ATT&CK (Enterprise)
Traditional ATT&CK techniques also apply because reconnaissance uses many of the same methods as conventional network assessment:
| Room Content | ATT&CK Technique ID | Technique Name |
|---|---|---|
| Port scanning for -specific services | T1046 | Network Service Scanning |
| Extracting deployment topology from metrics and metadata | T1592 | Gather Victim Host Information |
| Probing for unauthenticated management interfaces | T1595.002 | Vulnerability Scanning |
| Collecting infrastructure intelligence before engagement | TA0043 | Reconnaissance (Tactic) |
Top 10 for Applications (2025)
Several risks directly relate to findings from this room:
| Room Finding | ID | Risk Name |
|---|---|---|
| Exposed MLflow servers, Jupyter notebooks, unauthenticated APIs | LLM05 | Improper Output Handling (relates to exposed metadata and information leakage through responses) |
| Model artifacts downloadable from unsecured registries | LLM06 | Excessive Agency (relates to model access without proper authorisation controls) |
| Leaked HF tokens, , poisoned model files from public hubs | LLM03 | Training / Supply Chain Vulnerabilities |
| Default credentials, missing authentication on MLflow and Kubeflow | LLM10 | Model Theft (reconnaissance enables direct model exfiltration) |
Risk Management Framework ( RMF 1.0)
RMF organises risk into four functions: Govern, Map, Measure, and Manage. This room's content falls primarily under the Map function:
- Map 1.1: system components and their interactions are identified. This is exactly what Tasks 2 through 4 accomplish. You cannot assess risk in infrastructure you have not discovered.
- Map 1.5: Potential risks of the system are assessed. The attack surface mapping in Task 5 directly supports this. Identifying misconfigurations, exposed registries, and supply chain risks is risk assessment at the infrastructure layer.
- Map 3.2: Risks related to third-party resources are identified. The supply chain reconnaissance in Task 5 (Hugging Face tokens, PyTorch Hub dependencies, public model registries) maps here.
- Measure 2.6: Processes exist to determine whether systems are functioning as intended. The metrics and debug interface enumeration from Task 4 support this, as unexpected exposed endpoints indicate systems not functioning as intended from a security perspective.
Cybersecurity Framework ( 2.0)
The room's content aligns with 2.0's Identify function:
- ID.AM (Asset Management): Discovering and inventorying infrastructure components across the network. This is the core purpose of the entire room.
- ID.RA (Risk Assessment): Mapping the attack surface and identifying misconfigurations that introduce risk.
What Comes Next
You now know how to find and enumerate components. The next room, Threat Modelling Assessment, picks up where this room ends.
In the Threat Modelling Assessment room, you take the reconnaissance output you built here and assess the security posture of what you found. Which findings represent actual vulnerabilities? What is the impact if each one is exploited? What mitigations should the organisation prioritise?
Every deployment you cannot find is one you cannot protect. The gap between what organisations think they have deployed and what is actually exposed on their network is where attackers operate. You now have the skills to close that gap.
All done!
Ready to learn Cyber Security?
TryHackMe provides free online cyber security training to secure jobs & upskill through a fun, interactive learning environment.
Already have an account? Log in