
IR Timeline Analysis
Learn about timeline analysis using various tools and scenarios.
medium

To access material, start machines and answer questions login.
In digital investigations, the more forensic data you have, the more complex things will be to process and analyze. It is, therefore, important to establish a sequence of events by extracting vital information and identifying a chronology of events that would have resulted in a breach or security incident. As forensic analysts, we delve deep into the intricate layers of digital artifacts to reconstruct the sequence of events, uncovering crucial details that shed light on the who, what, when, and how of a cyber incident. In this room, we embark on a journey to master the art of timeline analysis, learning how to wield tools like Log2Timeline with finesse to extract actionable intelligence from the vast sea of data contained within disk images.
Room Prerequisites
Before diving into the subject of this room, baseline knowledge in digital forensics and analysis would be important to start with. These areas are covered in the following prerequisites:
Room Objectives
- Define and understand the role of timeline analysis within forensics and .
- Analyze forensic timelines using Log2timeline and Timesketch.
- Offer a complete picture of a breach using zoom-in and zoom-out approaches.
In this task, we delve into the essential concept of timeline analysis, a critical component in digital forensics and incident response, particularly during the examination and analysis phases. Timeline analysis is a systematic method for reviewing events sequentially, providing a comprehensive understanding of the actions that culminated in a security incident.
Significance of Timeline Analysis
Timeline analysis is invaluable to the process, facilitating the reconstruction of events and identifying the adversary's actions. This capability is not merely about understanding what happened; it is a critical step towards identifying the incident's root cause. By identifying parent-child relationships of different events, responders are better equipped to reconstruct the sequence leading up to an incident, mitigate risk, and prevent similar occurrences.
Another benefit of timeline analysis is its role in scope assessment. By completely understanding the sequence of events, incident responders can gauge the extent of the impact, pinpoint the affected systems, and determine the resources required for resolution.
For the entire process, the insights gathered can influence decision-making regarding containment, eradication, and recovery efforts. The ultimate goal will be to enhance the organization's overall security posture.
Timeline Analysis Terminology
Understanding the associated terminology and concepts is vital to mastering timeline analysis. Fundamental concepts include timestamps, structures, and event sequencing.
- Timestamps: These are indicators of when an event took place. It is a crucial data point in timeline analysis, enabling the incident responder to position events chronologically.
 structures: Offering insights into the
organization of the . This information can provide
indications about the nature and origin of the incident.
structures: Offering insights into the
organization of the . This information can provide
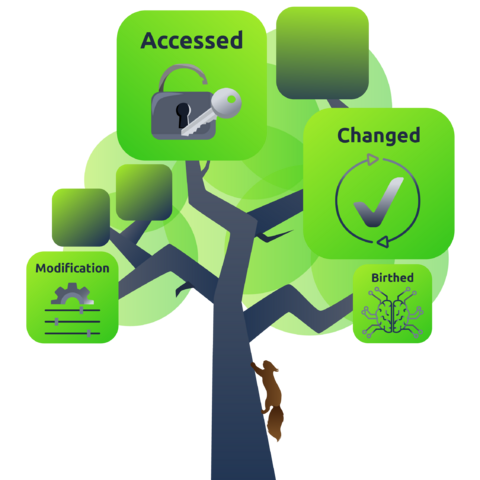
indications about the nature and origin of the incident.- MACB: This acronym represents different timestamps associated with files in a and can provide insights into the sequence of events leading up to an incident. The acronym stands for Modified, Accessed, Changed, and Birth. These tags indicate key events related to a file.
- Event sequencing: This refers to arranging events in chronological order based on their timestamps. It forms the backbone of timeline analysis.
- Time synchronization: Systems use a variety of time formats and can be configured to follow different timezones. For clarity and consistency, during incident analysis, all timestamps are generally converted to Coordinated Universal Time () before developing a timeline to ensure minimal errors and confusion.
- Time carving: Incident responders may encounter unallocated space and fragmented data on a storage media when extracting artifacts. Time carving comes into play by extracting and reconstructing timelines from data fragments to become coherent and useful.
- Temporal correlation: As incident artifacts are collected from various sources, incident responders must align the events based on their timestamps to create a holistic view of the incident. This allows for combining data from various sources, such as network logs, system logs, application logs, and registry hives, to identify coordinated actions by attackers and better understand the incident.

Types of Timelines
- Quick timeline: A quick timeline is a basic timeline that provides a swift overview of events and is useful for initial assessments.
- Super timeline: The super timeline offers a more detailed view, including additional information such as event sources and types, often enriched with data from registry hives and other deep system data sources.
- Mini timeline: A mini timeline may be similar to a quick timeline, but this is a zoomed-in timeline focused on a specific time period of interest.
When a file is created, what timestamp tag would it have?
Converting event timestamps into UTC can be described as?
In the realm of digital forensics and security incident management, the process of collecting artifacts plays an incredibly crucial role. Artifacts are nuggets of information or data scattered across various locations. The task is not just about obtaining these artifacts, but also ensuring their safety and subsequent analysis, all of which form the crux of any digital forensic investigation or security incident resolution. These pieces of information can be instrumental in helping you decipher the exact sequence of events and understand what transpired.
The Treasure Hunt for Clues
The first step in this complex process is to know where to look for these data points that will eventually help you stitch together the timeline of events. There are several locations where you might stumble upon insightful information:
- Logs: These are essentially the chronicles of your operating system or any other software. They diligently record user activities, system changes, and unusual security occurrences. They are a goldmine of clues that can help trace the events.
- metadata: This constitutes details about files such as their creation, modification, or access timestamps, often termed MACB. These details can provide significant insights into user behavior and potential patterns that might have been overlooked.
- Network traffic: This includes all the data that traverses your network. It can reveal the interconnectedness of systems, data transfers, and any covert intrusions. Analyzing network traffic can help trace an attack or identify abnormal data movement.
- Mount points: These are specific locations in the where additional data can be accessed. They could be external hard drives or network shares and serve as potential excavation sites for artifacts and evidence.
- Temp locations: Temporary directories often house artifacts related to recent user activity, such as file downloads, document modifications, and browsing history. A look into these locations can provide a snapshot of a user’s recent activity.
- Deleted data from the bin: Occasionally, even discarded files can be retrieved and analyzed for additional insights, provided they haven’t been overwritten. These files can contain valuable information about user activities and potential security incidents.
Ensuring the and Safety of Your Data
When procuring and storing data for timeline analysis, it is imperative to maintain its . Here are a few ways to ensure your data remains untarnished:
- Make a forensic image: It is always advisable to work on a replica of the system or storage media, not the original, to prevent any unintended tampering with the original data.
- Maintain a for your evidence: All evidence should have a well-documented . This includes recording details about how the evidence was handled, such as who collected it, when, and the measures taken to ensure its safety and movement. This ensures the evidence remains admissible in court, if necessary.
- Verify your data: Using cryptographic hashes can ensure your data has not been manipulated post-collection, thereby preserving its authenticity.
Essential Tools for the Job
In digital forensics and incident response, several sophisticated tools can assist in collecting artifacts. Two popular ones are Plaso (opens in new tab) and Autopsy (opens in new tab).
- Plaso: A high-performance tool that can automate the creation of a timeline from digital evidence. It can trawl through many logs and metadata and compile a comprehensive “super timeline” that provides a panoramic view of the events. A unique feature is “coloring”, which allows the color-coding of events in the timeline for more accessible analysis.
- Autopsy: A versatile digital forensics tool that offers a myriad of features, including timeline analysis, keyword searching, web artifact analysis, and data carving. It is akin to a multi-utility knife for investigators.
Comparing the Tools
While both Plaso and Autopsy can perform timeline analysis, they each have distinctive features and produce slightly different results. Plaso excels at creating detailed super timelines and offers the option to color-code events, which can simplify the analysis process. On the other hand, Autopsy is a holistic digital forensics platform, with timeline analysis being just one of its many capabilities.
Collecting artifacts is paramount in timeline analysis for digital forensics and incident response. You can craft detailed and accurate timelines by knowing where to source data, adhering to the best practices for its collection and preservation, and leveraging the appropriate tools. These timelines can help reconstruct the chain of events leading up to a security incident, facilitating a more effective response and preventing similar incidents.
What specific data source provides detailed information regarding user interactions within a digital environment?
Set up your virtual environment

In digital forensics, Log2Timeline stands as a fundamental open-source tool that is indispensable for investigations. This task aims to furnish a comprehensive understanding of Log2Timeline's commands and offer insights into creating and analyzing timelines in forensic investigations.
Scenario
The forensic disk image used in this room was procured from the Computer Forensic Reference Data Sets (CFReDS) portal hosted by the National Institute of Standards and Technology (). For more information and access to the dataset, visit CFReDS (opens in new tab).
Connecting to the System
Click the Start Lab Machine button attached to this task to start the . Once the machine starts, you can access it via the AttackBox or your own connected machine using with the credentials provided below:
| Username | analyst |
| Password | analyst1234 |
Note: All the necessary tools for this room have already been installed on the machine.
Creating a Super Timeline With Log2Timeline
A pre-generated timeline storage file has been prepared using a sample disk image saved on the machine from our source. However, understanding the process remains crucial for your investigative journey.
Log2Timeline
To create a timeline storage file with the extension .plaso, we need to run the following command. Please note that the walkthrough here provides a guide on creating the files; however, this is skipped on the attached machine as it could take hours to complete the process, depending on the size of the disk image.
In our case, we will be using the image on the path /home/analyst/Desktop/Timelines/Task4/2020JimmyWilson.E01. Run log2timeline.py and indicate our output file using the option --storage-file and the image file to use. The first thing log2timeline.py will do is scan the storage file for partitions. If there is more than one partition, or the partition contains Volume Shadow Copies (VSS), you will be prompted to make a specification.
From this point, the pre-processing stage will begin, and information from the storage file will be collected. This stage also determines whether the parser is enabled to generate a Plaso storage file. This will be followed by the storage process, involving several workers and collectors based on the number of CPUs running on the system. All this has been summarized in the terminal output below.
Note: You do not have to run the command because the Jimmy_timeline.plaso file has already been generated for you.
           analyst@MACHINE_IP:~$ /Desktop/Timelines/Task4$ log2timeline.py --storage-file Jimmy_timeline.plaso 2020JimmyWilson.E01
Checking availability and versions of dependencies.
[OK]

The following partitions were found:

Identifier      Offset (in bytes)       Size (in bytes)

p1              17408 (0x00004400)      32.0MiB / 33.6MB (33554432 B)
p2              33619968 (0x02010000)   816.0MiB / 855.6MB (855638016 B)

Please specify the identifier of the partition that should be processed. All partitions can be defined as: "all". Note that you can abort with Ctrl^C.

Partition identifier(s): all


Source path             : /home/analyst/Desktop/Timelines/Task4/2020JimmyWilson.E01
Source type             : storage media image
Processing time         : 00:01:18

Tasks:          Queued  Processing      Merging         Abandoned       Total
                243     2               1               0               845
Identifier      PID     Status          Memory          Sources         Events          File
Main            91704   merging         221.5 MiB       845 (0)         39501 (2642)
03521f49a3e442499dad46d2818880c2
Worker_00       91711   extracting      205.6 MiB       572 (0)         90675 (777)     NTFS:\Windows\System32\config\SOFTWARE
Worker_01       91713   extracting      196.6 MiB       272 (0)         81084 (913)     NTFS:\Windows\System32\config\SYSTEM
The disk file has two partitions available, and we were prompted to specify which one to select; in this case, we went with all to parse all the partitions. As we can see from the status window, we have information about the following elements:
- How many workers were started
- The process identifier of the worker processes
- The total events extracted
- The last file entry is from which each worker extracted events
We mentioned parsers that can provide a more granular timeline from the disk. This would narrow the analysis into creating a targeted timeline. We do not need to provide individual files for the parsers to work, but just pointing Log2Timeline to the disk image will use the parser preset and obtain the data we need. A list of parsers supported by Log2Timeline is shown below:
           analyst@MACHINE_IP:~$ /Desktop/Timelines/Task4$ log2timeline.py --parsers list | more

********************************* Parsers ************************************
               Name : Description
------------------------------------------------------------------------------
  android_app_usage : Parser for Android usage history (usage-history.xml
                      files.
      apache_access : Parser for Apache access log (access.log) files.
        apt_history : Parser for Advanced Packaging Tool (APT) History log
                      files.
            asl_log : Parser for Apple System Log (ASL) files.
     aws_elb_access : Parser for AWS ELB Access log files.
       bash_history : Parser for Bash history files.
            bencode : Parser for Bencoded files.
     binary_cookies : Parser for Safari Binary Cookie files.
           bodyfile : Parser for SleuthKit version 3 bodyfile.
            bsm_log : Parser for Basic Security Module (BSM) event auditing
                      files.
--More--
To illustrate the work of parsers, let's employ the winevt parser and filter events about Windows Event Logs using the --artifact-filters WindowsEventLogSystem flag.
           analyst@MACHINE_IP:~$ /Desktop/Timelines/Task4$ log2timeline.py --parsers winevt --artifact-filters WindowsEventLogSystem --storage-file Jimmy_WinEvent_timeline.plaso 2020JimmyWilson.E01

2024-03-12 12:54:04,311 [INFO] (MainProcess) PID:1728  Determined data location: /usr/share/plaso

2024-03-12 12:54:04,327 [INFO] (MainProcess) PID:1728   Determined artifact definitions path: /usr/share/artifacts

Checking availability and versions of dependencies.
[OK]

The following partitions were found:

Identifier      Offset (in bytes)       Size (in bytes)
p1              17408 (0x00004400)      32.0MiB / 33.6MB (33554432 B)
p2              33619968 (0x02010000)   816.0MiB / 855.6MB (855638016 B)

Please specify the identifier of the partition that should be processed. All partitions can be defined as: "all". Note that you can abort with Ctrl^C.

Partition identifier(s): all

Source path             : /home/analyst/Desktop/Timelines/Task4/2020JimmyWilson.E01
Source type             : storage media image
Artifact filters        : WindowsEventLogSystem
Processing time         : 00:00:00
Processing started
Tasks:          Queued  Processing      Merging         Abandoned       Total
                0       0               0               0               0

Identifier      PID     Status          Memory          Sources         Events
File

Main            1728    completed       157.3 MiB       0 (0)           0 (0)
Worker_00       1733    idle            119.9 MiB       0 (0)           0 (0)
Worker_01       1737    idle            120.3 MiB       0 (0)           0 (0)

Processing completed.
pinfo
We can retrieve information about our timeline storage file using the
pinfo.py command. The information contained includes
metadata from each storage container processed, parsers used during the
creation of the timeline, and the number of extracted events.
           analyst@MACHINE_IP:~$ /Desktop/Timelines/Task4$ pinfo.py Jimmy_timeline.plaso | more

************************ Plaso Storage Information ***************************
            Filename : Jimmy_timeline.plaso
      Format version : 20220716
Serialization format : json

********************************* Sessions ***********************************
1b610eef-70af-4893-bc66-ebd0b81124f0 : 2024-02-21T06:27:49.398019+00:00

****************************** Event sources *********************************
Total : 36

*********************** Events generated per parser **************************
          Parser (plugin) name : Number of events
------------------------------------------------------------------------------
	            appcompatcache : 980
                        bagmru : 34
         explorer_mountpoints2 : 35
        explorer_programscache : 10
                      filestat : 19843
--More--
To obtain a more verbose result containing information collected during processing, we will run the tool with a -v flag: pinfo.py -v Jimmy_timeline.plaso
psort
Psort.py is an accompanying command tool used to post-process Plaso storage files by filtering, sorting, and analyzing the file, aiding in searching for events that occurred during a particular timeframe. Additionally, the tool can convert the file into other file formats, such as CSV, for analysis using other tools.
The basic format for running psort.py is as shown below, together with the output formats supported:
           analyst@MACHINE_IP:~$ /Desktop/Timelines/Task4$ psort.py [-a] [-o FORMAT] [-w OUTPUTFILE] [--output-time-zone TIME_ZONE] STORAGE_FILE FILTER

analyst@MACHINE_IP:~/Desktop/Timelines/Task4$ psort.py -o list

******************************** Output Modules ********************************
      dynamic : Dynamic selection of fields for a separated value output
                format.
         json : Saves the events into a JSON format.
    json_line : Saves the events into a JSON line format.
          kml : Saves events with geography data into a KML format.
       l2tcsv : CSV format used by legacy log2timeline, with 17 fixed fields.
       l2ttln : Extended TLN 7 field | delimited output.
         null : Output module that does not output anything.
   opensearch : Saves the events into an OpenSearch database.
opensearch_ts : Saves the events into an OpenSearch database for use with
                Timesketch.
        rawpy : native (or "raw") Python output.
          tln : TLN 5 field | delimited output.
         xlsx : Excel Spreadsheet (XLSX) output
--------------------------------------------------------------------------------
Now, if we want to obtain the complete timeline of Jimmy Wilson's disk image in CSV, we can run the command against it and analyze the output file to find information on specific events, as shown below:
analyst@MACHINE_IP:~/Desktop/Timelines/Task4$ psort.py -o dynamic -w Jimmy_timeline.csv Jimmy_timeline.plaso
Once the file has been created, we can look at the chronological order of events from our timeline.
Plaso tools also offer the ability to perform automatic analysis using plugins that extract and inspect timeline events, create tags for them, and generate meaningful reports. Based on the installation, the list of supported plugins can be viewed using the command psort.py --analysis list. Some plugins may require additional parameters such as files, keys, or protocols to perform the analysis.
In our analysis of Jimmy's timeline, we wish to tag the events found. We can check which parameters would be needed, such as a file containing event tags, by running psort.py --analysis tagging -h to obtain a list of necessary parameters. Do scroll through the information to identify the arguments section.
           analyst@MACHINE_IP:~$ /Desktop/Timelines/Task4$ psort.py --analysis tagging -h

...
Analysis Arguments:
  --analysis PLUGIN_LIST
                        A comma separated list of analysis plugin names to be loaded or "--analysis list" to see a list of available
                        plugins.
  --tagging-file TAGGING_FILE, --tagging_file TAGGING_FILE
                        Specify a file to read tagging criteria from.
...
To run an analysis against our plaso file, we will use psort.py -o null --analysis tagging --tagging-file tag_windows.txt Jimmy_timeline.plaso. This will run the tagging analysis plugin using the "tag_windows.txt" file as the source of all tags, without printing any events. The tagging file is found within Plaso's data directory, which was downloaded during installation. Ultimately, the tool will summarize the analysis, which will be helpful during an investigation.
           analyst@MACHINE_IP:~$ /Desktop/Timelines/Task4$ psort.py -o null --analysis tagging --tagging-file tag_windows.txt Jimmy_timeline.plaso
...

***************Analysis report: tagging***********
Date and time : 2024-04-02T11:58:25.000000+00:00
Event filter  : N/A
Results       : application_install: 62
              : event_tags: 3370
              : time_change: 29
Task Exercise
Based on the investigation case conducted in the Digital Forensics Case B4DM755 room, a disk image file was captured as part of the tasks. This image file under the name Forensic_Image_b4dm755.E01 has been presented to you in the /home/analyst/Desktop/Timelines/Task4/ directory to extract information using the different Plaso tools. You are tasked to utilize what you have learned during this task to complete the set of questions presented to you.
Based on the Jimmy_timeline.plaso file, how many event sources are parsed after running pinfo.py against the storage file?
On the same timeline file, how many events were generated for the firefox_history?
Based on the B4DM755 timeline, what time was the interview.txt file created? (hh:mm:ss)
Timesketch is an open-source tool used in the forensics world to analyze and investigate events. It allows investigators to visualize and examine event data from various sources to identify patterns, insights, and intelligence related to a security event captured on a timeline.
The key features of Timesketch include:
- Visualization: An interactive interface displays events chronologically, making it easier to follow the sequence of events within a timeline.
- Search and filter: You can search and filter events based on specific keywords, timestamps, and attributes.
- Collaboration: When working within a team, Timesketch supports collaboration, allowing members to share timelines and contribute towards analysis efforts seamlessly. Investigators can also create and share narrative-driven analysis pieces known as stories that document findings and insights from timelines.
- External data source integration: You can integrate external threat intelligence feeds and Sigma rules to enrich timeline data with more context about known threats, IOCs, and suspicious activities.
We have Timesketch on the for this task, accessible via ://MACHINE_IP:8080 (opens in new tab). Use the same credentials as previously provided in Task 4: analyst:analyst1234. The Jimmy_timeline.plaso file from Task 4 has been uploaded and indexed under the Jimmy Supertimeline sketch for analysis.
Analyzing the Timeline Using Timesketch
Once we log into Timesketch, we are presented with the homepage, where all the investigation cases, known as sketches, reside. We will be looking at the Jimmy Supertimeline sketch throughout this task.
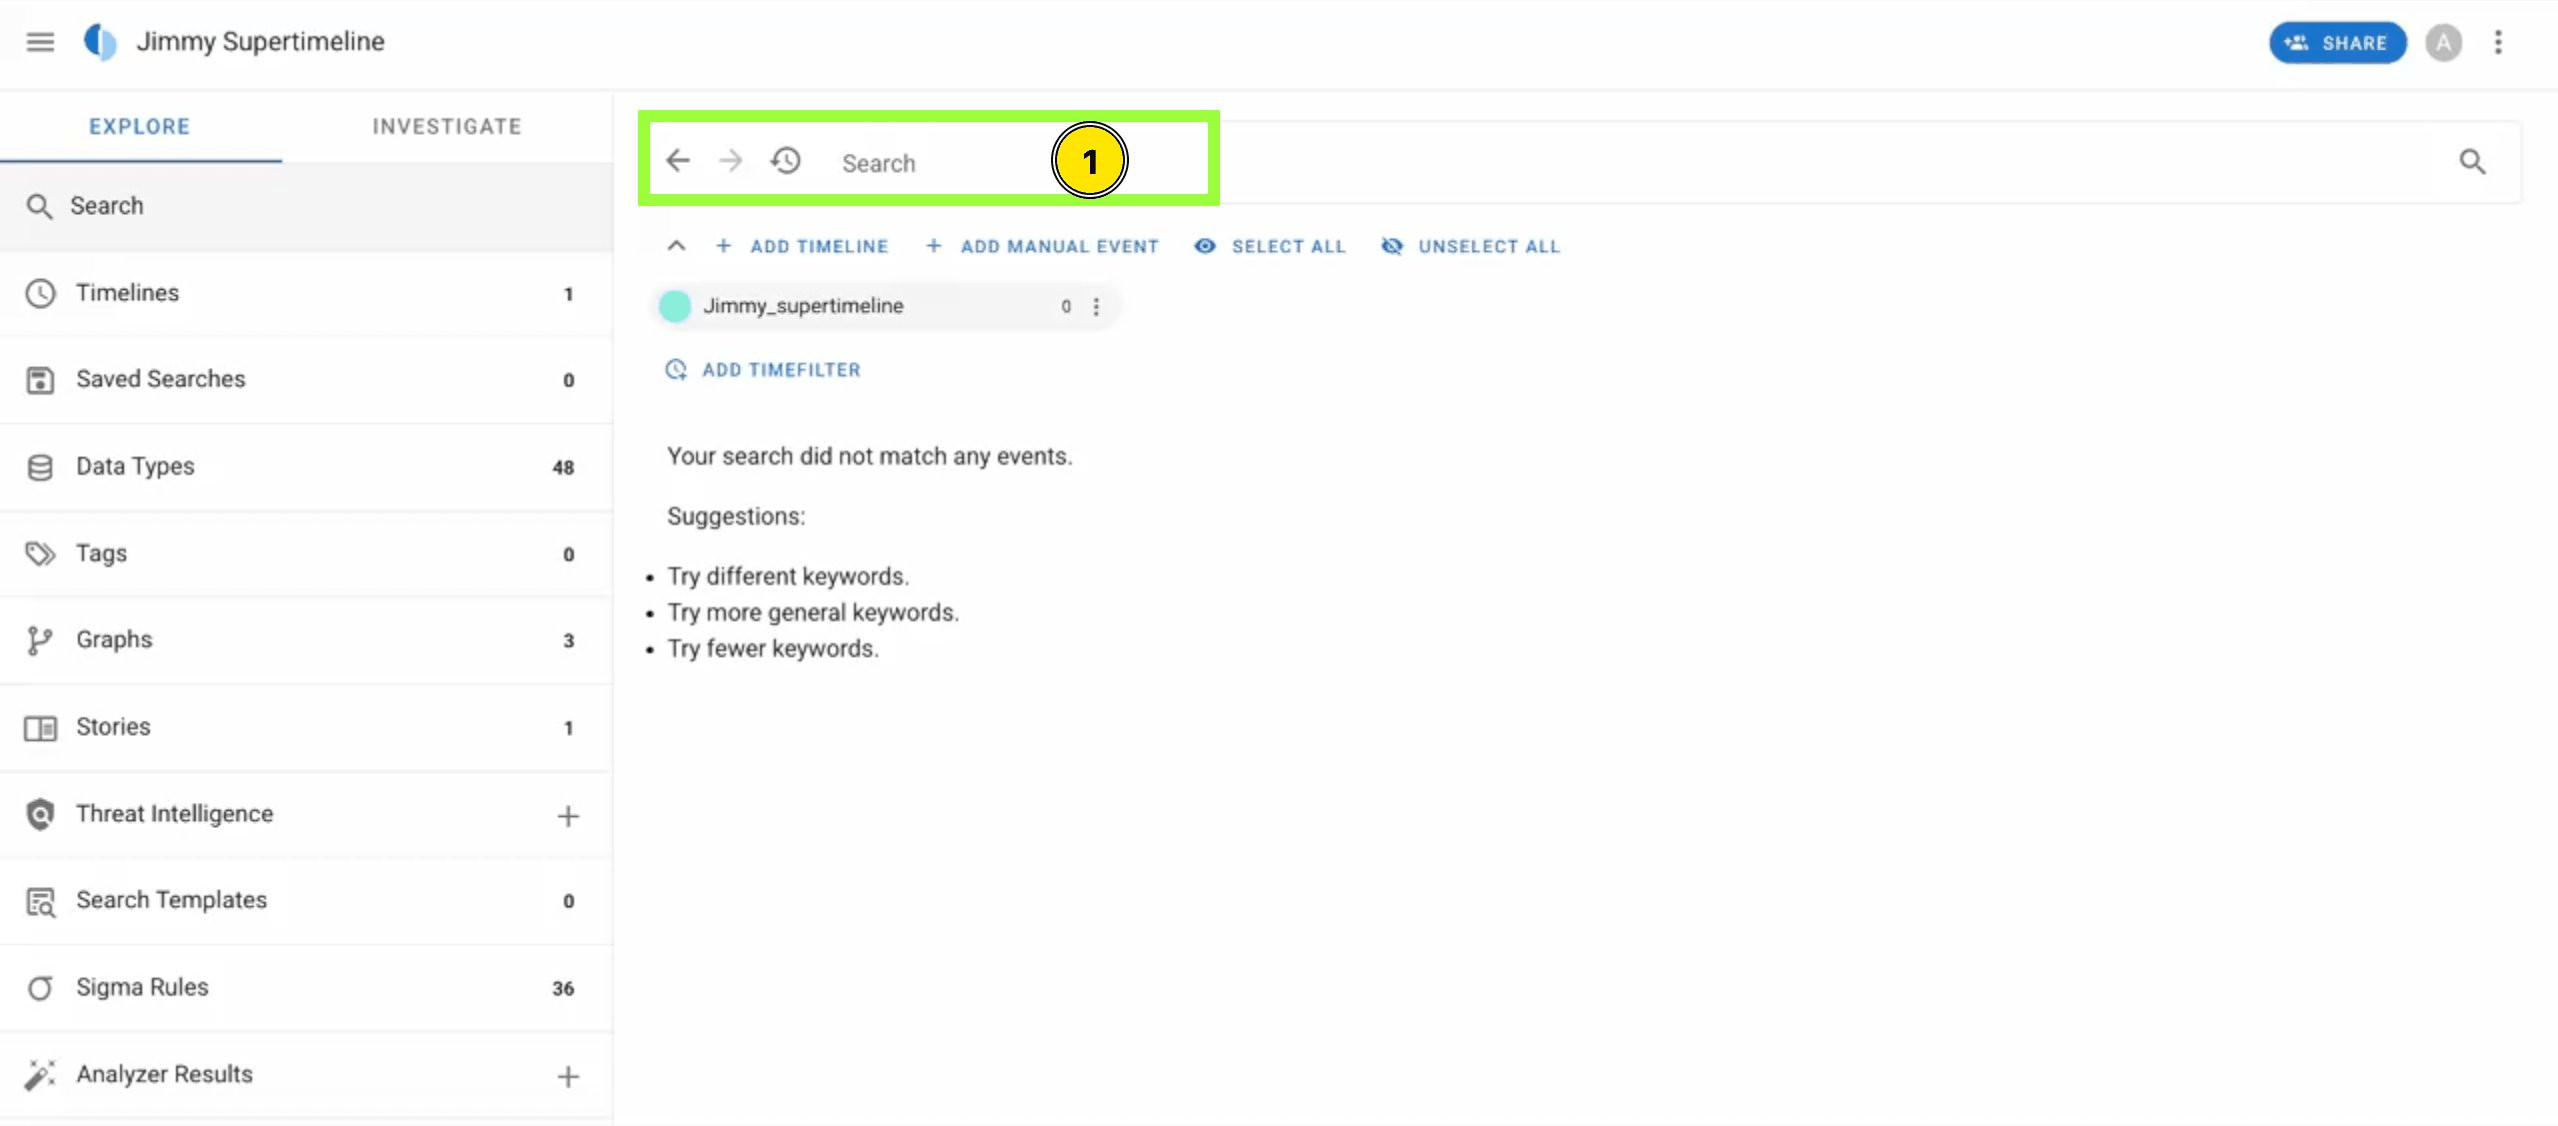
Opening the sketch leads us to the Explore tab, where we are presented with details about our timeline.
Zoom In and Out Through Search
When working with a super timeline, narrowing your investigation using search queries will be necessary. The search will be based on the data fields found within the timeline. The standard fields found include message, timestamp, datetime, and timestamp_desc. Timesketch provides a list of pre-set search templates that we can start with to identify specific information.
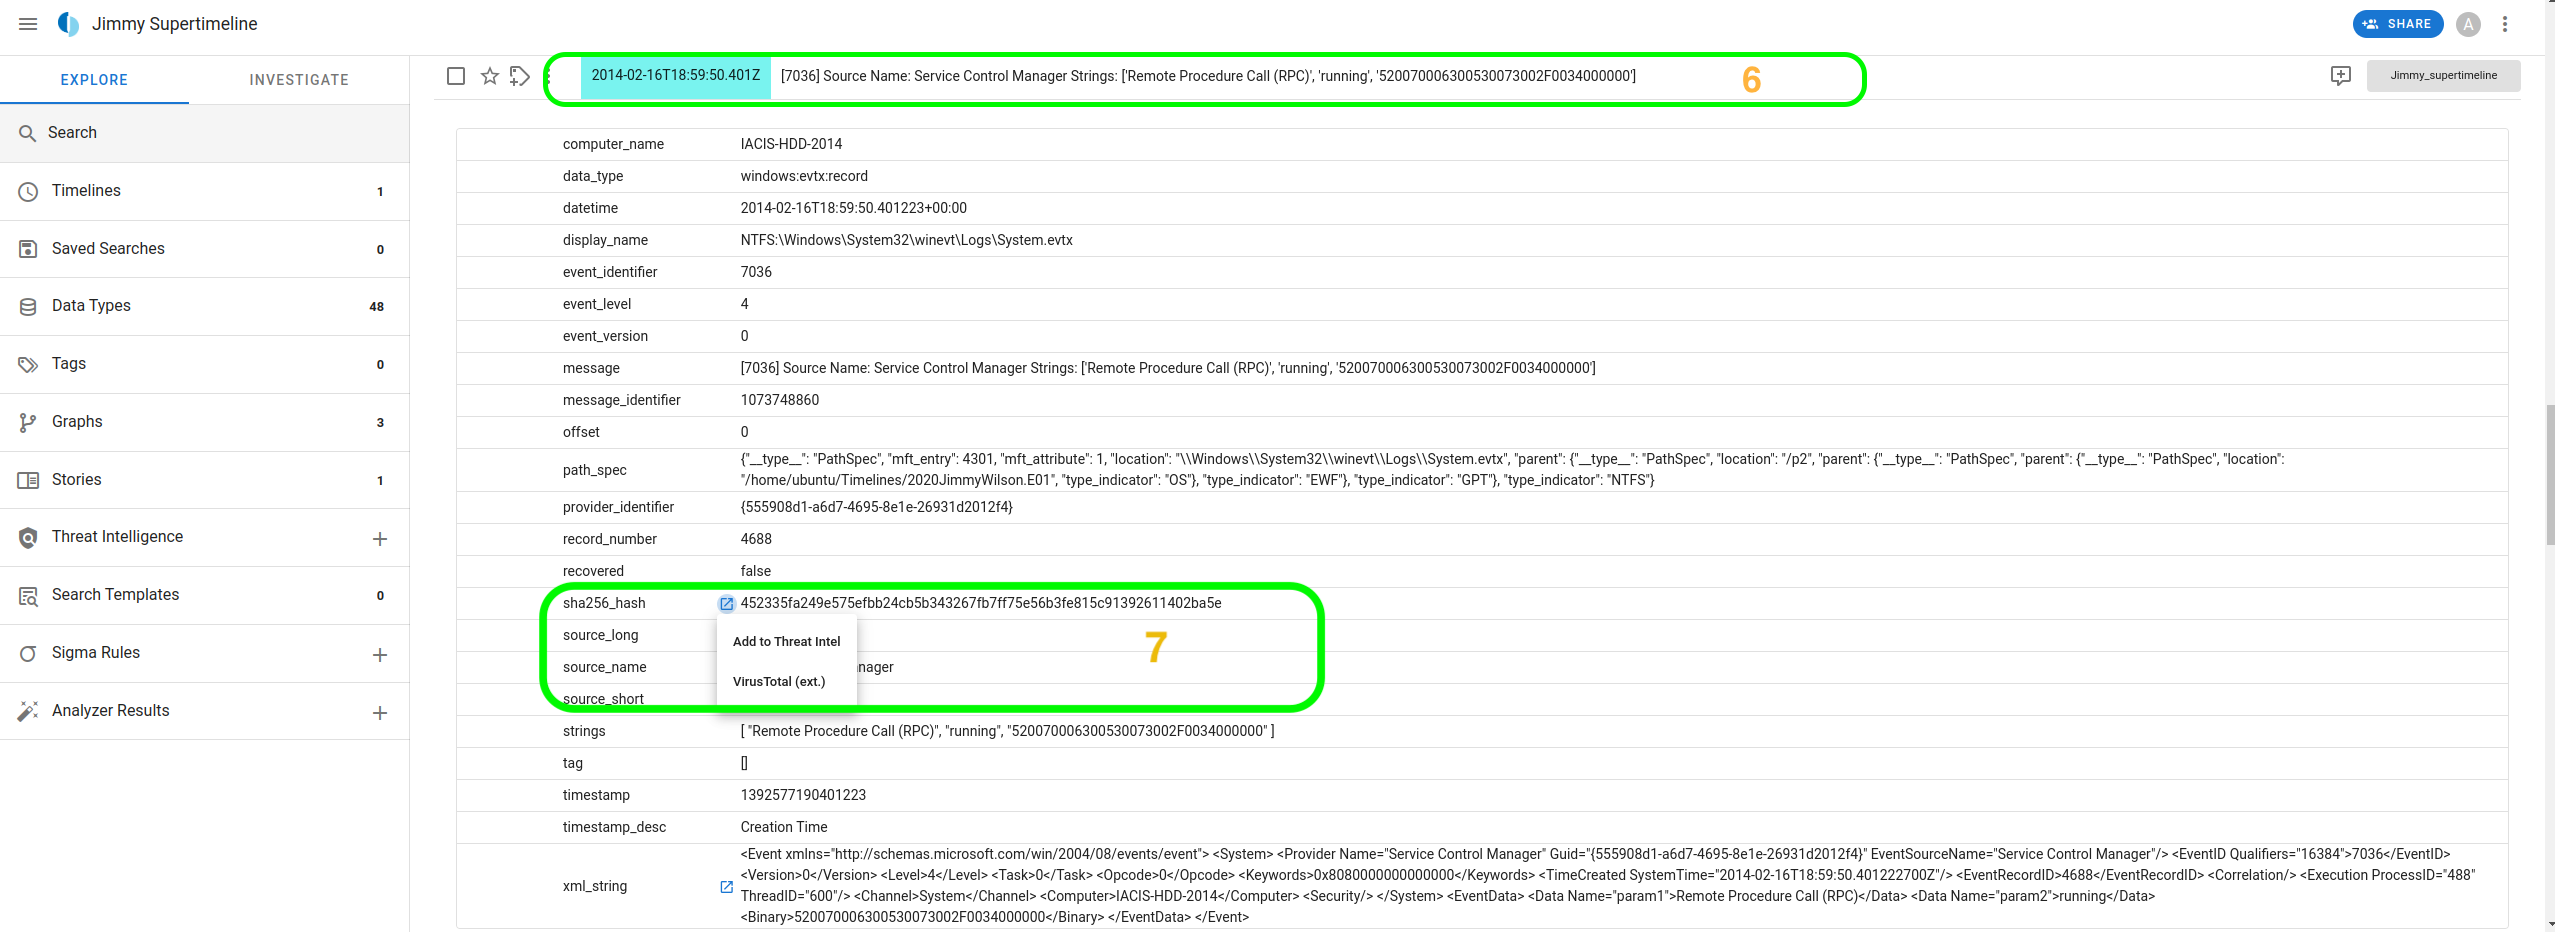
Navigating to the search bar, where we are presented with a list of searches based on the data types found within the timeline. This is also highlighted in the information on the side panel. To investigate the Windows XML Event entries found, select the windows:evtx:record search query. This will present us with a chronological arrangement of the event logs recorded on the system, and we can open an item to look at the details captured.
What if we want to narrow it down to a specific timeframe? We can add a time filter to see events from a particular range. For our study, let us set the filter between 2014-02-15 and 2014-02-17.
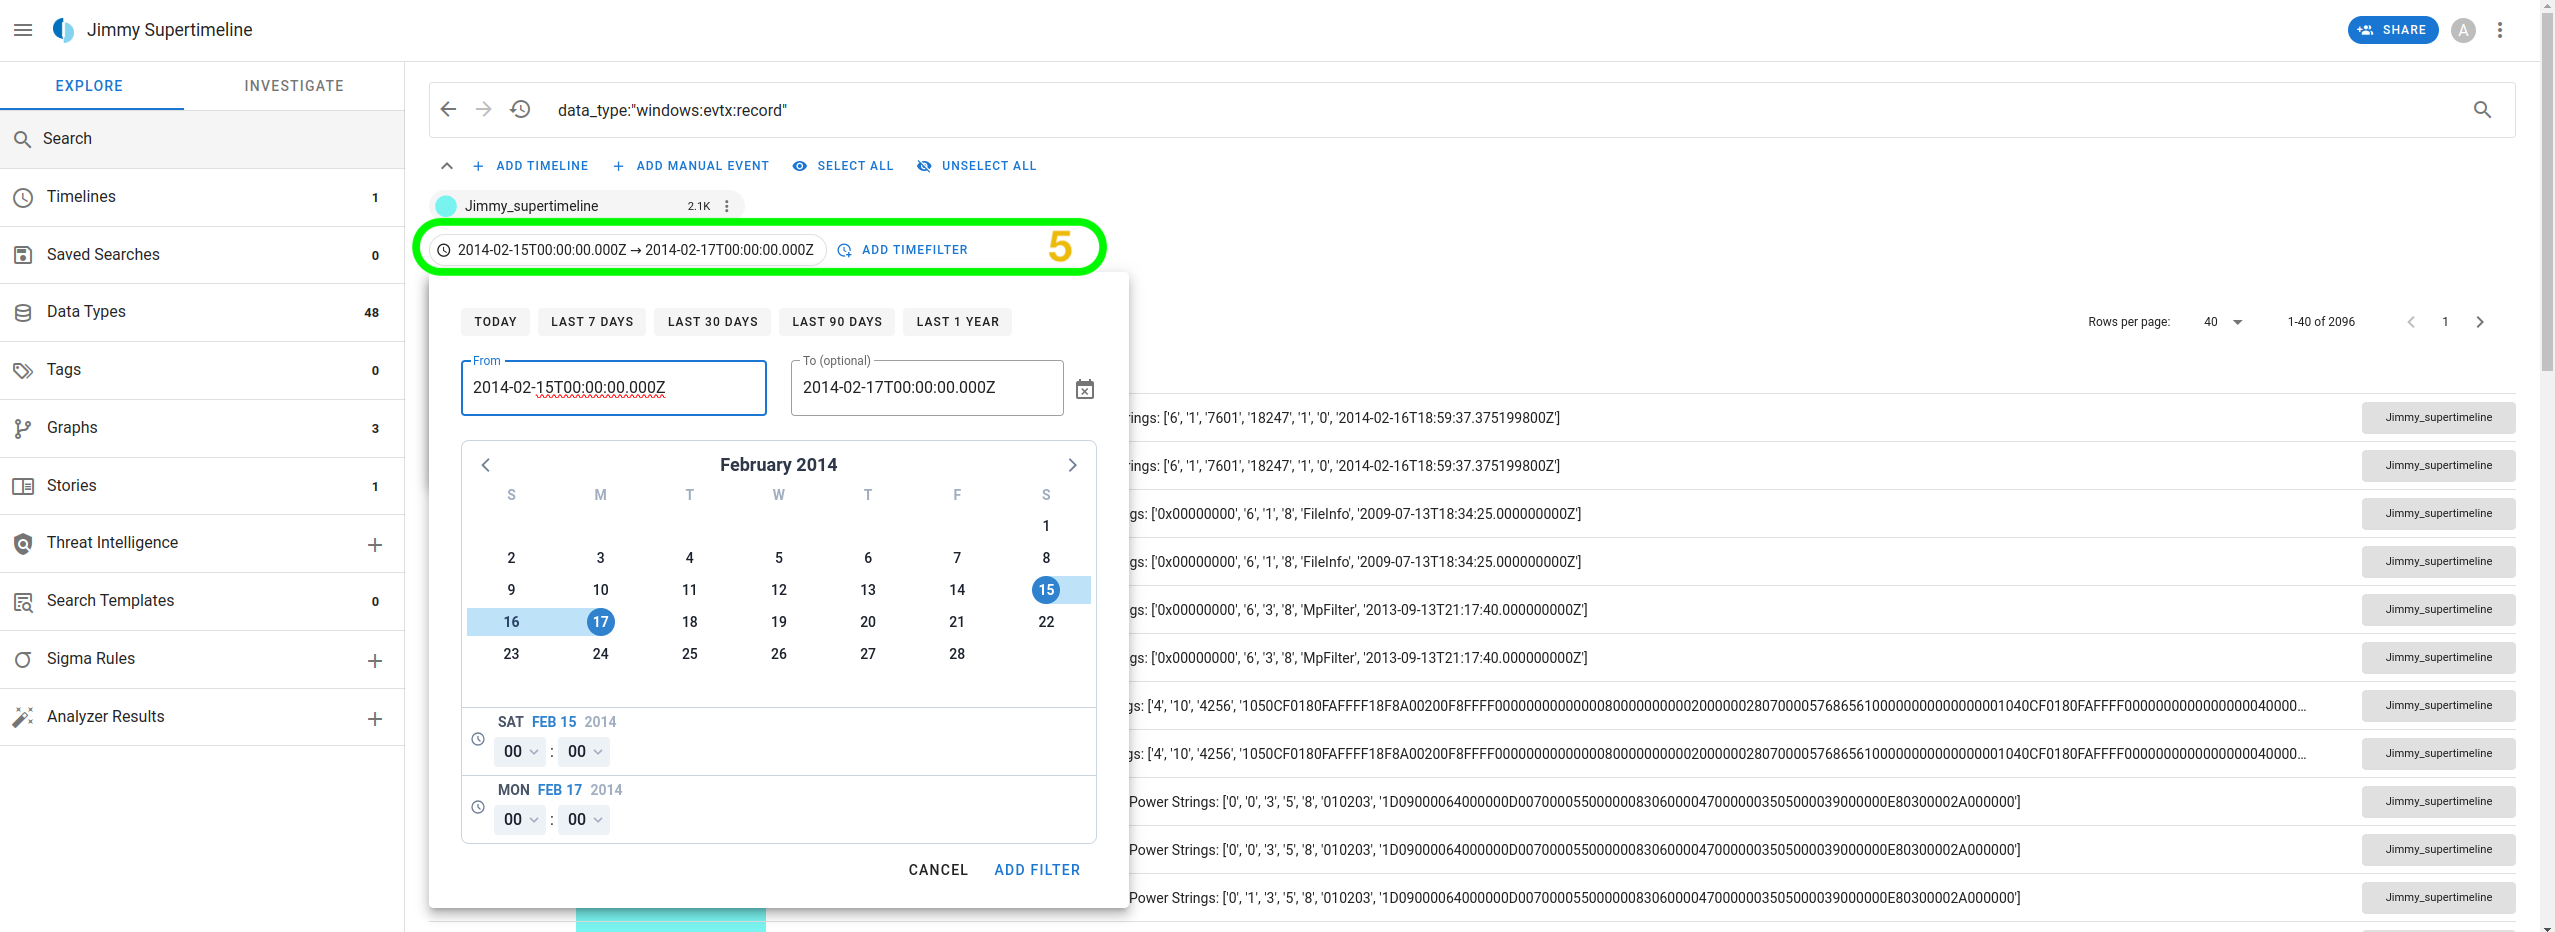
With the results within that timeframe, we can analyze an entry from 2014-02-16 18:59:50.401, which indicates a Remote Procedure Call (RPC) was running on the host.
Looking at the record, we can mainly be interested in the hash and xml_string fields for further investigation. We can seek a context lookup for the SHA256 hash, which would provide us with the options of either adding the value to threat intelligence or performing an external lookup on VirusTotal.
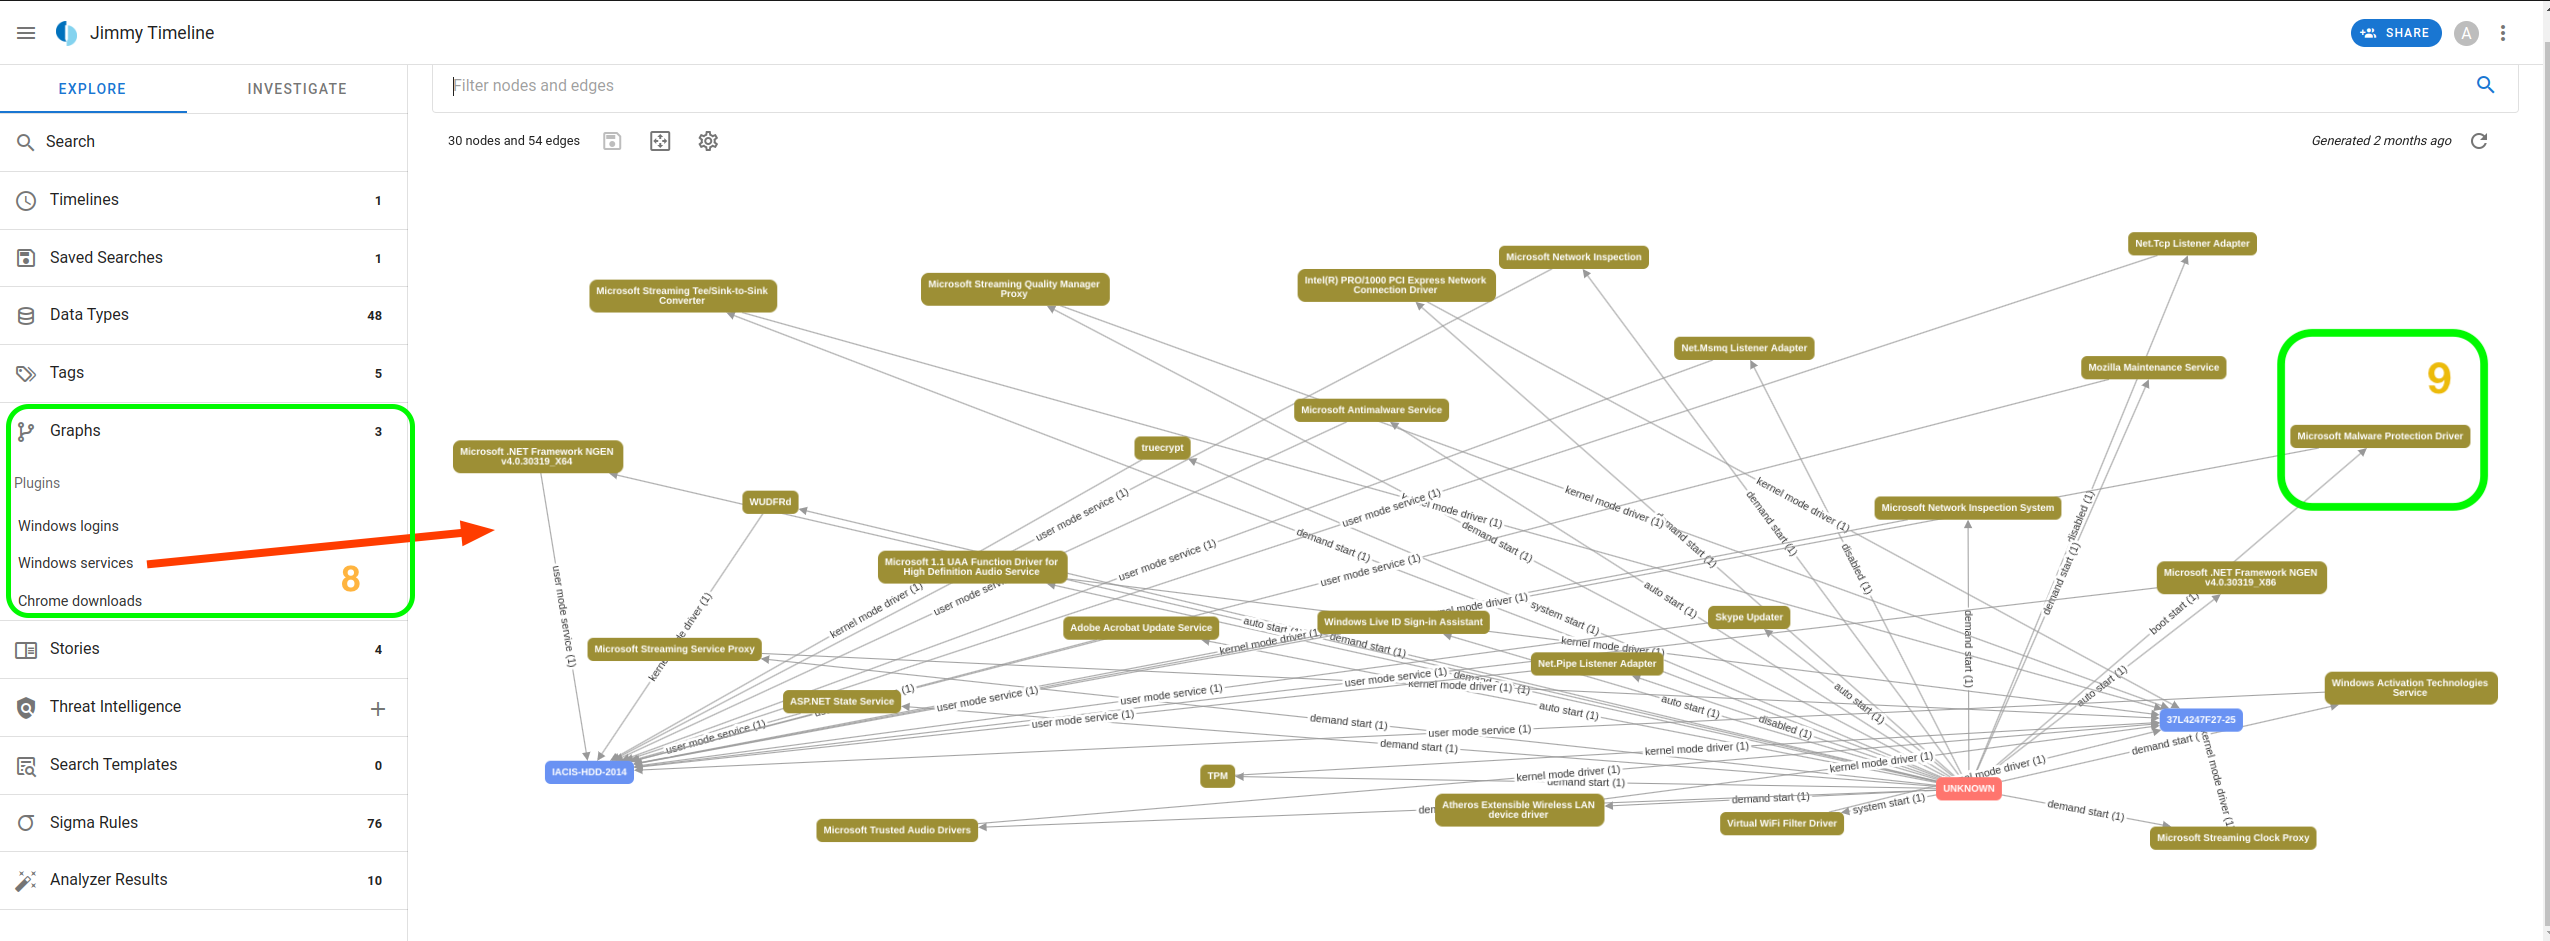
Analyzing Graphs
Another area of analysis we can look at within Timesketch is Graphs. In our case, we have three graphs that provide information on the logins, services, and downloads within Jimmy Wilson's system.
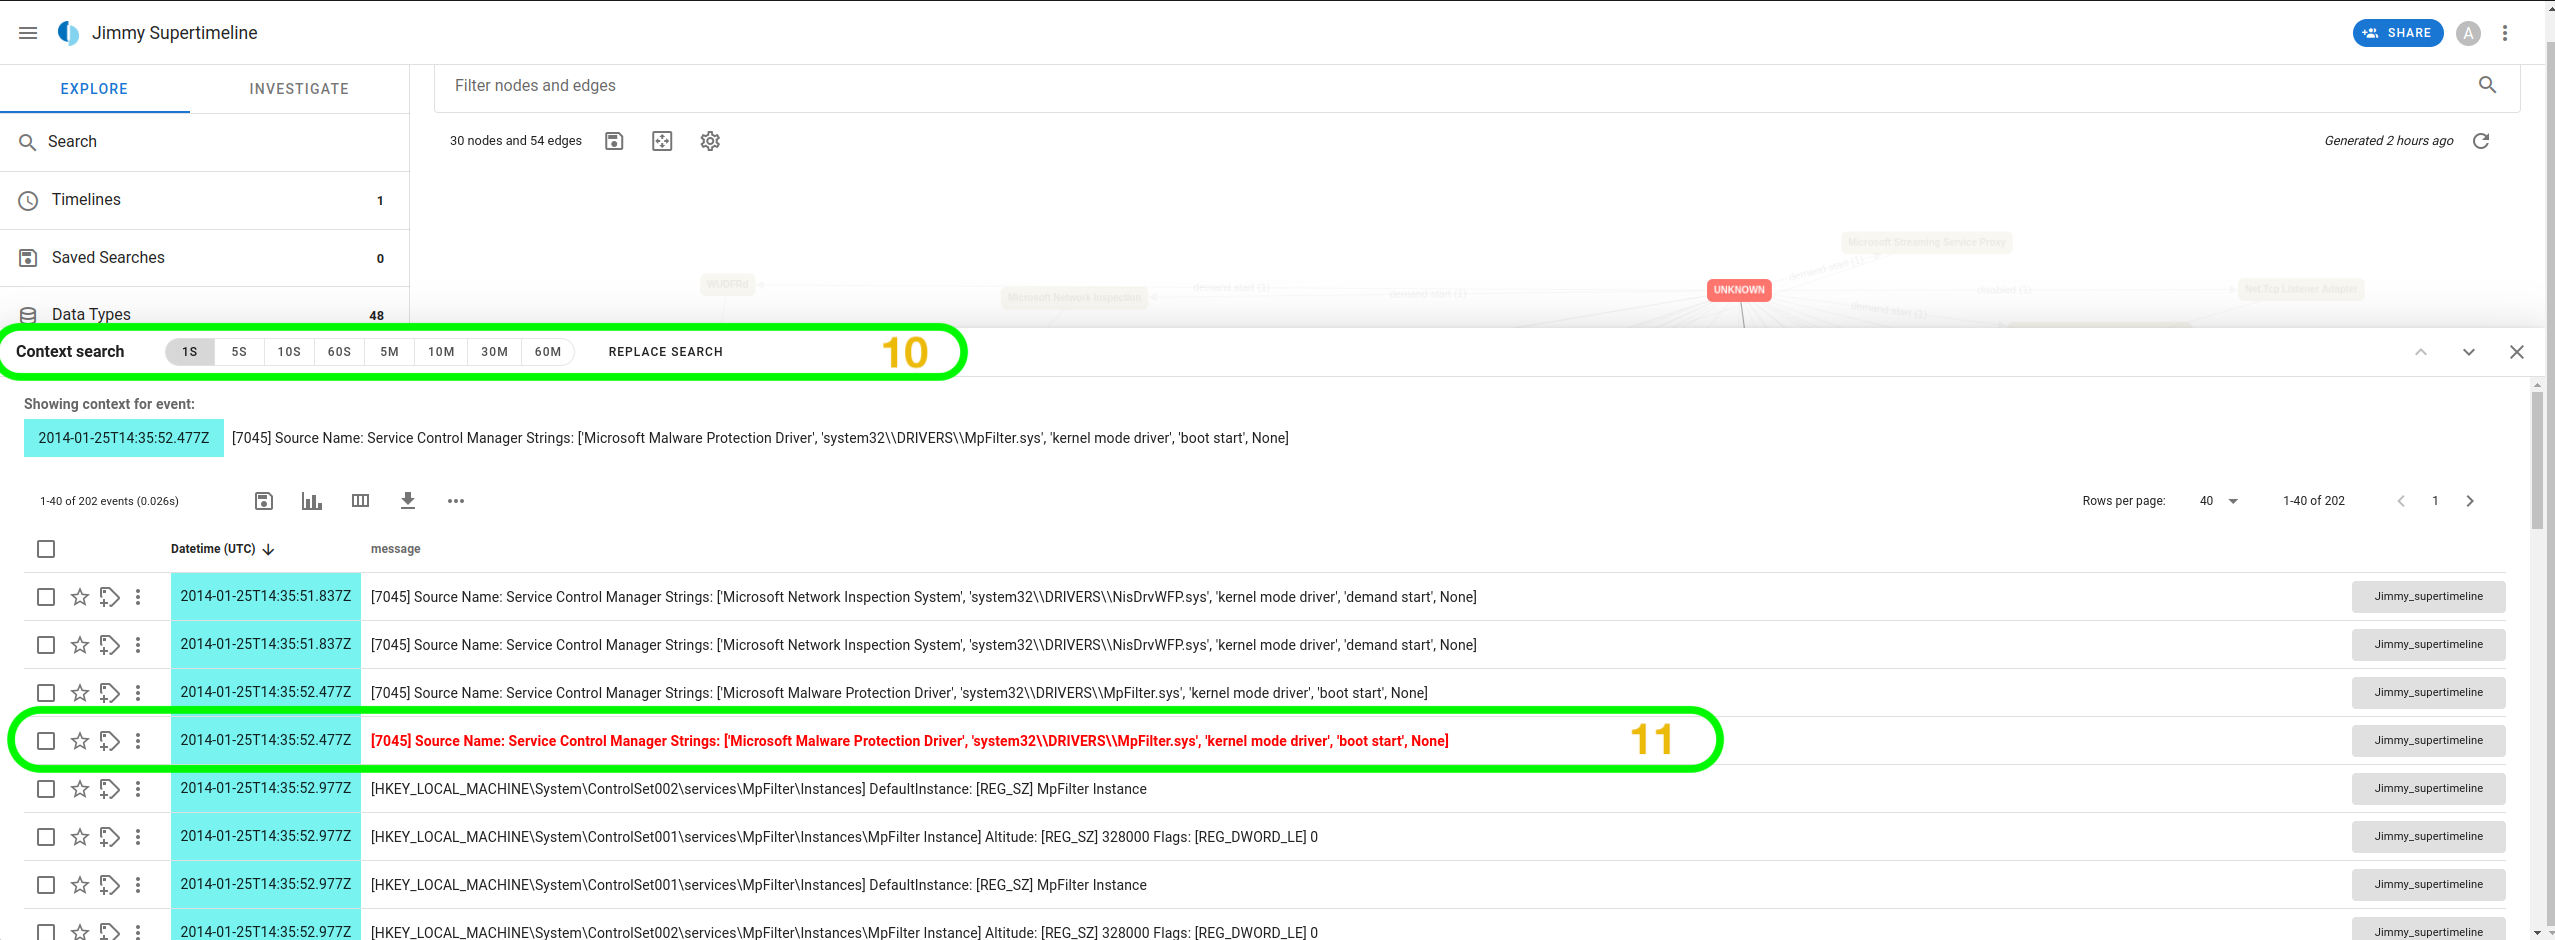
Let us open the Windows services graph. We can see how the various services are connected and how they were launched. For example, by selecting the Microsoft Malware Protection Driver, we can see that it has two initiators, one from the kernel mode driver and the other from boot start. We can even search the context from the details to understand the other events that preceded it. The context can be spread across 1 second up to 60 minutes around the event.
Running Analyzers
Timesketch offers a robust feature known as Analyzers that can enhance the analysis of indexed timelines by searching, correlating, and enriching data. The analyzers can be set to auto-run on every new timeline that is added or manually triggered. Once we have our Jimmy_supertimeline indexed, navigate to the side panel and click the plus icon next to the Analyzers Results tab. This will load up a page listing all the available analyzers.
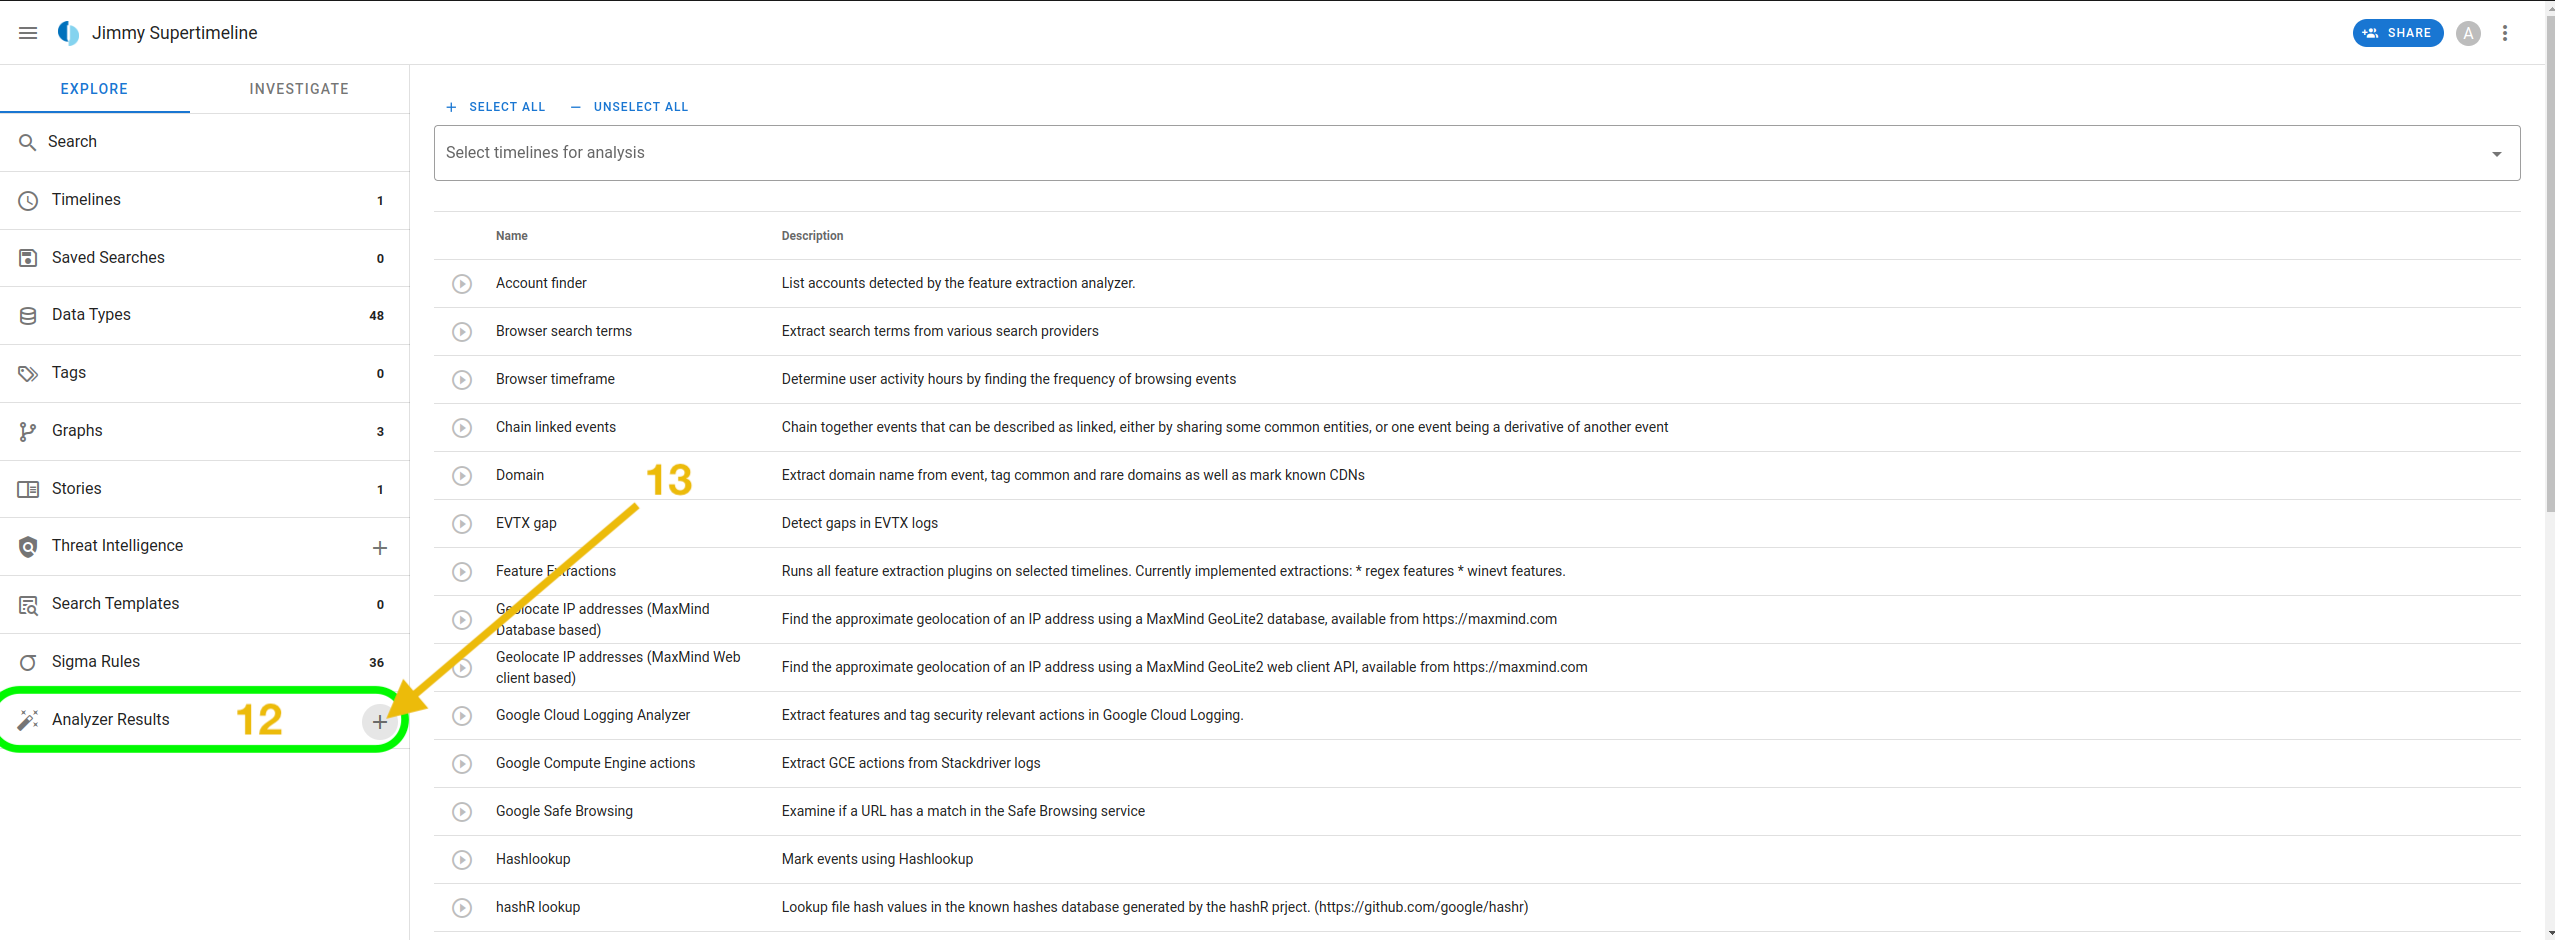
Select the Jimmy_supertimeline for analysis, and we will run two analyzers: gap and Browser search terms. The analyzer is designed to identify gaps in the Windows Event Log data, indicating periods where logging might have been disabled or events not captured. On the other hand, the browser search analyzer extracts search terms from browser history data, which provides insights into user activities.
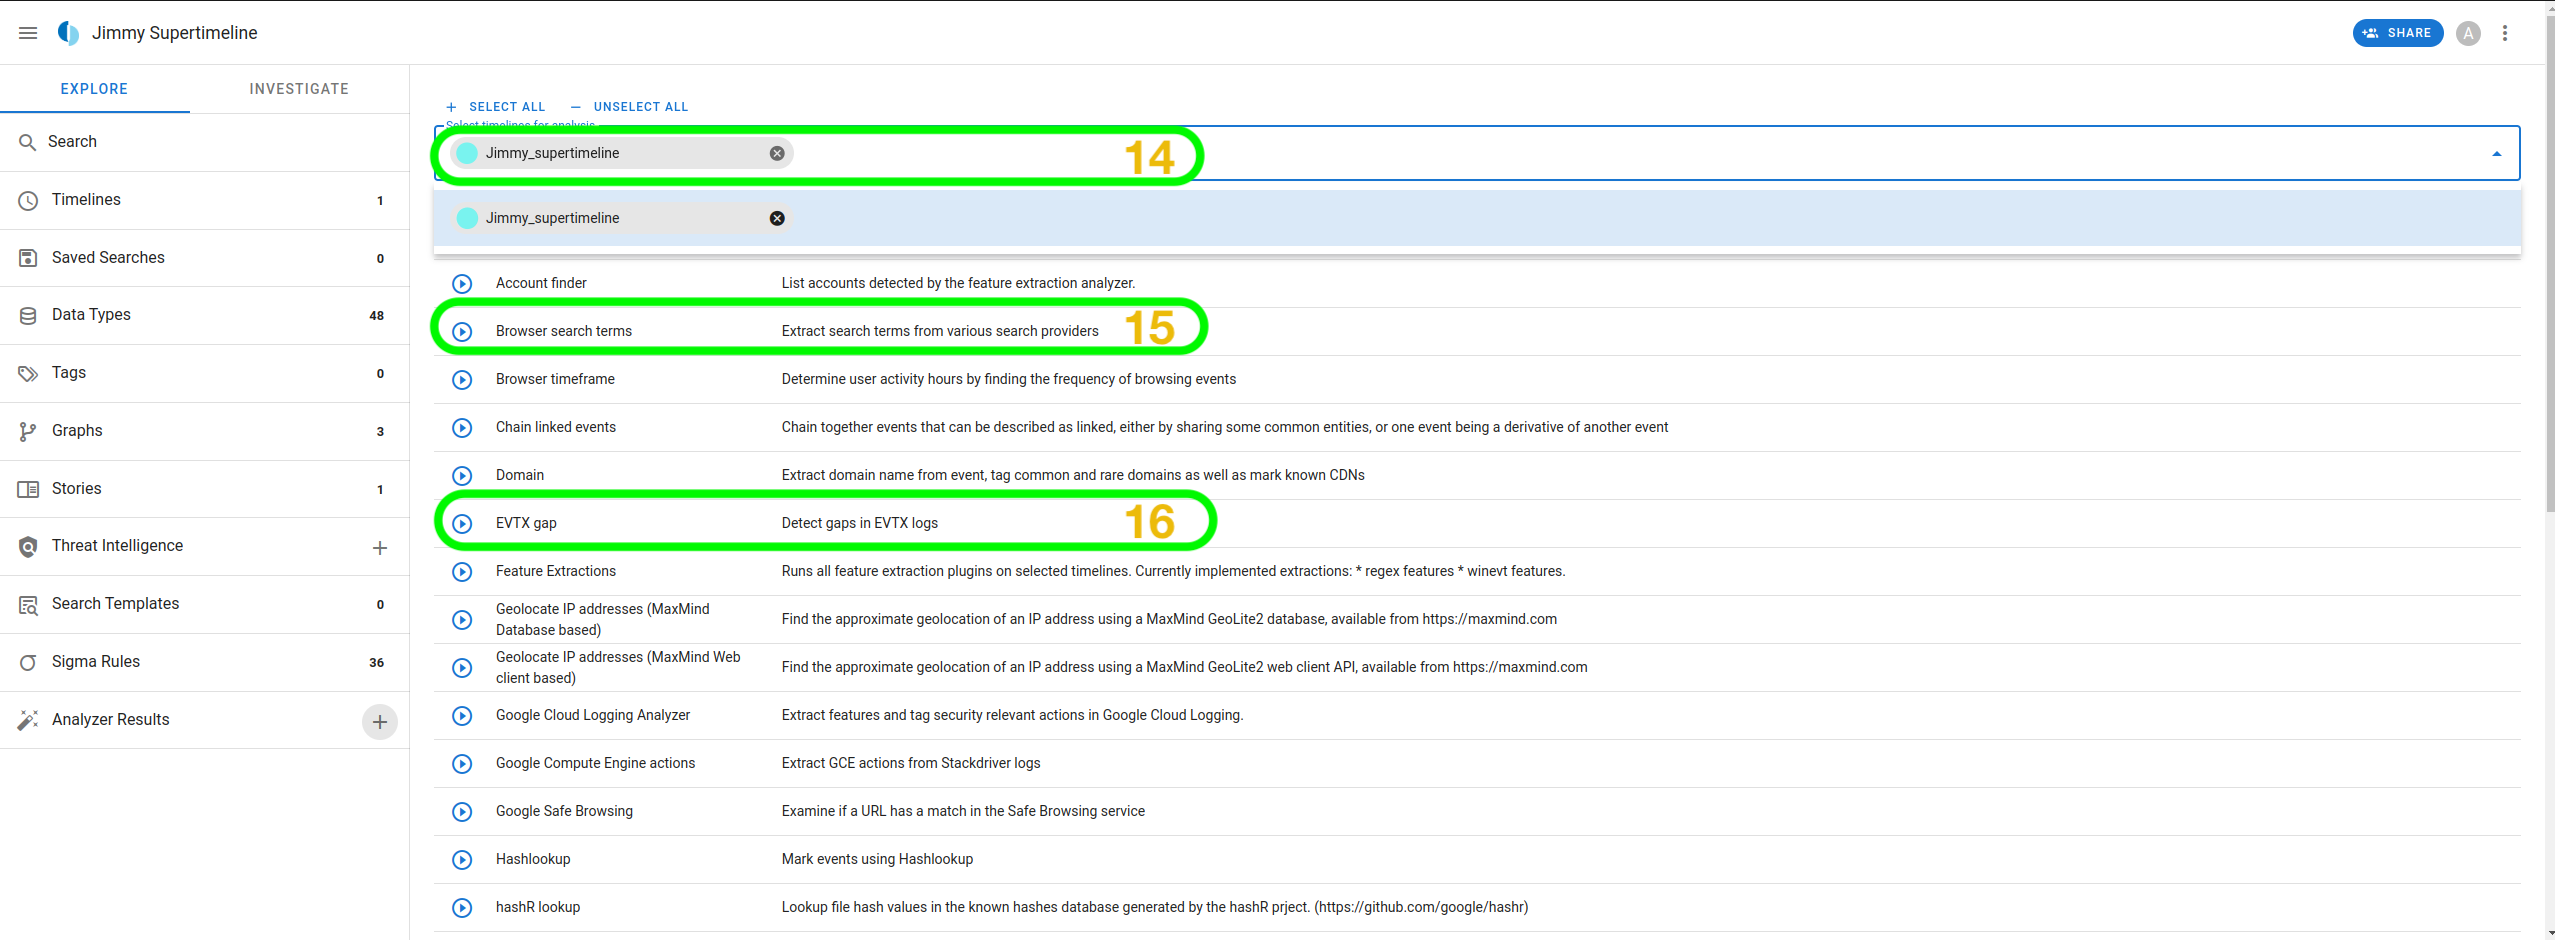
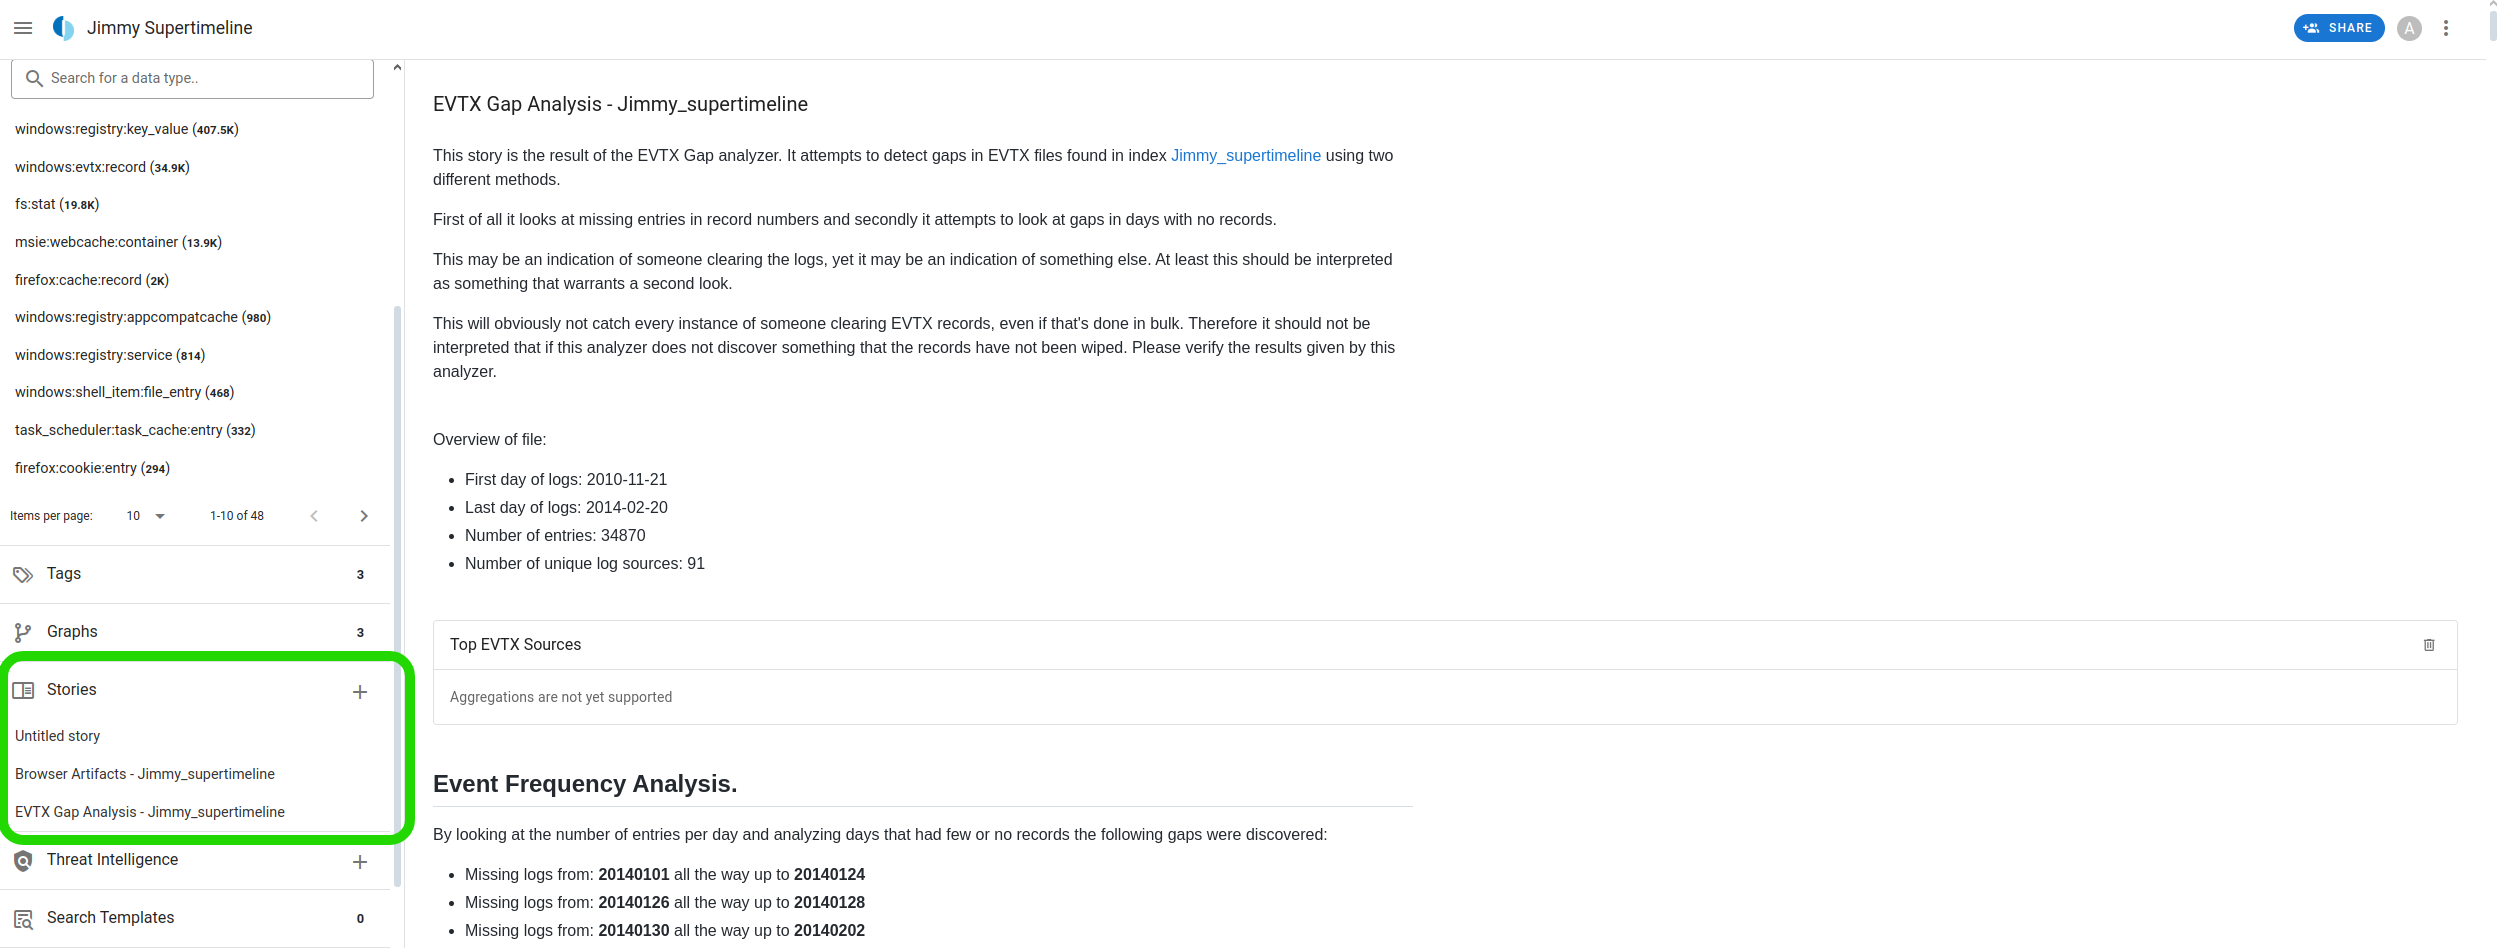
Clicking the "Run" button adjacent to the analyzers will initiate them against our timeline. To look at the results of the gap analyzer, ensure to refresh the Timesketch page and navigate to the Stories tab. Here, we will have a detailed story outlining all the gaps detected in the event logs.
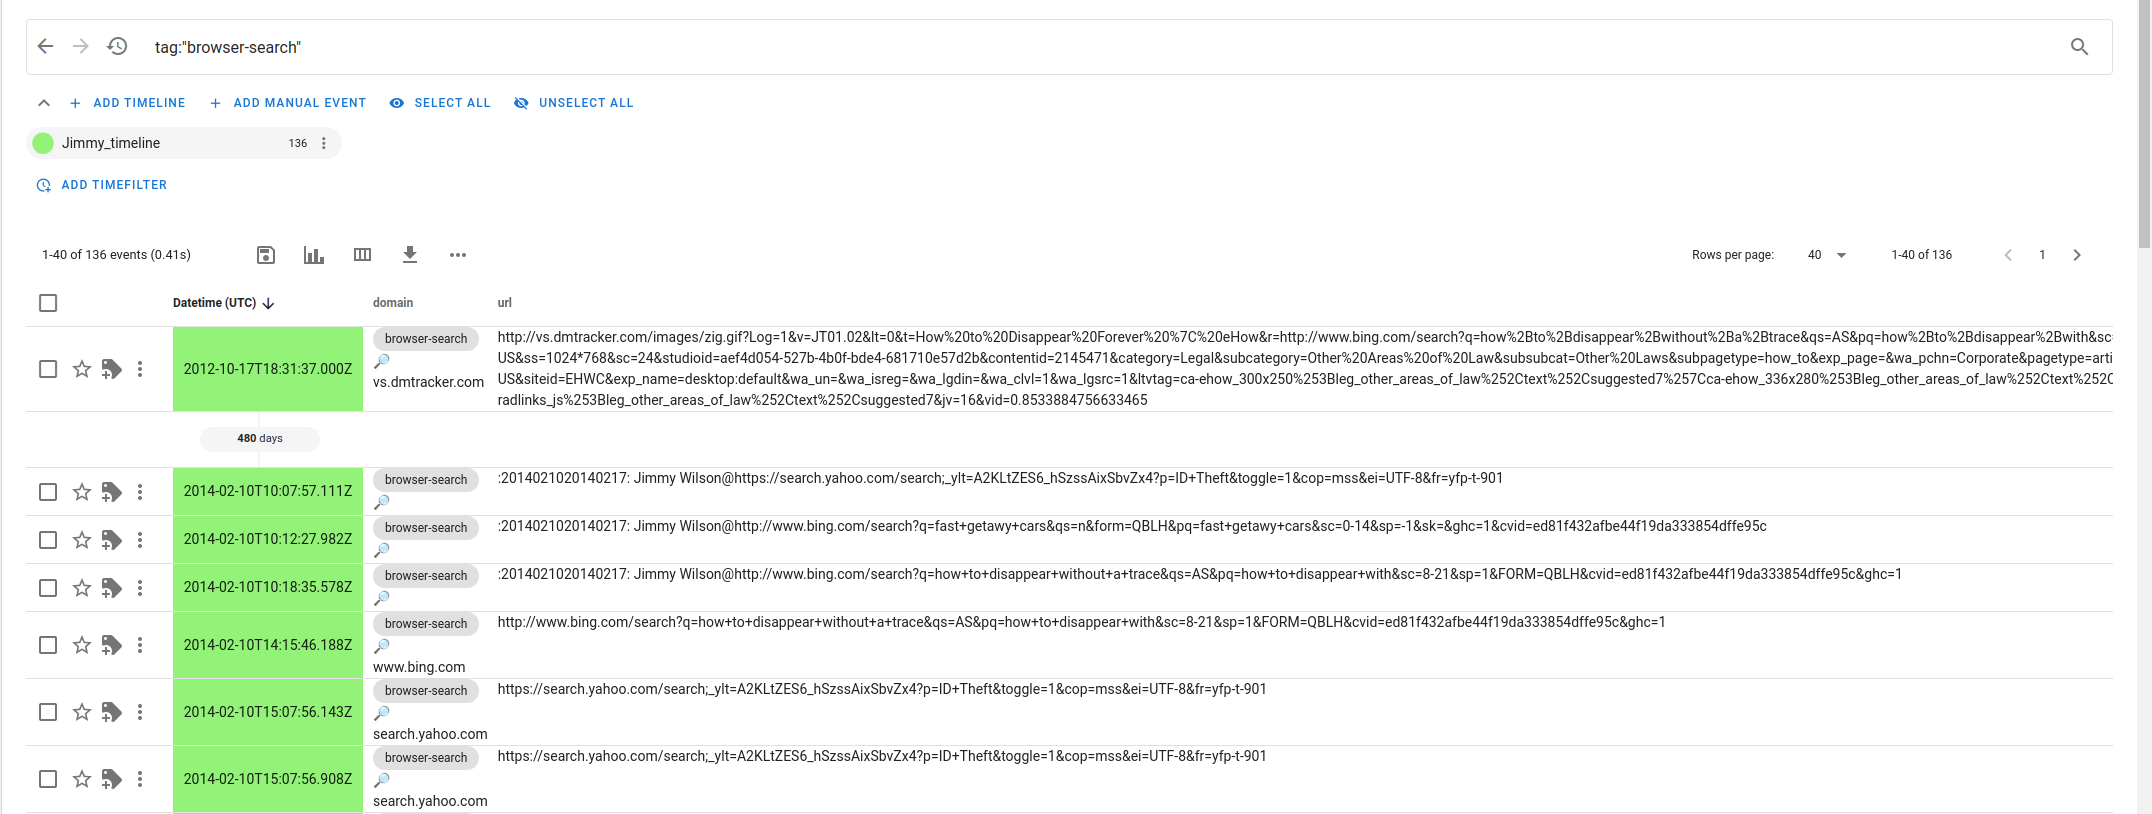
Navigate to the Saved Searches tab for the browser search results. The results will show a list of search terms used, along with the timestamps and browser utilized. This information can help us understand the user's activities and identify potential intent.
Note: The copy button in Timesketch may give you an error, but you can copy everything manually too.
How many entries were in the EVTX Gap Analysis under the Jimmy Supertimeline?
Which search engine did Jimmy Wilson use to search for "how to disappear without a trace?"
What is the path of the program that was called to initiate Microsoft Antimalware Service?
Scenario
You are part of a digital forensics team. One of your colleagues recently completed the Biblioteca challenge on TryHackMe as part of their training. They captured the disk image of their compromised machine and presented it to you for analysis as the Timeline_Challenge.plaso, located in the directory /home/analyst/Desktop/Timelines/Task6. Your task is to uncover information from the image's timeline with Log2Timeline and on Timesketch under the Challenge sketch and answer the following questions.
How many events were generated from the dpkg parser?
How many total tags were set?
What is the highest tagged element?
Under which username does the cronjob that executes app.py run?
What is the hash of the successful SSH login with the PID 1669?
Congratulations on completing the Timeline Analysis room.
We understood the need for timeline analysis and identified important resources for artifacts. Additionally, knowing the various tools that facilitate effective timeline capture and analysis is crucial to every incident responder.
Next Steps
In the next room in this module, Difficulties and Challenges, we will look at various challenges faced by teams revolving around organizational culture, resource limitations, data visibility and storage retention, anti-forensics, and human error.
Ready to learn Cyber Security?
TryHackMe provides free online cyber security training to secure jobs & upskill through a fun, interactive learning environment.
Already have an account? Log in