
Linux Incident Surface
Explore various areas of Incident Surface in Linux and how to identify the footprints of the incident.
easy


To access material, start machines and answer questions login.
Introduction
The Incident Surface focuses on all potential points or sources in the system where an incident could occur or traces of incidents could be found. This could lead to a security breach, which could also be part of the Attack Surface.
Attack Surface refers to various entry points where an attack or unauthorized attempt could be made to enter the system or gain unauthorized attempts.
In this introductory room on Incident Surface, we will explore
various incident points from the defensive perspective while also considering the attack surface perspective.
We will observe how the attack-related activities could be translated into the incident footprints or indicators of the attack on the system.
Scenario
Alice and Bob will assist us in completing the learning objectives of this room. Alice is a Red teamer, and Bob is a Blue teamer at Cybertees Pvt Ltd. Alice will help us perform post-exploitation activities. Bob will help us examine various incident surfaces to identify the footprints of the attack.
Learning Objective
As this is an introductory room in the Endpoint Investigation Module, other rooms will cover the topics in detail, but here, we will try to understand the overall picture. Some of the learning objectives covered in this room are:
- Explore various attack surfaces.
- Understand the attack perspective.
- Understand the defensive perspective.
Prerequisites
This room expects users to have covered the following rooms:
Let's dive in.
Continue to the next task.
Set up your virtual environment

Before moving forward, start the lab by clicking the Start Lab Machine
button. It will take 3 minutes to load properly. The VM will be
accessible on the right side of the split screen. If the VM is not
visible, use the blue Show Split View button at the top of the page.

| Username | Ubuntu |
| Password | TryHackMe! |
| IP | MACHINE_IP |
Note: All the important files are placed in the /home/activities/processes directory.
Connect with the lab. How many files and folders are in the /home/activities/processes directory?
 As explained before, the Incident Surface refers to all the potential points in the system where the attacker could exploit a weakness to gain unauthorized access, impacting the system's C-I-A.
Before diving into the room, let's examine the similarities and differences between the Attack Surface and the Incident Surface.
Attack Surface
The Attack Surface refers to all the points of interaction in a system where an adversary might attempt to exploit vulnerabilities to gain unauthorized access or carry out malicious activities. One of the main purposes of identifying the attack surface is to reduce the number of entry points that the attackers could potentially exploit.
Some of the key entry points that could be identified as part of the Attack Surface are:
- Open ports
- Running services
- Running software or applications with vulnerabilities
- Network communication
The primary goal is to minimize the attack surface by reducing potential weaknesses from the areas the attacker could exploit. Some of the steps that are involved in achieving this goal are:
- Identifying and patching the vulnerabilities
- Minimizing the usage of unwanted services
- Check the interfaces where the user interacts
- Minimizing the publically exposed services, applications, ports, etc
Incident Surface
The Incident Surface, on the other hand, refers to all the system areas involved in the detection, management, and response to an actual security incident (post-compromise). It includes where security breaches may be detected and analyzed and where a response plan must be implemented to mitigate the incident.
The main purpose of identifying the incident surface is to hunt down, detect, respond to, and recover from the incident if it has occurred. A security analyst would monitor all areas within the operating system where any traces or footprints of the attack could be found. Some of the key points where we could find the incident traces are highlighted below:
- System logs
- auth.log, syslog, krnl.log, etc
- Network traffic
- Running processes
- Running services
- The of the files and processes
Understanding the incident surface is key to efficiently responding to an ongoing attack, mitigating damage, recovering affected systems, and applying lessons learned to prevent future incidents.
In the following tasks, we will explore various incident surface areas and understand how to identify attack patterns or footprints.
Continue to the next task.
 Processes and network communication are crucial in any operating system in incident investigations. Monitoring and analyzing processes, especially those with network communication, can help identify and address security incidents. Running processes are a key part of the Incident Surface, as they could represent a potential source of evidence of an attack.
Investigating Processes
To better understand the importance of processes in the Incident Surface, let's go through the following exercises:
Activity # 1: Create and Run a Simple Process
In the /home/activities/processes directory, there is a code called simple.c, which runs on the system when executed. Alice will compile and execute this code, and then we will try to locate its traces in the system.
Note: It is important to note that all the commands we are running will be through the root user. Run the command sudo su to change the user from default to root.
1) Compiling the Code
Let's run the following command to compile and create an executable program, as shown below:
Command: gcc simple.c -o /tmp/simple
This command will create an executable file named simple in the same directory,
           root@tryhackme:/home/activities/processes# gcc simple.c -o /tmp/simple
root@tryhackme:/home/activities/processes# /tmp/simple
Now that the program has been compiled and executed from the /tmp/ directory, let's keep the process running and open a new terminal. We will now explore how to find traces of this activity that could be classified as an incident.
2) Detecting the Footprints
We will use the ps tool to examine the running processes on the Linux host. This tool provides a snapshot of the running processes, as shown below:
Command: ps aux
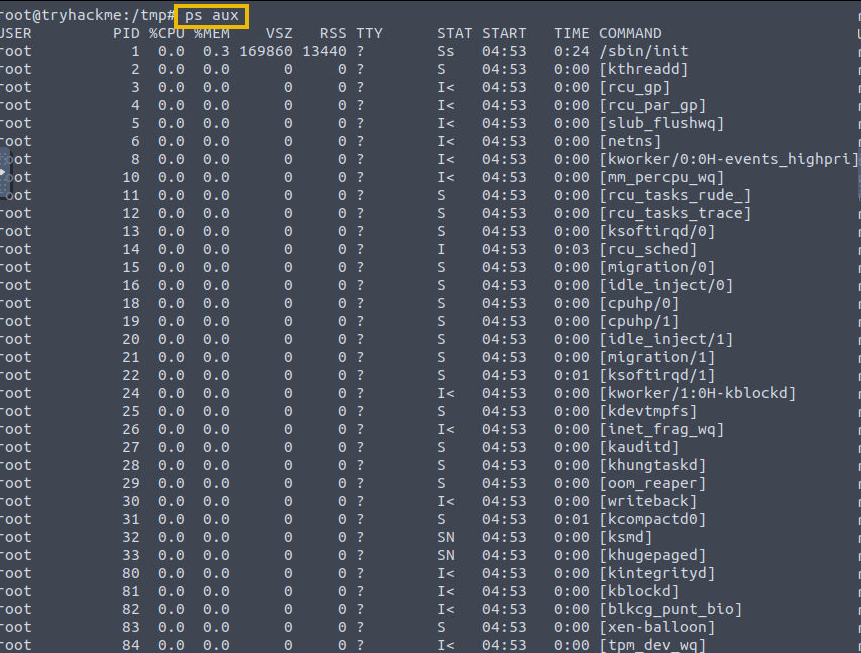
We will look at the snapshot of running processes and identify the process that looks suspicious. The command we used above is broken down below:
ps aux: This command displays all processes for all users in a detailed format. The flags are explained below:
a: Shows processes for all users.u: Displays user-oriented format (includes user and start time).x: Includes processes not attached to a terminal (useful for finding background processes).
Let's filter out the output to show details about our simple process, as shown below:
Command: ps aux | grep simple

The output provides the following information:
- USER: The user who owns the process.
- PID: Process ID.
- %CPU: CPU usage percentage.
- %MEM: Memory usage percentage.
- VSZ: Virtual memory size.
- RSS: Resident Set Size (memory currently used).
- TTY: Terminal associated with the process.
- STAT: Process state (e.g., R for running, S for sleeping, Z for zombie).
- START: Start time of the process.
- COMMAND: Command that started the process.
ps aux can be used to get information about the running process.
Let's examine the files/resources connected with this process using the lsof tool. This tool requires the PID to be provided as an argument, as shown below. As now know that, the pid assigned to our process is 49782.
Command: lsof -p 49782
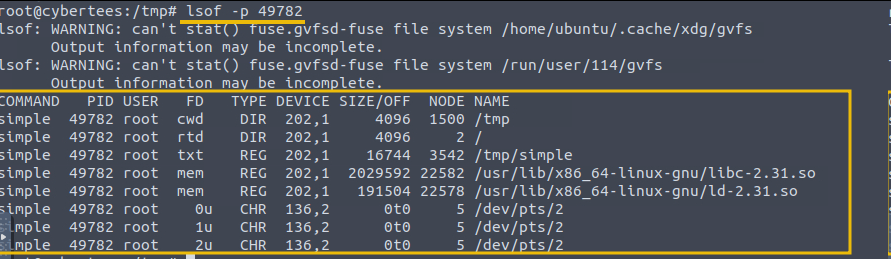
The output can give us an idea about the files / shared library, etc, associated with the process in question.
Process with Network Connection
In many incident scenarios, processes communicating via network to an external IP or the server are worth investigating. Therefore, examining the processes of making network connections and hunting down suspicious ones is very important.
To demonstrate, we will execute a process called netcom placed in the /home/activities/processes directory. Execute the process using the command ./netcom. This process will establish a network connection to a remote IP.
Investigating Network Communication
The first step would be to confirm whether the process is running on the system. Let's use the command ps aux | grep netcom to filter the result, as shown below:

The output confirms that the process is indeed running and has been assigned PID 267490, which will be different in your case.
Let's use the following command in another terminal to see if there is any network connection associated with this , as shown below:
Command: lsof -i -P -n
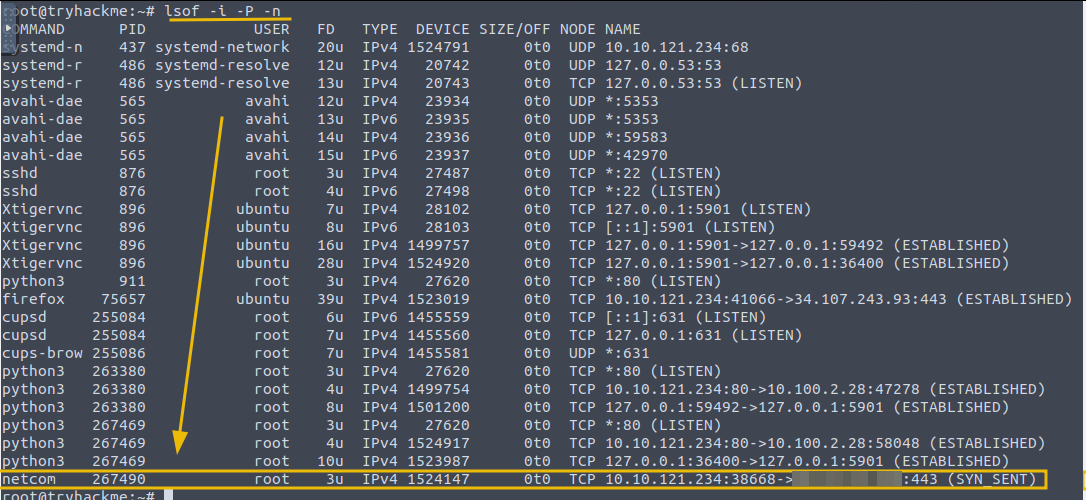
lsof: It stands of List Open Files. This command displays the information about the files opened by the processes.-i: This flag shows information about the network connections, including sockets and open network files.-P: This flag is used to display the port numbers.-n: This flag shows the IP address instead of resolving them to hostnames.
Utilizing Osquery
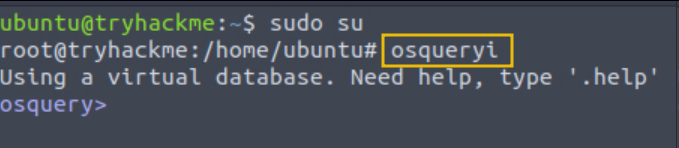
We will use another handy tool called osquery to explore processes and its network connection. To start osquery, open a new terminal and run the command with root user:
Command: osqueryi
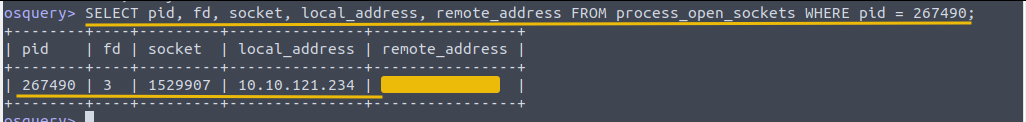
We can use osquery as well to narrow down the result to display the network connection associated with this PID using the following osquery command:
Osquery command: SELECT pid, fd, socket, local_address, remote_address FROM process_open_sockets WHERE pid = 267490;
Note: You can review the Osquery: The Basics room to understand how this tool works. It is also extensively covered in the Live Analysis room.
Where Processes Fit in the Incident Surface
Processes can be exploited, manipulated, or used by attackers to execute malicious activities. It is important to investigate the processes running on the system from various angles. The following points are a few use cases of the incidents related to processes:
- A process running from a tmp directory (context matters).
- A suspicious child-parent process.
- Process with a suspicious network connection.
- Orphan process. Not all orphan processes are suspicious, but those with no parent process associated after execution are worth investigating.
- Suspicious processes that are running through a .
- System-related processes or binaries running from the tmp directory or user directories.
Investigating processes and finding a suspicious process that could indicate a potential incident is covered in detail in the process Investigation room.
What is the remote IP to which the process netcom establishes the connection?
Update the osquery command. What is the remote port the netcom process is communicating to?
generally refers to adversaries' techniques for maintaining access to a compromised system after the initial exploitation. To understand how different incidents are identified at various points of the endpoint, we will first perform the attack and then examine where and how the attack footprints are reflected.
: Taking Foothold
Let's start by investigating the footprints of , as this would be one of the first steps an intruder would take to maintain a foothold on the host after post-exploitation.
Some of the attack actions that can result in on a machine are explained below:
Activity#1: Account Creation
In an assumed compromised scenario, let's pretend to be Alice, who has got hold of the system. Start by creating a backdoor account using the following command:
Command:
The following commands will create an account "attacker" and added into the sudo group.
sudo useradd attacker -G sudosudo passwd attacker
echo "attacker ALL=(ALL:ALL) ALL" | sudo tee -a /etc/sudoers
The above commands will create an account "attacker" and added into the sudo group.
           ubuntu@tryhackme:/home$ sudo useradd attacker -G sudo
ubuntu@tryhackme:/home$ sudo passwd attacker
New password:
Retype new password:
passwd: password updated successfully
ubuntu@tryhackme:/home$ echo "attacker ALL=(ALL:ALL) ALL" | sudo tee -a /etc/sudoers
attacker ALL=(ALL:ALL) ALL
Identifying the Footprints
Let's pretend to be Bob, a blue teamer trying to examine various incident surfaces to identify the footprints of the backdoor account that was created.
Examining Logs
One of the key places we could begin looking at would be the logs. All common logs can be found at the /var/log/ location, as shown below:
           ubuntu@tryhackme:/home$ cd /var/log/
ubuntu@tryhackme:/var/log$ ls -al
total 3108
drwxrwxr-x  16 root              syslog             4096 Sep  5 00:00 .
drwxr-xr-x  14 root              root               4096 Feb 27  2022 ..
-rw-r--r--   1 root              root              35148 Aug 20 07:34 Xorg.0.log
-rw-r--r--   1 root              root             116188 Feb 16  2024 Xorg.0.log.old
-rw-r--r--   1 root              root                  0 Sep  1 00:00 alternatives.log
-rw-r--r--   1 root              root               8021 Aug 22 06:57 alternatives.log.1
-rw-r--r--   1 root              root               3001 Feb 16  2024 alternatives.log.2.gz
drwxr--r-x   3 root              root               4096 Feb 27  2022 amazon
-rw-r-----   1 root              adm                   0 Aug 20 07:34 apport.log
-rw-r-----   1 root              adm                 398 Feb 16  2024 apport.log.1
drwxr-xr-x   2 root              root               4096 Sep  5 06:52 apt
-rw-r-----   1 syslog            adm               46892 Sep  5 21:30 auth.log
-rw-r-----   1 syslog            adm               72850 Aug 31 23:30 auth.log.1
-rw-r-----   1 syslog            adm                3325 Aug 24 23:30 auth.log.2.gz
-rw-r-----   1 syslog            adm                9404 Aug 20 07:34 auth.log.3.gz
-rw-rw----   1 root              utmp                  0 Sep  1 00:00 btmp
-rw-rw----   1 root              utmp               3840 Aug 27 14:04 btmp.1
-rw-r-----   1 root              adm               44217 Aug 20 07:34 cloud-init-output.log
-rw-r-----   1 syslog            adm             1576538 Aug 20 07:34 cloud-init.log
drwxr-xr-x   2 root              root               4096 Sep  5 00:00 cups
drwxr-xr-x   2 root              root               4096 Oct  7  2020 dist-upgrade
------------------------------------------
Examining auth.log
Let's use the following command to search for all user account creation activities in the auth.log, as shown below:
Command: cat auth.log | grep useradd
           ubuntu@tryhackme:/var/log$ sudo su
root@tryhackme:/var/log# cat auth.log | grep useradd
Sep  5 21:18:19 tryhackme sudo:   ubuntu : TTY=pts/0 ; PWD=/home ; USER=root ; COMMAND=/usr/sbin/useradd attacker -G sudo
Sep  5 21:18:19 tryhackme useradd[184928]: new group: name=attacker, GID=1001
Sep  5 21:18:19 tryhackme useradd[184928]: new user: name=attacker, UID=1001, GID=1001, home=/home/attacker, shell=/bin/sh, from=/dev/pts/0
Sep  5 21:18:45 tryhackme sudo:   ubuntu : TTY=pts/0 ; PWD=/home ; USER=root ; COMMAND=/usr/sbin/useradd attacker -G sudo
If we look at the output, we can see various log entries associated with the user account creation activity.
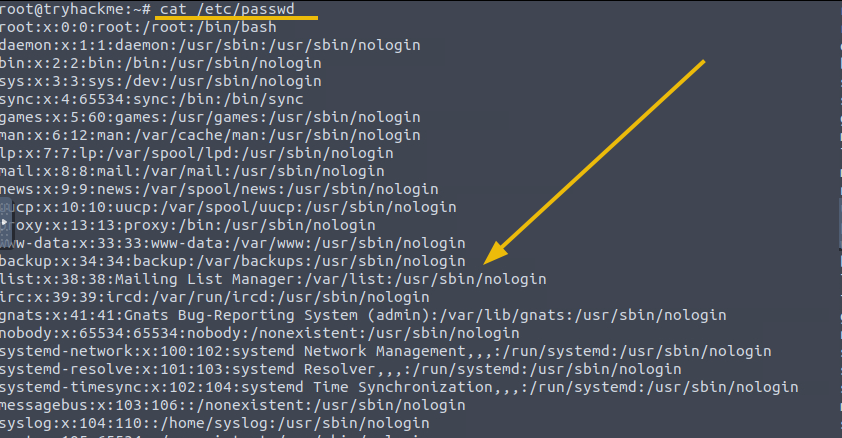
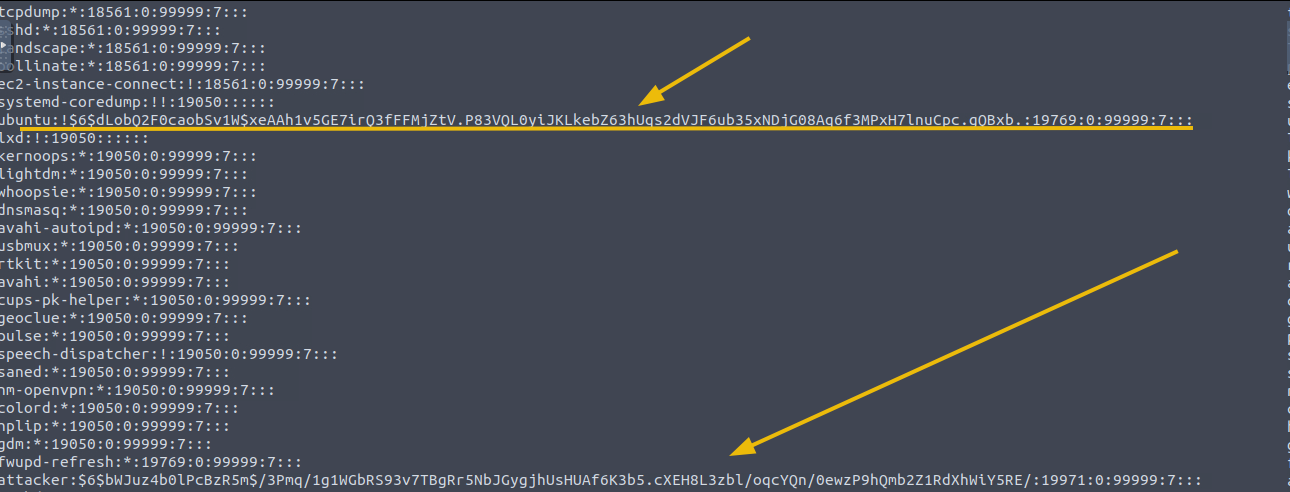
Examining /etc/passwd File
Another configuration file called passwd also contains information about the users created either by default or by users, as shown below:
Command: cat /etc/passwd
           root@tryhackme:/var/log# cat /etc/passwd
---
----------
kernoops:x:113:65534:Kernel Oops Tracking Daemon,,,:/:/usr/sbin/nologin
lightdm:x:114:121:Light Display Manager:/var/lib/lightdm:/bin/false
whoopsie:x:115:123::/nonexistent:/bin/false
dnsmasq:x:116:65534:dnsmasq,,,:/var/lib/misc:/usr/sbin/nologin
avahi-autoipd:x:117:124:Avahi autoip daemon,,,:/var/lib/avahi-autoipd:/usr/sbin/nologin
usbmux:x:118:46:usbmux daemon,,,:/var/lib/usbmux:/usr/sbin/nologin
rtkit:x:119:125:RealtimeKit,,,:/proc:/usr/sbin/nologin
----------------------------
avahi:x:120:126:Avahi mDNS daemon,,,:/var/run/avahi-daemon:/usr/sbin/nologin
fwupd-refresh:x:130:136:fwupd-refresh user,,,:/run/systemd:/usr/sbin/nologin
attacker:x:1001:1001::/home/attacker:/bin/sh
In the output, we can see all the accounts, including the one we just created. Some of the information this file contains are:
- Username.
- The password placeholder is represented by x or *, indicating that the password is stored in the/etc/shadow file.
- User ID assigned to the user
- Group ID assigned to the user.
- User's home directory.
- Path to user's default shell.
Activity # 2 Cron Job
Another persistence method is cron jobs, which attackers can use to maintain persistent access to a compromised system. Cron is a time-based job scheduler in Unix-like systems that allows tasks (scripts, commands, or programs) to be executed automatically at specified intervals.
To create a malicious cron job, we can modify the crontab file or use the crontab command to edit scheduled jobs for the current user or system using the following command:
Command: crontab -e
This will open the crontab file, and we can add an entry.
Examples of Crontab Entry:
@reboot /path/to/malicious/script.sh: This command will execute thescript.shat every reboot.* * * * * root /path/to/malicious/script.sh: This command will executescript.shevery minute with root privileges.
           # Edit this file to introduce tasks to be run by cron.
#
# Each task to run has to be defined through a single line
# indicating with different fields when the task will be run
# and what command to run for the task
#
# To define the time you can provide concrete values for
# minute (m), hour (h), day of month (dom), month (mon),
# and day of week (dow) or use '*' in these fields (for 'any').
#
# Notice that tasks will be started based on the cron's system
# daemon's notion of time and timezones.
#
# Output of the crontab jobs (including errors) is sent through
# email to the user the crontab file belongs to (unless redirected).
#
# For example, you can run a backup of all your user accounts
# at 5 a.m every week with:
# 0 5 * * 1 tar -zcf /var/backups/home.tgz /home/
#
# For more information see the manual pages of crontab(5) and cron(8)
#
# m h  dom mon dow   command
@reboot /path/to/malicious/script.sh
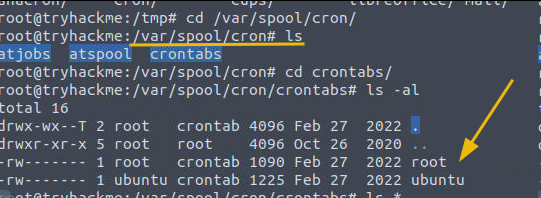
Examining Malicious Cronjobs
We can explore /var/spool/cron/crontabs/[username] to explore the cronjobs associated with each user, as shown below:
Activity # 3 Services
Another way to achieve persistence on a compromised system is installing a service on the Linux server that will run in the background and start on every reboot. Let's learn how to investigate this activity by first creating a service and installing it on the disk, as shown below:
Step1: Create a Configuration File
We will create a configuration file, as shown below:
Command: sudo nano /etc/systemd/system/suspicious.service
Add the following content to the configuration file.
[Unit]
Description=Suspicious_Service
After=network.target

[Service]
ExecStart=/home/activities/processes/suspicious
Restart=on-failure
User=nobody
Group=nogroup

[Install]
WantedBy=multi-user.target
This configuration file will create a service and will execute the mentioned process. Keywords used in the configuration file are explained below:
ExecStart: Specifies the command to run the collector program. Adjust the path as necessary.Restart=on-failure: Ensures the service restarts if it fails.UserandGroup: Runs the service under the specified user and group. Adjust as needed for your security requirements.
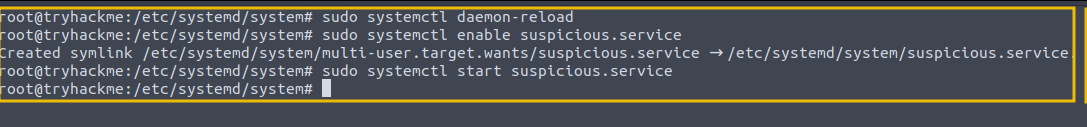
Step2: Enable and Start Service
Now that we have created a service let's enable and start the service using the following commands in order:
- Reload the systemd manager configuration to recognize the new service:
- Command:
sudo systemctl daemon-reload
- Command:
- Enable the service to run at startup:
- Command:
sudo systemctl enable suspicious.service
- Command:
- Start the service right away.
- Command:
sudo systemctl start suspicious.service
- Command:
The executed commands are shown in the image below:
Status of the Service
Once everything is done, we can check the status of the service using the following command:
Command: sudo systemctl status suspicious.service
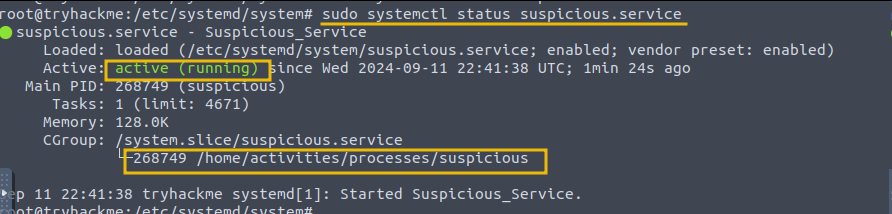
The output shows that the service is loaded and running on the system.
Examining the Running Service
Now that we know how an adversary could install and run the service in the background, let's see how we can find this service's footprints on the system.
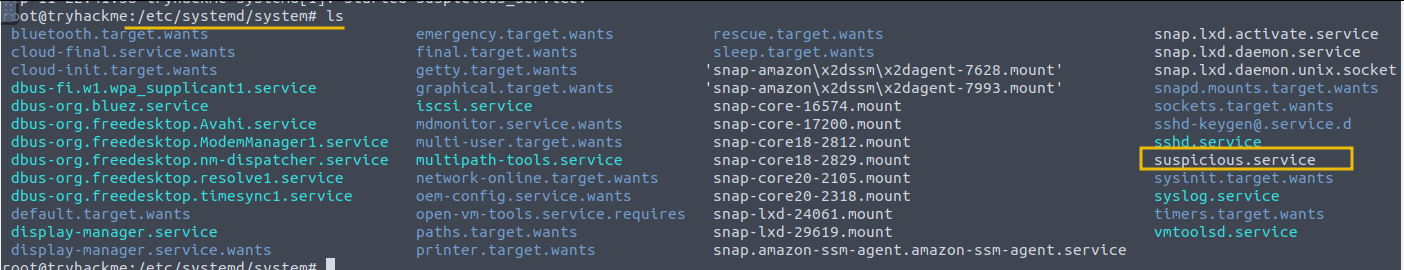
1) Reviewing the Directory
All services installed and enabled on the Linux host can be found in the /etc/systemd/system directory. We can check the content of this directory to see if we can find any suspicious-looking services installed, as shown below:
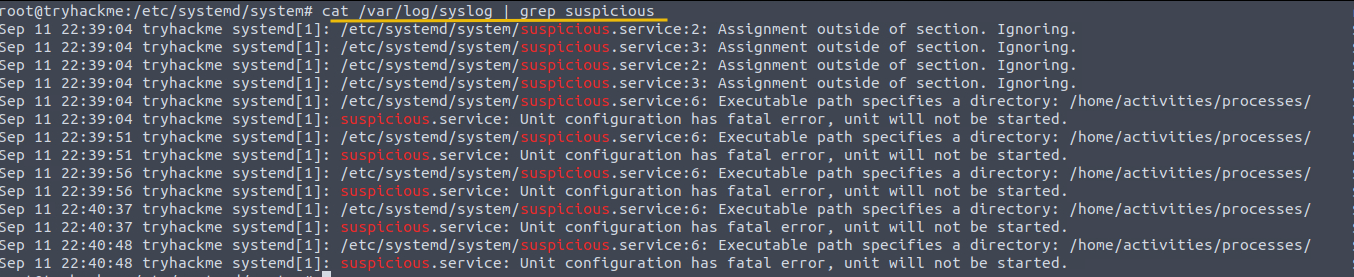
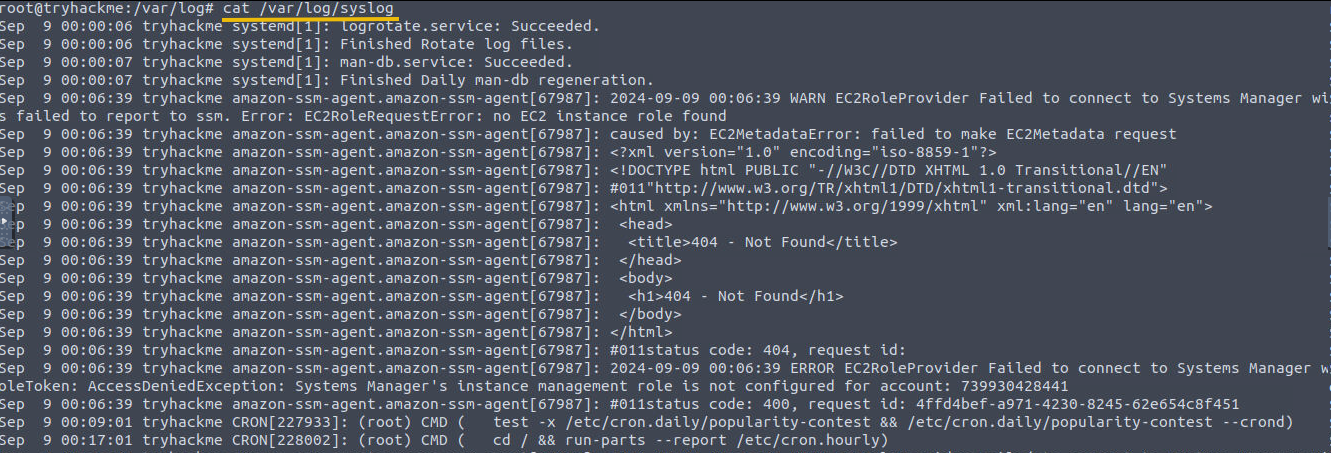
2) Evidence in the Logs
We can start to investigate this incident by looking at the /var/log/syslog file using the filter as shown below:
Command: cat /var/log/syslog | grep suspicious
3) Examining Journalctl
We can also look at the journalctl using the following command, as shown below:
Command: sudo journalctl -u suspicious
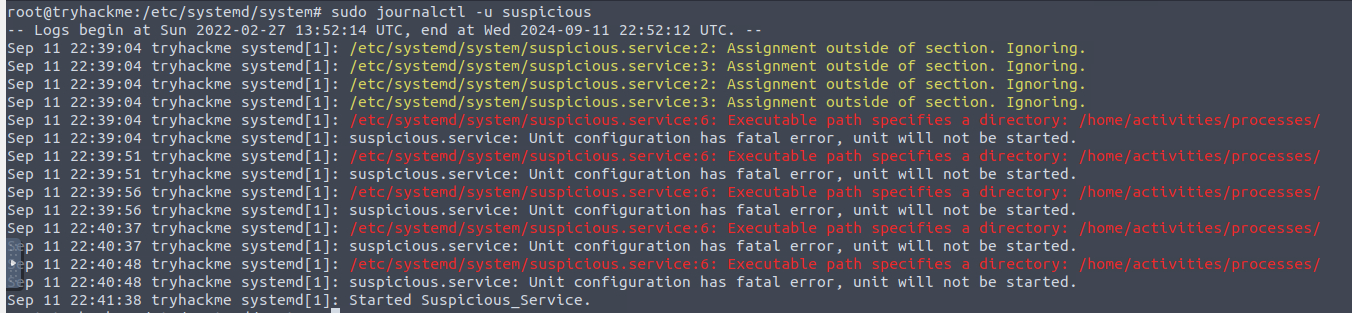
It is important to note that these investigations can also reveal the errors the adversary may have failed while trying to install the suspicious service.
What is the default path that contains all the installed services in Linux?
Which suspicious service was found to be running on the host?
What process does this service point to?
Before getting this service stopped on 11th Sept, how many log entries were observed in the journalctl against this service?
 Incident Surface on the disk refer to areas of the filesystem that attackers may target and where they could leave traces of their activities. From a forensics perspective, examining these areas can be crucial in understanding and investigating security incidents. Forensic analysts can identify the attack's traces that could aid the incident response by focusing on these potential incident surfaces.
and Directories
In the filesystem, some files or directories contain sensitive information and can keep track of any attack attempt. Some of the key places are explained below:
Configuration Files:
Some common configurations that could be of key importance from a security perspective are:
/etc/passwd: This file contains information about the user accounts.
/etc/shadow: This file contains hashed passwords for user accounts.
/etc/group: This file defines groups and the users associated with them. Groups are used to manage permissions and organize users with similar privileges.

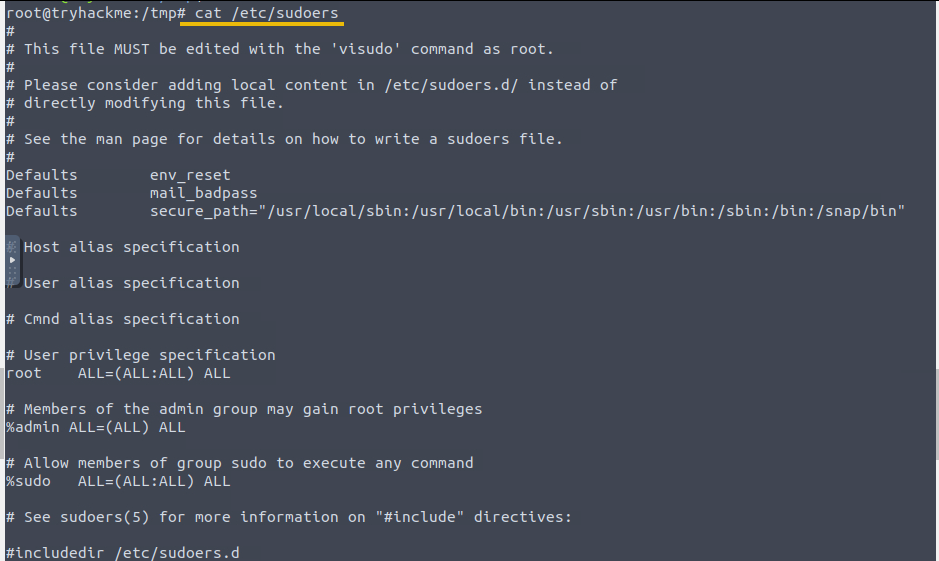
/etc/sudoers: Configures sudo permissions, which can be a target for privilege escalation.
Investigating Malicious Package
Attackers may create and install a malicious Debian package on the Linux system to achieve multiple goals, or the attacker could trick the user into installing a malicious package to achieve certain malicious goals. Let's pretend to be Alice, create a package, and install it into the system before starting to investigate.
To create the package, follow the steps mentioned below:
1) Create DirectoryRun the following command to create a directory for the package, as shown below.
           root@tryhackme:~# mkdir malicious-package
root@tryhackme:/malicious-package# mkdir DEBIAN
2) Create Control File
The next step is to create a control file containing information or metadata about the package we will build and install on this host. Open a file in any text editor within the DEBIAN folder and name it control. Add the content mentioned below to the file before saving it.
Package: malicious-package
Version: 1.0
Section: base
Priority: optional
Architecture: all
Maintainer: attacker@test.com
Description: This is a malicious Package
3) Add Malicious Script
Next, create a malicious script with the content below and save it as postinst and place it in the DEBIAN directory, as shown below:
#!/bin/bash
# Malicious post-installation script
# It will run this script after installation

# Print a suspicious message - for demonstration
echo "something suspicious"
4) Make the Script Executable
root@tryhackme:# chmod 755 malicious-package/DEBIAN/postinst
5) Build the Package
The following command is used to build the package, as shown below.
root@tryhackme:# dpkg-deb --build malicious-package
6) Install the Package
The following command will install the suspicious package on the disk.
root@tryhackme: dpkg -i malicious-package.deb
Investigate the Suspicious Installed Package
Now that we have installed the package let's investigate and see how we can identify its footprints on the disk.
1) Check the Installed Packages
The following command lists all the installed packages on the disk.
dpkg -l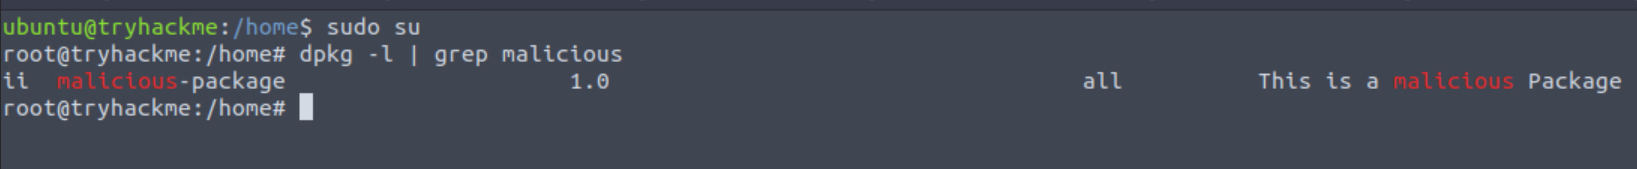
The command dpkg -l will display all the installed packages on the disk. We can examine all of them to identify the package that seems odd. In our case, as we knew the name of the installed package, we applied the filter, and the output confirmed that the package was indeed installed on the system.
2) Examining dpkg.log
We can also look at the dpkg.log file, as shown below.
           ubuntu@tryhackme:/home$ grep " install " /var/log/dpkg.log
2024-06-13 06:47:05 install linux-image-5.15.0-1063-aws:amd64 <none> 5.15.0-1063.69~20.04.1
2024-06-13 06:47:06 install linux-aws-5.15-headers-5.15.0-1063:all <none> 5.15.0-1063.69~20.04.1
2024-06-13 06:47:09 install linux-headers-5.15.0-1063-aws:amd64 <none> 5.15.0-1063.69~20.04.1
2024-06-24 19:17:39 install osquery:amd64 <none> 5.12.1-1.linux
2024-06-26 05:54:38 install sysstat:amd64 <none> 12.2.0-2ubuntu0.3
2024-06-26 14:32:05 install malicious-package:amd64 <none> 1.0
In this task, we explored a few surfaces of Incidents on the disk. As forensic investigators, we would look at various places to identify the footprints of multiple activities and narrow down on the ones that could be classified as an incident.
Now that we have covered some key places to find and investigate the incident's footprints or indicators, let's move on to the next step: Exploring how logs play a vital role in investigating incidents.
Create a suspicious Debian package on the disk by following the steps mentioned in the task. How many log entries are observed in the dpkg.log file associated with this installation activity?
What package was installed on the system on the 17th of September, 2024?
 Logs in every digital device play an important role in understanding what happened. Similarly, logs in are essential for monitoring and tracking system activities, detecting attacks, and identifying incident surfaces. The logs contain records of each event or activity on the system, which could be valuable when identifying and investigating security-related incidents.
In the earlier task, we examined auth.log to check the user creation-related logs.
Let's explore some common incidents to understand the importance of logs and how they can be examined for potential incident traits.
Important logs are covered below:
Syslog:
- Location:
/var/log/syslog - This is useful for identifying system-wide events, errors, and warnings. Can provide insights into issues with system components or services.
- It contains general system messages, including kernel messages, system services, and application logs.
- This log file is useful for identifying system-wide events, errors, and warnings.
- It can provide insights into issues with system components or services.
Messages:
- Location:
/var/log/messages - Similar to
syslog, this file includes system messages and kernel logs. - Useful for diagnosing system issues and tracking system activity.
- Finding unusual entries related to hardware or kernel errors might signal an attempt to tamper with system components.
- For example, repeated kernel panic messages could indicate a denial-of-service attack targeting system stability.
Authentication Logs:
- Location:
/var/log/auth.log - This file logs authentication attempts, including successful and failed login attempts.
- It's an important log file for detecting unauthorized access attempts and brute-force attacks.
- For example, finding multiple failed login attempts from an unfamiliar IP address or unusual login times might indicate a brute-force attack or an attempt to gain unauthorized access.
Some of the key examples of the events that can be classified as incidents are:
- Failed login attempts.
- Successful login attempt but at the odd time (After Office Hours or on weekends -> depending on the context of the company).
- Suspicious network communication.
- System errors.
- User account creation on the sensitive server.
- Outbound traffic is initiated from the web server.
Investigating logs is covered in detail in the Logs Investigation room.
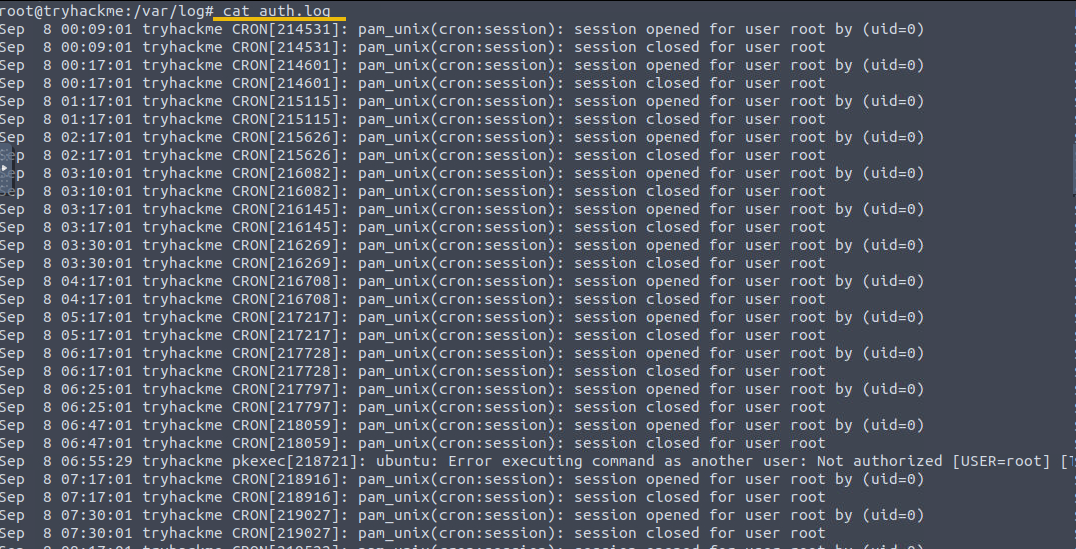
Examine the auth.log files. Which user attempted to connect with SSH on 11th Sept 2024?
From which IP was this failed SSH connection attempt made?
That's it!
In this room, we briefly touched on what the Attack Surfaces and Incident Surfaces are, before diving deep into various incident surface points in Environment. Some of the key areas to find the incident-related footprints that we explore are:
- Running Processes
- Installed Packages
- Running Services
- Network Communication
- Methods
It is time to look at the following rooms in the Endpoint Analysis Module that cover these incident surfaces in more depth:
Happy Learning!!
Click to complete the room.
Ready to learn Cyber Security?
TryHackMe provides free online cyber security training to secure jobs & upskill through a fun, interactive learning environment.
Already have an account? Log in