
Network Security Essentials
Learn about key aspects of network security essentials and how to monitor and protect against adversaries.
easy

To access material, start machines and answer questions login.
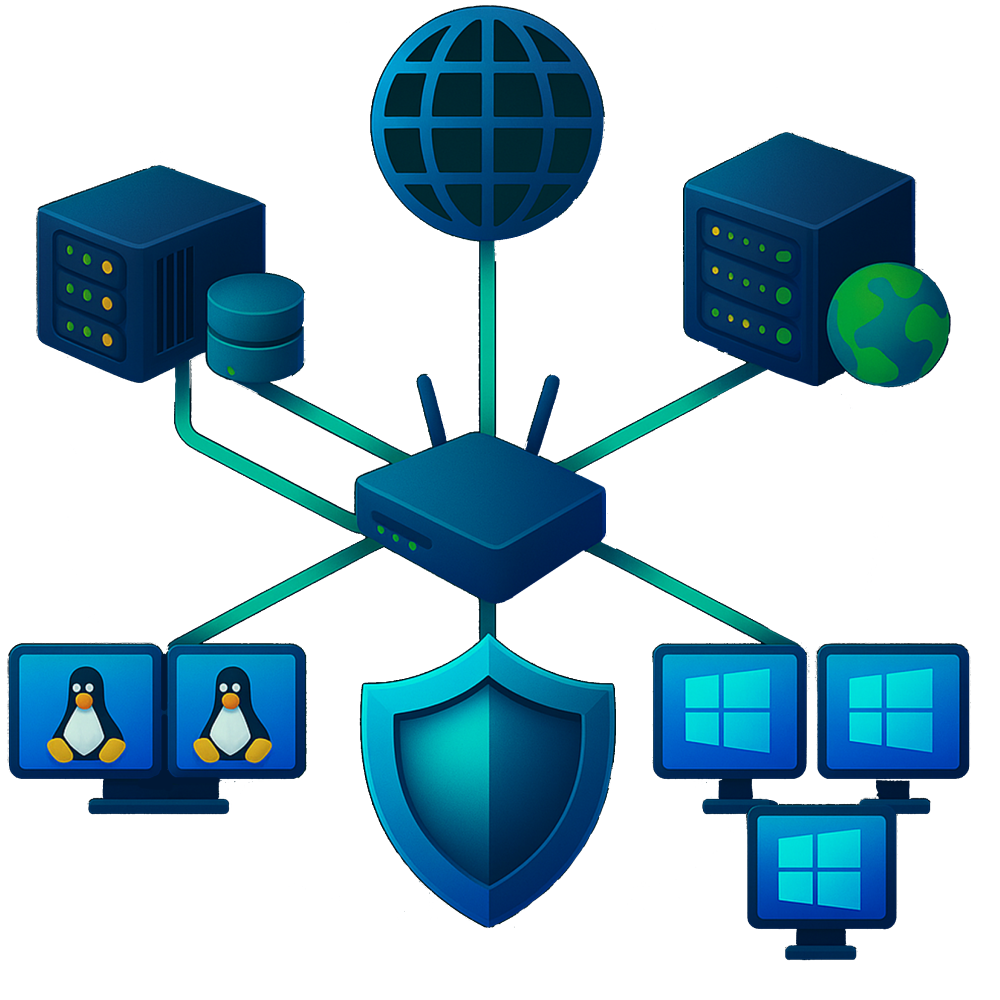
The networks are the backbone of every modern organization. Servers, workstations, applications, and security devices don’t exist in isolation; they are interconnected, forming a single ecosystem. The network perimeter is where this internal ecosystem is segregated from the external Internet, and it is often the first target for attackers.
This room is designed to introduce you to the fundamental concepts of network security from a defensive perspective. While our focus will be on the logs and data sources we encounter daily, we'll start by building a strong understanding of how networks are structured, why they are important to protect, and why monitoring the perimeter is critical for early attack detection.

Learning Objectives
In this room, we will cover the following learning objectives:
- Understand what a network is and identify its key components.
- Explore the concept of the network perimeter and its importance.
- Identify the key perimeter threats.
- Examine the logs to monitor normal and suspicious logs.
Prerequisites
This room expects the users to have covered the following rooms and know the basic networking concepts.
Let's begin our learning journey.
Complete the task.
Set up your virtual environment

Before moving forward, start the lab by clicking the Start Lab Machine button. It will take 3 minutes to load properly. The VM will be accessible on the right side of the split screen. If the VM is not visible, use the blue Show Split View button at the top of the page.

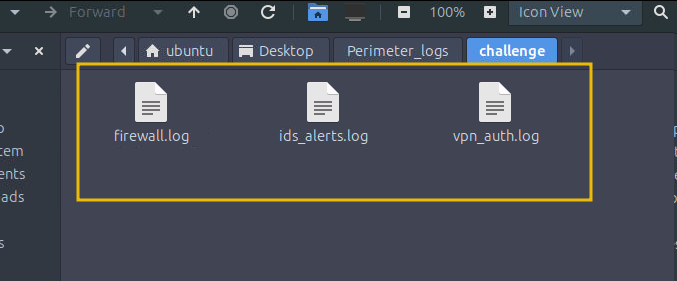
All files required to complete the room are placed in the Perimeter_logs folder on the Desktop. The log files to be used in the task 7 for the investigation are pre-ingested into Splunk Instance, which can be accessed from within the Machine at MACHINE_IP:8000.
Connect to the Lab.
Before understanding the security aspect of a Network, it is important to understand what a network is, what components or assets form it, and how they work.
Network Components - Building Blocks of a Network
A computer network is not just a random collection of devices; it is an organized structure where network assets connect to enable communication, resource sharing, and connectivity with each other and the world.
Small Enterprise Network
From a security perspective, knowing what these devices do and why they’re important helps quickly identify suspicious activity. Let's take an example of a small enterprise network, and understand its key components, usage, and their importance from a security perspective:
User Workstations (Endpoints)
Employees do their daily work at workstations (PCs, laptops). However, they are also the most common entry point for attackers, often via emails or malicious downloads.
- Example: A email drops malware on a finance user’s PC.
- Why it matters: Endpoints are often less monitored, but a compromise here can give attackers a foothold to move laterally.
Importance
Endpoint logs can reveal malicious processes, but network logs may first show (Command & Control) connections.
File & Database Servers
These servers store the business's most important asset, its data. File servers provide centralized access to shared documents, while database servers manage structured data like customer records, HR information, or financial data.
Importance
Attackers usually target these servers because compromising them means access to valuable or sensitive data. Ransomware operators, in particular, target file servers to maximize their impact. Data exfiltration campaigns often involve stealthily moving data from these servers out of the network.
Application Servers (Web, Email, , etc.)
These servers provide services that employees and customers rely on daily.
- Web Servers: Host company websites and web applications.
- Email Servers: Handle corporate communications.
- Gateways: Allow secure remote access to internal resources.
Importance
Because they are externally facing, application servers are high-value targets. Attackers scan them constantly for software vulnerabilities or weak configurations. Exploiting one often provides a foothold into the internal network.
From a security perspective, we need to monitor application logs, alerts, and signatures to identify:
- Exploit attempts (e.g., injection on a web app).
- Brute-force login attempts on email or services.
- Suspicious external interacting with sensitive applications.
Active Directory () / Authentication Servers
Active Directory is the identity backbone of most enterprise networks. It manages users, groups, computers, and their access rights. Employees use their credentials to log into their computers, access email, file servers, and internal applications.
Importance
- is the main component that controls all user accounts and systems within the network.
- Attackers commonly target for privilege escalation, , and lateral movement.
- A single compromised domain admin account can bring down the entire enterprise.
From a security perspective, we need to monitor authentication logs for suspicious behavior such as:
- Multiple failed login attempts (password spraying).
- Unusual logins from external or at odd hours.
- Accounts accessing systems they normally shouldn’t.
Routers & Switches (Network Infrastructure)
Routers connect different networks, most importantly linking the enterprise LAN to the Internet. Switches connect devices within the same network, ensuring employees’ PCs, printers, and servers communicate seamlessly. These devices are the circulatory system of the enterprise.
Importance
While routers and switches are not directly exposed in most enterprise setups, if compromised, they provide attackers with the ability to:
- Intercept and manipulate traffic (Man-in-the-Middle attacks).
- Create backdoors by rerouting traffic.
- Open hidden channels to the Internet.
Firewalls / Perimeter Devices
A is the primary security gateway that controls traffic between the trusted internal network and the untrusted Internet. It inspects incoming and outgoing packets and decides whether to allow or block them based on defined security rules. Modern firewalls also perform deep inspection of applications, intrusion prevention, and even malware detection.
Importance:
- Protects the enterprise from direct exposure to the Internet.
- Prevents unauthorized access to internal services (e.g., database or ).
- Logs every connection attempt, successful or blocked. These logs are often the earliest indicators of attacks such as port scans, brute-force attempts, or exploitation attempts.
Now that we understand what a network is, what components connect to form it, and their usage and importance, let's move to the next task and explore the key network perimeters.
Continue to the Next task.
Network visibility is essential in cyber security. It's the ability to monitor and understand what's happening across your network. It's a core principle for security analysts: you can't defend what you can't see. Effective visibility enables threat detection, incident investigation, and a strong security posture. It’s not about tracking every packet but having the tools to build a clear picture. Without it, you're blind to potential threats.
The network visibility comes from two primary sources of logs. You must understand the difference between them to piece together an attack timeline effectively.
Why is Visibility Crucial? (Expand to read)
Imagine trying to secure a house with no windows or security cameras. We wouldn't know if someone was trying to break in until it was too late. Network visibility provides the "eyes" for our digital environment. Without it, malicious activities like malware infections, unauthorized access, and data exfiltration can go completely unnoticed. Effective visibility allows security analysts to:
|
To achieve this, we mostly rely on the logs, which are the records of events that occur within the network and on individual devices. Let's break down the two main categories of log sources.
Host-Centric Logs

Host-centric logs are generated by individual devices (hosts) on the network, such as servers, workstations, and laptops. These logs give us a detailed, ground-level view of what's happening on a specific machine. They are essential for understanding the direct impact of an attack on a system.
Key Host-Centric Log Sources
- Operating System Logs: Windows Event Logs,
syslog, macOS logs. These record events like user logons, process creation, service startups, and failed login attempts. - Application Logs: Logs from software running on the host, such as web servers (, Nginx), databases (MySQL, MSSQL), and other applications.
- Security Tool Logs: Logs from antivirus software, Endpoint Detection and Response () agents, and host-based intrusion detection systems ().
Importance of Host-Centric Logs (Expand to read)These logs are invaluable for answering questions like:
|
Network-Centric Logs

While host logs tell us what's happening on a device, network-centric logs tell us what's happening between devices. These are generated by network appliances that sit on the network and monitor the traffic flowing through them.
- What they show: Source and destination , ports, protocols, and the action taken (e.g, allowed or blocked).
- Why they are important: They give you the crucial "when," "where," and "how." They can reveal an attacker's initial reconnaissance attempts, lateral movement between systems, or attempts to exfiltrate data.
To get a complete picture, you need to correlate both. Think of it this way: Host-centric logs tell you what happened inside a room, while network-centric logs tell you who entered and left the building.
Key Network-Centric Log Sources
- Firewalls: The logs provide a record of every connection allowed or denied based on pre-defined security rules. logs are the first place to look for unauthorized connection attempts from the internet.
- Intrusion Detection/Prevention Systems (/): They monitor network traffic for patterns that match known malicious attacks (signatures) or for unusual behavior (anomalies). Their logs are critical for detecting active attacks in real time.
- Routers and Switches: While not logging in the traditional sense, devices like routers can generate flow data. This data summarizes traffic conversations, telling who talked to whom, for how long, and how much data was sent. It’s excellent for getting a high-level overview of network activity.
- Web Proxies: These logs are a goldmine for organizations that route their web traffic through proxies. They record every website user's visit, providing visibility into web-based threats, policy violations, or data exfiltration attempts.
- : These devices manage remote access for employees. Their logs track who is connecting to the corporate network, from where, and at what time, which is essential for monitoring the security of remote connections.
Importance of Network-Centric Logs (Expand to read)Importance of Network-Centric Logs Network-centric logs offer a high-level, "bird's-eye view" of traffic moving between devices and across the network perimeter. They are essential for:
|
Effective security monitoring relies on examining both host and network logs. This combined approach empowers analysts to assemble a thorough and accurate timeline of any security incident.
In this task, we have explored the network visibility, which is the key concept of network security. In the next task, we will explore network perimeters and how they help us monitor and protect the network.
Continue to the next task.
The network perimeter is the boundary that separates an organization's internal network (trusted zone, like employees, servers, business applications) from the external Internet (untrusted zone). It’s the point where data enters or leaves the network. Think of it as the main gate or front door of a secure building. All traffic coming from the Internet must pass through this point to enter your network, and all internal traffic must pass through it to exit the Internet. The network perimeter is your first and most critical line of defense.
- The internal network is where business-critical systems live.
- The external Internet is full of potential threats.
- The perimeter is the controlled entry point through which all traffic passes.
Understanding the perimeter, its existence, and how it can be defended is critical for a security analyst.
The Perimeter
The perimeter is defined by hardware devices at the edge of the network. However, it also includes virtual gateways, cloud connections, and remote access points in modern environments.
Common components of a network perimeter include:
- Firewalls: Gatekeepers that filter traffic between internal and external networks.
- Routers/Gateways: Devices that route traffic and enforce access rules.
- Demilitarized Zone (): A buffer network segment where public-facing servers (web, mail, ) are placed.
- Remote Access Gateways / VPNs: Secure entry points for employees working outside the office.
Importance of Network Perimeter
The network perimeter acts as a gatekeeper, controlling what goes in and out of the network. It is not a single device but rather a collection of security controls and network components working together to protect internal assets from external threats. These components serve distinct roles in managing, filtering, and securing data flow between internal and external networks.
Attackers always start probing from the outside. The perimeter is usually the first line of defense and often the first place analysts will see signs of malicious activity.
If the perimeter is weak or misconfigured, attackers can:
- Exploit exposed services (e.g., , MySQL, ) to gain access.
- Perform scanning and reconnaissance to map the network.
- Launch brute-force attacks against login services.
- Use data exfiltration channels to send stolen data out.
Network Perimeter in a Small Enterprise

Imagine a small business network:
- A sits between the Internet and the internal LAN.
- A web server is placed in a so customers can access the website.
- Internal servers (, file, and database) live behind the and are accessible only to employees.
- Employees outside the office connect through a gateway.
This setup ensures that only controlled traffic reaches the internal network, while public services remain isolated in a safer zone.
Commonly includes:
- Routers: Direct network traffic.
- Firewalls: Inspect and filter traffic.
- (Demilitarized Zone): Hosts public-facing services.
- Gateways: Secure remote access.
Why does it matter
The perimeter is the first line of defense against external threats. Attackers scan perimeter looking for open ports and vulnerabilities. Misconfigured or weakly protected perimeters often lead to:
- Unauthorized access (e.g., exposed /)
- Data breaches
- Malware infiltration
Role of a Security Analyst
As a security analyst, monitoring the perimeter means:
- Reviewing logs for blocked/allowed connections.
- Identifying scanning attempts or brute-force login attempts.
- Flagging unusual outbound traffic that may indicate malware beaconing or exfiltration.
- Understanding what should (and should not) be exposed at the perimeter.
Continue to the next task.
In the previous task, we discussed the network perimeter, its importance, and how it functions as the boundary between trusted internal systems and the external Internet. Attackers constantly probe this boundary, looking for weak spots. Let's explore various scenarios and how to monitor different network perimeters to identify threats and protect against them.
Monitoring the perimeter
Monitoring the perimeter means using firewalls, intrusion detection/prevention systems (/), and access control to examine and limit exposure and enforce security rules. This allows the security analysts to:
- Spot early-stage attacks like port scans or brute-force attempts.
- Detect misconfigurations that leave sensitive services exposed.
- Identify outbound traffic anomalies that may indicate malware or data exfiltration.
The perimeter logs used in the following scenarios can be found at /Perimeter_logs/task6/ folder on the Desktop.
Monitoring the Perimeter in Action
Below are some scenarios to demonstrate the importance of monitoring the perimeters.
Scenario 1: Probing for Ports (Port Scanning)
An attacker is testing your network to see which ports are open or closed, while the firewall is doing its job and blocking them.
Firewall Log
2025-09-22 08:30:04 ALLOW TCP 198.51.100.45:49876 -> 10.0.0.51:80
2025-09-22 08:30:05 BLOCK TCP 203.0.113.10:50001 -> 10.0.0.20:21
2025-09-22 08:30:06 BLOCK TCP 203.0.113.10:50002 -> 10.0.0.20:22
2025-09-22 08:30:07 ALLOW TCP 192.0.2.115:51235 -> 10.0.0.50:443
2025-09-22 08:30:08 BLOCK TCP 203.0.113.10:50003 -> 10.0.0.20:23
2025-09-22 08:30:09 BLOCK TCP 203.0.113.10:50004 -> 10.0.0.20:25
2025-09-22 08:30:10 ALLOW TCP 198.51.100.92:51111 -> 10.0.0.50:443
2025-09-22 08:30:11 BLOCK TCP 203.0.113.10:50005 -> 10.0.0.20:53
Log Breakdown
- The same external IP (203.0.113.10) is trying to connect to multiple ports on the same internal machine quickly.
- Analyst's Verdict: This is a classic port scan. The attacker is looking for an open service to target.
Scenario 2: Attacking the Web Server (SQL Injection)
The company website is being attacked. An intrusion detection system (IDS) provides more details than a , identifying the type of attack.
WAF (Web Application ) Logs
timestamp=2025-09-22T09:14:44Z src_ip=192.0.2.130 action=ALLOW request="GET /index.html"
timestamp=2025-09-22T09:14:45Z src_ip=198.51.100.92 action=ALLOW request="GET /products.php?id=9"
timestamp=2025-09-22T09:14:46Z src_ip=[REDACTED] action=BLOCK request="GET /search.php?q=<script>alert('XSS')</script>" rule_id=941100 attack_type="XSS"
timestamp=2025-09-22T09:14:47Z src_ip=192.0.2.140 action=ALLOW request="GET /css/style.css"
timestamp=2025-09-22T09:15:42Z src_ip=[REDACTED] action=BLOCK request="GET /../../../../etc/passwd" rule_id=930120 attack_type="Directory Traversal"
...
.....
Log Breakdown
- This log shows a mix of ALLOW and BLOCK actions. An analyst can filter for action=BLOCK to immediately find threats. The WAF does the hard work by blocking the request and telling us why.
- The attack_type=" Injection" alert shows the attacker trying to dump database information.
- The attack_type="" alert is an attempt to inject malicious scripts.
- The attack_type="Directory Traversal" alert shows an attempt to read sensitive server files.
- Analyst's Verdict: The WAF successfully identifies and blocks multiple web attack types from suspicious IP. This is a high-confidence alert that an attacker is actively targeting the website.
Scenario 3: Guessing the Password (VPN Brute-Force)
An attacker is trying to guess a user's password to gain remote access to the network. This creates a lot of noise in the authentication logs.
VPN Gateway Log
2025-09-22 10:12:11 FAILED_AUTH TCP [REDACTED]:31245 -> 10.0.0.1:443 (user 'admin')
2025-09-22 10:12:15 FAILED_AUTH TCP [REDACTED]:31248 -> 10.0.0.1:443 (user 'admin')
2025-09-22 10:12:21 SUCCESS_AUTH TCP 198.51.100.88:41233 -> 10.0.0.1:443 (user 'b.jones')
2025-09-22 10:12:08 FAILED_AUTH TCP [REDACTED]:31249 -> 10.0.0.1:443 (user 'guest')
2025-09-22 10:12:09 FAILED_AUTH TCP [REDACTED]:31250 -> 10.0.0.1:443 (user 'user')
Log Breakdown
- The log is flooded with FAILED_AUTH and SUCCESS_AUTH events.
- A few successful logins from various are normal.
- The problem is the massive volume of failures.
- To find the attack, an analyst would filter or group the logs by source IP.
- Doing so would immediately reveal that a suspicious user is responsible for hundreds of failed login attempts in a very short period.
- Analyst's Verdict: One suspicious IP is observed conducting a brute-force attack against the gateway. The attacker is attempting to use a list of common usernames ('admin', 'root', 'test', etc.) to find a valid account to compromise. The scattered successful logins are benign traffic from legitimate employees.
Key Takeaways
- An analyst's job is to separate normal traffic from suspicious activity.
- Look for suspicious patterns.
- Repetition from one source to many destinations = Scanning.
- Repetition from one source to one destination = Brute-forcing.
- Traffic at perfect, regular intervals = Malware beaconing.
- Context is key. An alert telling you why something was flagged is more valuable than a simple block.
- Monitoring the network perimeter is the first step in detecting attacks.
Examine the firewall logs. Which IP address is performing the port scan?
In the WAF Logs, which single source IP is responsible for all the blocked web attacks?
In the VPN logs, how many brute-force attempts failed?
Which suspicious IP address was found attempting the brute-force attack against the VPN gateway?
Incident Scenario
Initech Corp, a mid-sized financial services company, has recently deployed a new and intrusion detection system () to monitor its network perimeter. Over the past month, security analysts have noticed abnormal traffic patterns, but the team has been overwhelmed and missed deeper analysis.
As a new security analyst, you have been tasked with reviewing one month of perimeter logs to determine what techniques the adversary used, and whether they succeeded in breaching the perimeter.
You have been given three sets of logs from the time of the incident. The logs can be found in the Perimeter_logs/challenge directory on the Desktop.
- Firewall Logs:
firewall.log - WAF Logs:
ids_alerts.log - VPN Logs:
vpn_auth.log
Network Assets (Expand to read)The Network of Initech Corp contains the following assets. We can use that as a reference.
|
Investigating the Logs
There are two ways to investigate the logs: manually using command-line tools or using Splunk. Instructions on how to access the Splunk instance are mentioned at the end.
Method 1: Manual Log Analysis
Let's start by exploring the logs, as shown below:
Commandline: head firewall.log
ubuntu@tryhackme:~/Desktop/Perimeter_logs/challenge$ head firewall.log
2025-08-25 00:47:46 ALLOW TCP [REDACTED]:60317 -> 10.0.0.50:443
2025-08-25 01:29:33 ALLOW TCP 203.0.113.100:62718 -> [REDACTED]:443
2025-08-25 01:42:12 ALLOW TCP 203.0.113.100:55875 -> [REDACTED]:80
2025-08-25 03:30:47 ALLOW TCP [REDACTED]:63035 -> [REDACTED]:80
2025-08-25 04:06:58 ALLOW TCP 192.0.2.115:65458 -> [REDACTED]:25
2025-08-25 05:51:36 ALLOW TCP 203.0.113.100:56035 -> [REDACTED]:53
2025-08-25 06:09:50 ALLOW TCP 198.51.100.92:63418 -> [REDACTED]:8080
2025-08-25 07:39:29 ALLOW TCP [REDACTED]:55955 -> [REDACTED]:8080
2025-08-25 08:24:34 ALLOW TCP 198.51.100.92:63475 -> [REDACTED]:8080
2025-08-25 08:57:21 ALLOW TCP 198.51.100.92:58636 -> 10.0.0.50:53
Explore ids logs, as shown below:
Commandline: head ids_alerts.log
ubuntu@tryhackme:~/Desktop/Perimeter_logs/challenge$ head ids_alerts.log
2025-08-25 00:12:53 [**] [1:2003272:1] ET POLICY Suspicious HTTP [**] [Classification: Suspicious Activity] [Priority: 3] {TCP} 198.51.100.92:20127 -> [REDACTED]:22
2025-08-25 01:50:30 [**] [1:2003377:1] ET POLICY Suspicious HTTP [**] [Classification: Suspicious Activity] [Priority: 1] {TCP} 203.0.113.100:56603 -> [REDACTED]:25
2025-08-25 02:16:39 [**] [1:2003437:1] ET INFO Possible Benign Scan [**] [Classification: Suspicious Activity] [Priority: 3] {TCP} [REDACTED]:62546 -> [REDACTED]:21
2025-08-25 02:23:07 [**] [1:2003344:1] ET WEB_SERVER Possible SQL Injection [**] [Classification: Suspicious Activity] [Priority: 2] {TCP} 198.51.100.45:12396 -> [REDACTED]:22
2025-08-25 02:25:48 [**] [1:2003445:1] ET POLICY Suspicious HTTP [**] [Classification: Suspicious Activity] [Priority: 3] {TCP} 192.0.2.115:3952 -> [REDACTED]:22
2025-08-25 03:35:00 [**] [1:2003160:1] ET INFO Possible Benign Scan [**] [Classification: Suspicious Activity] [Priority: 1] {TCP} [REDACTED]:38760 -> [REDACTED]:443
2025-08-25 05:02:36 [**] [1:2003187:1] ET WEB_SERVER Possible SQL Injection [**] [Classification: Suspicious Activity] [Priority: 1] {TCP} 198.51.100.92:46776 -> [REDACTED]:3389
2025-08-25 06:04:26 [**] [1:2003179:1] ET INFO Possible Benign Scan [**] [Classification: Suspicious Activity] [Priority: 2] {TCP} 198.51.100.92:20632 -> 10.0.0.50:8080
2025-08-25 14:12:11 [**] [1:2003500:1] ET INFO Possible Benign Scan [**] [Classification: Suspicious Activity] [Priority: 2] {TCP} 192.0.2.115:30225 -> [REDACTED]:445
2025-08-25 15:30:03 [**] [1:2003354:1] ET POLICY Suspicious HTTP [**] [Classification: Suspicious Activity] [Priority: 3] {TCP} 203.0.113.100:27572 -> [REDACTED]:4444
Examine VPN Logs, as shown below:
Commandline: head vpn_auth.log
ubuntu@tryhackme:~/Desktop/Perimeter_logs/challenge$  head vpn_auth.log
2025-08-25 08:25:10 [REDACTED] alice SUCCESS assigned_ip=10.8.0.143
2025-08-25 08:27:38 203.0.113.100 svc_[REDACTED] SUCCESS assigned_ip=10.8.0.131
2025-08-25 14:57:10 203.0.113.10 svc_[REDACTED] SUCCESS assigned_ip=10.8.0.116
2025-08-25 23:04:53 203.0.113.10 jsmith SUCCESS assigned_ip=10.8.0.31
2025-08-26 03:36:17 198.51.100.92 svc_[REDACTED] SUCCESS assigned_ip=10.8.0.62
2025-08-26 08:55:14 [REDACTED] bob SUCCESS assigned_ip=10.8.0.126
2025-08-26 10:02:45 198.51.100.92 svc_[REDACTED] SUCCESS assigned_ip=10.8.0.81
2025-08-27 03:11:33 198.51.100.45 bob SUCCESS assigned_ip=10.8.0.163
2025-08-28 02:52:16 192.0.2.115 alice SUCCESS assigned_ip=10.8.0.132
2025-08-28 03:20:33 [REDACTED] svc_[REDACTED] SUCCESS assigned_ip=10.8.0.193
Reconnaissance attempt
Let's begin our analysis by analyzing the blocked requests in the firewall logs, as shown below:
Commandline: cat firewall.log | grep "BLOCK" | head
ubuntu@tryhackme:~/Desktop/Perimeter_logs/challenge$ cat firewall.log | grep "BLOCK" | head
2025-08-26 12:12:47 BLOCK TCP 203.0.113.10:64292 -> 10.0.0.50:21
2025-08-27 03:18:28 BLOCK TCP [REDACTED]:61701 -> [REDACTED]:23
2025-08-27 11:56:20 BLOCK TCP 203.0.113.10:64952 -> 10.0.0.50:22
2025-08-27 22:52:00 BLOCK TCP 203.0.113.10:63686 -> [REDACTED]:445
2025-08-28 10:00:00 BLOCK TCP [REDACTED]:50000 -> [REDACTED]:4444
2025-08-28 10:02:30 BLOCK TCP [REDACTED]:50005 -> [REDACTED]:22
Examining the blocked requests indicates that an external IP has been found probing against internal IPs using various ports (22,23,21,445,3389).
Let's use the following filtering to understand which IP is responsible for the maximum BLOCK requests.
Commandline: cat firewall.log | grep "BLOCK" | cut -d' ' -f5 | cut -d: -f1 | sort -nr | uniq -c
ubuntu@tryhackme:~/Desktop/Perimeter_logs/challenge$ cat firewall.log | grep "BLOCK" | cut -d' ' -f5 | cut -d: -f1 | sort -nr | uniq -c
279 [REDACTED]
46 203.0.113.10
26 [REDACTED]
We have identified a suspicious IP, which we can use to pivot, examine other log files, and understand the correlation.
Let's use the following query to find if our has allowed any requests to the suspicious IP, as shown below:
Commandline: cat firewall.log | grep [REDACTED] | grep "ALLOW"
ubuntu@tryhackme:~/Desktop/Perimeter_logs/challenge$ cat firewall.log | grep [REDACTED] | grep "ALLOW"
2025-08-26 00:17:58 ALLOW TCP [REDACTED]:61009 -> [REDACTED]:4444
2025-08-26 22:04:34 ALLOW TCP [REDACTED]:55996 -> 10.0.0.50:445
2025-08-27 21:04:23 ALLOW TCP [REDACTED]:53944 -> 10.0.0.50:22
2025-08-28 15:50:50 ALLOW TCP [REDACTED]:56123 -> [REDACTED]:3389
2025-08-30 20:26:23 ALLOW TCP [REDACTED]:61685 -> [REDACTED]:4444
2025-09-02 09:25:06 ALLOW TCP [REDACTED]:50550 -> 10.0.0.50:22
-----
------
2025-09-22 15:46:02 ALLOW TCP [REDACTED]:59771 -> [REDACTED]:23
2025-09-22 17:22:11 ALLOW TCP [REDACTED]:49360 -> 10.0.0.50:22
It seems that the attacker was able to gain access to the internal network through exploitation. Let's examine the VPN logs and see if we can find further footprints of the attack.
VPN Brute-force / Credential Access
In the VPN Logs, let's first examine the number of failed attempts, using the following command, as shown below:
Commandline: cat vpn_auth.log | grep FAIL | cut -d' ' -f3 | sort -nr | uniq -c
ubuntu@tryhackme:~/Desktop/Perimeter_logs/challenge$ cat vpn_auth.log | grep FAIL | cut -d' ' -f3 | sort -nr | uniq -c
118 [REDACTED]
1 203.0.113.100
1 198.51.100.92
1 198.51.100.45
We can clearly see that the suspicious IP has multiple failed VPN login attempts. Let's now use the following command to narrow down on the suspicious IP, as shown below:
Commandline: cat vpn_auth.log | grep [REDACTED]
ubuntu@tryhackme:~/Desktop/Perimeter_logs/challenge$ cat vpn_auth.log | grep [REDACTED]
2025-09-03 02:19:00 [REDACTED] svc_[REDACTED] FAIL
2025-09-03 02:19:10 [REDACTED] svc_[REDACTED] FAIL
2025-09-03 02:19:20 [REDACTED] svc_[REDACTED] FAIL
2025-09-03 02:19:30 [REDACTED] svc_[REDACTED] FAIL
--------
-----------
2025-09-03 02:19:40 [REDACTED] svc_[REDACTED] SUCCESS assigned_ip=[REDACTED]
2025-09-03 02:19:50 [REDACTED] svc_[REDACTED] SUCCESS assigned_ip=[REDACTED]
2025-09-04 16:45:24 [REDACTED] svc_[REDACTED] SUCCESS assigned_ip=10.8.0.181
2025-09-05 13:21:52 [REDACTED] jsmith SUCCESS assigned_ip=10.8.0.94
2025-09-09 17:54:00 [REDACTED] jsmith SUCCESS assigned_ip=10.8.0.187
2025-09-09 19:15:51 [REDACTED] jsmith SUCCESS assigned_ip=10.8.0.134
2025-09-10 12:24:20 [REDACTED] bob SUCCESS assigned_ip=10.8.0.39
Above result shows, that, the multiple login attempt was made against a certain user svc_REDACTED, followed by a success login, resulting in the attacker being assigned a local IP address. We will pick the first assigned IP and extend our analysis to look for traces in the log files.
Lateral Movement
By now, it is confirmed that, that attacker has successfully gained the initial access and got hold on to an internal IP address. Let's filter through the firewall logs and see if we can find the footprints of any lateral movement from the compromised host IP REDACTED.
Commandline: cat firewall.log | grep [REDACTED] | grep "ALLOW" | head
ubuntu@tryhackme:~/Desktop/Perimeter_logs/challenge$ cat firewall.log | grep [REDACTED] | grep "ALLOW" | head
2025-09-05 06:00:00 ALLOW TCP [REDACTED]:2000 -> [REDACTED]:22
2025-09-05 06:10:00 ALLOW TCP [REDACTED]:2001 -> [REDACTED]:445
2025-09-05 06:20:00 ALLOW TCP [REDACTED]:2002 -> [REDACTED]:22
2025-09-05 06:40:00 ALLOW TCP [REDACTED]:2004 -> [REDACTED]:3389
2025-09-05 07:30:00 ALLOW TCP [REDACTED]:2009 -> [REDACTED]:22
2025-09-05 08:00:00 ALLOW TCP [REDACTED]:2012 -> [REDACTED]:22
It is observed that, the compromised IP is probing internal machines 10.0.0.20, 10.0.0.51, 10.0.0.60 on various ports on three main ports SMB/RDP/SSH (445/3389/22).
Let's now pivot to ids_alerts logs, and filter through the compromised IP and see if we can find any intrusion rules triggered, as shown below:
Commandline: cat ids_alerts.log | grep [REDACTED] | head
ubuntu@tryhackme:~/Desktop/Perimeter_logs/challenge$ cat ids_alerts.log | grep [REDACTED] | head
2025-09-05 06:00:00 [**] [1:2000200:1] ET SCAN Possible SSH Scan [**] [Classification: Attempted Unauthorized Access] [Priority: 1] {TCP} [REDACTED]:2000 -> [REDACTED]:22
2025-09-05 06:10:00 [**] [1:2000201:1] ET EXPLOIT Possible MS-SMB Lateral Movement [**] [Classification: Attempted Unauthorized Access] [Priority: 1] {TCP} [REDACTED]:2001 -> [REDACTED]:445
2025-09-05 06:20:00 [**] [1:2000202:1] ET SCAN Possible SSH Scan [**] [Classification: Attempted Unauthorized Access] [Priority: 1] {TCP} [REDACTED]:2002 -> [REDACTED]:22
2025-09-05 06:30:00 [**] [1:2000203:1] ET EXPLOIT Possible RDP Brute Force [**] [Classification: Attempted Unauthorized Access] [Priority: 1] {TCP} [REDACTED]:2003 -> [REDACTED]:3389
2025-09-05 07:10:00 [**] [1:2000207:1] ET SCAN Possible SSH Scan [**] [Classification: Attempted Unauthorized Access] [Priority: 1] {TCP} [REDACTED]:2007 -> [REDACTED]:22
2025-09-05 07:20:00 [**] [1:2000208:1] ET EXPLOIT Possible RDP Brute Force [**] [Classification: Attempted Unauthorized Access] [Priority: 1] {TCP} [REDACTED]:2008 -> [REDACTED]:3389
2025-09-05 07:30:00 [**] [1:2000209:1] ET SCAN Possible SSH Scan [**] [Classification: Attempted Unauthorized Access] [Priority: 1] {TCP} [REDACTED]:2009 -> [REDACTED]:22
It seems, the compromised host is trying to exploit various vulnerabilities against the services mentioned above on those hosts. One of the IDS alerts indicates exploit, which look interesting. Let's narrow down our search by using the following search query:
Commandline: cat ids_alerts.log | grep -n [REDACTED] | grep 'SMB' | cut -d' ' -f6,7,8,9,10,19,21 | head
ubuntu@tryhackme:~/Desktop/Perimeter_logs/challenge$ cat ids_alerts.log | grep -n [REDACTED] | grep 'SMB' | cut -d' ' -f6,7,8,9,10,19,21 | head
EXPLOIT Possible MS-SMB Lateral Movement [REDACTED]:2001 [REDACTED]:445
EXPLOIT Possible MS-SMB Lateral Movement [REDACTED]:2006 [REDACTED]:445
EXPLOIT Possible MS-SMB Lateral Movement [REDACTED]:2010 [REDACTED]:445
EXPLOIT Possible MS-SMB Lateral Movement [REDACTED]:2016 [REDACTED]:445
EXPLOIT Possible MS-SMB Lateral Movement [REDACTED]:2033 [REDACTED]:445
EXPLOIT Possible MS-SMB Lateral Movement [REDACTED]:2035 [REDACTED]:445
Above results confirm that, the compromised host was able to exploit service and was able to achieve lateral movement.
C2 Beaconing
Now that, we have an evidence of the lateral movement of the attacker. Let's hunt for any indicator of C2 communication. If we look at the IDS alerts, we can find a specific alert related to C2 Beaconing, indicating possible C2 communication. Let's use the following search query to see the results:
Commandline: cat ids_alerts.log | grep C2 | head
ubuntu@tryhackme:~/Desktop/Perimeter_logs/challenge$ cat ids_alerts.log | grep C2 | head
2025-09-11 01:00:00 [**] [1:2001000:1] ET TROJAN Possible C2 Beaconing [**] [Classification: A network Trojan was detected] [Priority: 1] {TCP} [REDACTED]:30000 -> [REDACTED]:4444
2025-09-11 07:00:00 [**] [1:2001001:1] ET TROJAN Possible C2 Beaconing [**] [Classification: A network Trojan was detected] [Priority: 1] {TCP} [REDACTED]:30001 -> [REDACTED]:4444
2025-09-11 13:00:00 [**] [1:2001002:1] ET TROJAN Possible C2 Beaconing [**] [Classification: A network Trojan was detected] [Priority: 1] {TCP} [REDACTED]:30002 -> [REDACTED]:4444
2025-09-12 13:00:00 [**] [1:2001006:1] ET TROJAN Possible C2 Beaconing [**] [Classification: A network Trojan was detected] [Priority: 1] {TCP} [REDACTED]:30006 -> [REDACTED]:4444
2025-09-12 19:00:00 [**] [1:2001007:1] ET TROJAN Possible C2 Beaconing [**] [Classification: A network Trojan was detected] [Priority: 1] {TCP} [REDACTED]:30007 -> [REDACTED]:4444
2025-09-13 01:00:00 [**] [1:2001008:1] ET TROJAN Possible C2 Beaconing [**] [Classification: A network Trojan was detected] [Priority: 1] {TCP} [REDACTED]:30008 -> [REDACTED]:4444
2025-09-13 07:00:00 [**] [1:2001009:1] ET TROJAN Possible C2 Beaconing [**] [Classification: A network Trojan was detected] [Priority: 1] {TCP} [REDACTED]:30009 -> [REDACTED]:4444
It clearly confims our suspicion against one of the internal compromised host.
Let's slice and dice through the results, to filter against the compromised IP responsible for beaconing, as shown below:
Commandline: cat ids_alerts.log | grep -n [REDACTED] | cut -d' ' -f6,7,8,9,10,19,22,23 | head -n 15
ubuntu@tryhackme:~/Desktop/Perimeter_logs/challenge$ cat ids_alerts.log | grep -n [REDACTED]   | cut -d' ' -f6,7,8,9,10,19,22,23 | head -n 15
POLICY Suspicious HTTP [**] [Classification:
WEB_SERVER Possible SQL Injection [**] [REDACTED]:3389
POLICY Suspicious HTTP [**] [Classification:
WEB_SERVER Possible SQL Injection [**] [REDACTED]:25
POLICY Suspicious HTTP [**] [Classification:
POLICY Suspicious HTTP [**] [Classification:
POLICY Suspicious HTTP [**] [Classification:
POLICY Suspicious HTTP [**] [Classification:
INFO Possible Benign Scan [**] [REDACTED]:443
WEB_SERVER Possible SQL Injection [**] [REDACTED]:53
This further affirms that, the infected host is further performing susicious activities. We can use the following command to show the stats of the alerts triggered against infected host.
Commandline: cat ids_alerts.log | grep -n [REDACTED] | cut -d' ' -f6,7,8,9,10,19,22,23 | uniq -c | sort -nr | head
ubuntu@tryhackme:~/Desktop/Perimeter_logs/challenge$ cat ids_alerts.log | grep -n [REDACTED] | cut -d' ' -f6,7,8,9,10,19,22,23 | uniq -c | sort -nr | head
32 TROJAN Possible C2 Beaconing [**] {TCP} [REDACTED]:4444
5 POLICY Suspicious HTTP [**] [Classification:
3 TROJAN Possible C2 Beaconing [**] {TCP} [REDACTED]:4444
3 POLICY Suspicious HTTP [**] [Classification:
2 WEB_SERVER Possible SQL Injection [**] [REDACTED]:4444
2 TROJAN Possible C2 Beaconing [**] {TCP} [REDACTED]:4444
Above analysis clearly indicates that our internal network is fully compromised, and we now have the external IP address acting as a server, recieving the beacons from our compromised host.
Commandline: cat ids_alerts.log | grep -n [REDACTED] | cut -d' ' -f6,7,8,9,10,19,22,23 | uniq -c | sort -nr | head
ubuntu@tryhackme:~/Desktop/Perimeter_logs/challenge$ cat ids_alerts.log | grep -n [REDACTED]  | cut -d' ' -f6,7,8,9,10,19,22,23 | sort -nr | uniq -c | sort -nr
80 TROJAN Possible C2 Beaconing [**] {TCP} [REDACTED]:4444
32 INFO Possible HTTP POST Large {TCP} [REDACTED]:80
28 INFO Possible HTTP POST Large {TCP} [REDACTED]:8080
23 POLICY Suspicious HTTP [**] [Classification:
2 WEB_SERVER Possible SQL Injection [**] 10.0.0.50:53
2 WEB_SERVER Possible SQL Injection [**] 10.0.0.50:3389
2 WEB_SERVER Possible SQL Injection [**] [REDACTED]:8080
2 WEB_SERVER Possible SQL Injection [**] [REDACTED]:445
2 INFO Possible Benign Scan [**] 10.0.0.50:21
1 WEB_SERVER Possible SQL Injection [**] [REDACTED]:53
1 WEB_SERVER Possible SQL Injection [**] [REDACTED]:443
Data Exfiltration Attempt
Now that, we have identified the communication and examined other alerts as well against suspicious Is, let's now investigate, if there are any indicators of data being exfiltrated out of our network. We will apply filter on the compromised hosts, and examine the traffic originating from those to an external destination IP, as shown below:
Commandline: cat firewall.log | grep [REDACTED] | cut -d' ' -f5,6,7 | uniq | sort
ubuntu@tryhackme:~/Desktop/Perimeter_logs/challenge$ cat firewall.log | grep [REDACTED]  | cut -d' ' -f5,6,7 | uniq | sort
[REDACTED]:40000 -> [REDACTED]:8080
[REDACTED]:40001 -> [REDACTED]:8080
[REDACTED]:40002 -> [REDACTED]:8080
[REDACTED]:40003 -> [REDACTED]:80
[REDACTED]:40004 -> [REDACTED]:80
[REDACTED]:40005 -> [REDACTED]:80
[REDACTED]:40006 -> [REDACTED]:80
[REDACTED]:40007 -> [REDACTED]:80
[REDACTED]:40008 -> [REDACTED]:80
[REDACTED]:40009 -> [REDACTED]:8080
[REDACTED]:40010 -> [REDACTED]:80
[REDACTED]:40015 -> [REDACTED]:80
[REDACTED]:40016 -> [REDACTED]:80
[REDACTED]:40017 -> [REDACTED]:8080
[REDACTED]:40018 -> [REDACTED]:80
[REDACTED]:40019 -> [REDACTED]:8080
The output clearly shows, the compromised host REDACTED is sending extensive amound of traffic on external IP address. We can also filter on IDS logs, to see the alerts being triggered on these activities from the internal IP.
ubuntu@tryhackme:~/Desktop/Perimeter_logs/challenge$ cat ids_alerts.log | grep [REDACTED] | tail
2025-09-27 07:00:00 [**] [1:2002050:1] ET INFO Possible HTTP POST Large Upload [**] [Classification: Potential Data Exfiltration] [Priority: 2] {TCP} [REDACTED]:40050 -> [REDACTED]:8080
2025-09-27 11:00:00 [**] [1:2002051:1] ET INFO Possible HTTP POST Large Upload [**] [Classification: Potential Data Exfiltration] [Priority: 2] {TCP} [REDACTED]:40051 -> [REDACTED]:8080
2025-09-27 15:00:00 [**] [1:2002052:1] ET INFO Possible HTTP POST Large Upload [**] [Classification: Potential Data Exfiltration] [Priority: 2] {TCP} [REDACTED]:40052 -> [REDACTED]:80802025-09-28 07:00:00 [**] [1:2002056:1] ET INFO Possible HTTP POST Large Upload [**] [Classification: Potential Data Exfiltration] [Priority: 2] {TCP} [REDACTED]:40056 -> [REDACTED]:80
2025-09-28 11:00:00 [**] [1:2002057:1] ET INFO Possible HTTP POST Large Upload [**] [Classification: Potential Data Exfiltration] [Priority: 2] {TCP} [REDACTED]:40057 -> [REDACTED]:8080
2025-09-28 15:00:00 [**] [1:2002058:1] ET INFO Possible HTTP POST Large Upload [**] [Classification: Potential Data Exfiltration] [Priority: 2] {TCP} [REDACTED]:40058 -> [REDACTED]:80
2025-09-28 19:00:00 [**] [1:2002059:1] ET INFO Possible HTTP POST Large Upload [**] [Classification: Potential Data Exfiltration] [Priority: 2] {TCP} [REDACTED]:40059 -> [REDACTED]:8080
We have found evidence of data exfiltration attempts. If we dig deep into the alerts and pivot correlate the alerts through other log files, we can find more suspicious activities as well.
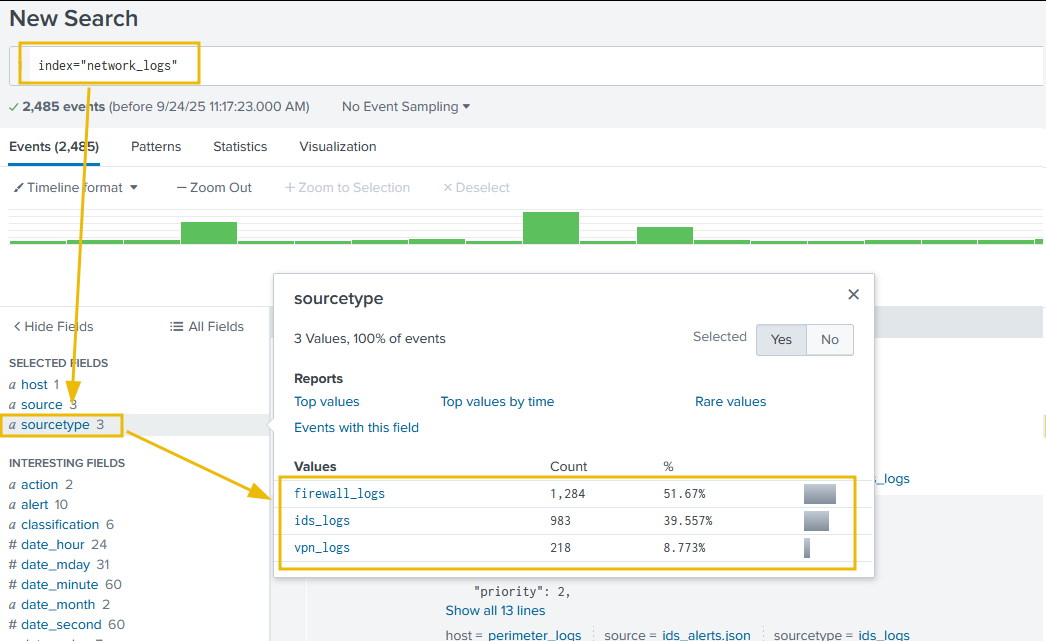
Method 2: Analyzing Logs via Splunk
As a SOC Analyst, analyzing logs manually can become a tedious task if the log files are large. Therefore, a Splunk instance is also provided in the VM if you decide to use it for log Analysis.
To proceed, open the link localhost:8000 in the browser, click on the Search & Reporting tab on the left bar, and start analyzing the logs. Logs are pre-ingested into the index="network_logs", as shown below:
Examine the firewall logs. What external IP performed the most reconnaissance?
In the firewall log, Which internal host was targeted by scans?
Which username was targeted in VPN logs?
What internal IP was assigned after successful VPN login?
Which port was used for lateral SMB attempts?
In the IDS logs, which host beaconed to the C2?
During the investigation, which IP was observed to be associated with C2?
Which host showed the exfiltration attempts?
In this room, you learned that an enterprise network is not just a collection of computers and servers. It’s an ecosystem with critical components like firewalls, Active Directory, application servers, file/database servers, endpoints, and wireless access points.
- The network perimeter acts as the boundary between trusted and untrusted networks.
- Attackers test this boundary constantly with port scans, brute-force attempts, and exploits against exposed services.
- Monitoring the perimeter allows analysts to detect these early signs before attackers can move deeper into the network.
As a security analyst, our role is to:
- Recognize normal vs suspicious network traffic.
- Escalate unusual activity to higher tiers.
- Understand how each network component fits into the bigger picture of enterprise defense.
Complete the room.
Ready to learn Cyber Security?
TryHackMe provides free online cyber security training to secure jobs & upskill through a fun, interactive learning environment.
Already have an account? Log in