

Splunk: Exploring SPL
Learn and explore the Splunk's Search Processing Language.
medium

To access material, start machines and answer questions login.
is a powerful Security Information and Event Management () platform that allows analysts to search, visualize, and investigate log data. Its Search Processing Language () is the key to turning large volumes of data into practical results. In this room, you will explore , learning how to build, filter, and transform search queries to extract meaningful information.
Learning Objectives
- Understand how processes and filters log data
- Chain and apply commands effectively
- Visualize log data with charts and statistics
- Apply your skills to use anomaly detection
Prerequisites
- Complete Introduction to for an overview of usage for log analysis
- Cover : Basics to get comfortable navigating the interface
Machine Access
Click the Start Machine button below to start the lab. Please give five minutes to start and access the dashboard with this link:
Set up your virtual environment

I am ready to to explore Splunk's query language!
's Search & Reporting App is the default interface used for searching and analyzing data on the home page. It has various functionalities that assist analysts in improving the search experience.
Upon accessing the app, we discover several key functionalities.
- Search Head: Where analysts put the queies to filter or aggregate log data
- Time Picker: Provides multiple options to select the timeframe of your search
- Search History: Saves 's search queries that have previously been used
- Data Summary: Provides a summary of the hosts, sources, and sourcetypes available
Take a look through the search history in your instance and begin by answering the first question.

Your First Search
In this room, we will be working with the windowslogs index, where index is like a Splunk database or container for organizing the data. You can proceed by submitting your first query using the search function and setting the time range to All time.

Note: Both index=windowslogs and index = windowslogs are valid syntax in Splunk. |
Fields Sidebar
The Field Sidebar can be found on the left panel of Splunk search. This sidebar features two sections: one displays selected fields, and the other highlights interesting fields. It also provides quick results, including top values and raw values for each field.
- Selected Fields: The default extracted fields. You can select other fields by clicking them and toggling
Selected - Interesting Fields: Pulls all the interesting fields it finds and displays them in the left panel to further explore
- Numeric Fields
#: This symbol represents fields that contain numerical values - Alpha-numeric Fields
α: The alpha symbol represents fields that contain strings (text values) - Count: The number of events containing the listed field
- More available fields: If more fields are available, they can be accessed and selected here

Submit your first query for All Time: index=windowslogs.
How many total events do you see?
After you submit your first query, look in the Fields sidebar.
Which SourceIP has recorded the most amount of events?
How many events appear on 04/15/2022 from 08:05 AM to 08:06 AM?
's Search Processing Language () is behind every search in . It combines commands, functions, and operators that allow you to filter, transform, and analyze data from your ingested logs. In essence, lets you search through massive amounts of data, apply filters to narrow down results, and format the output. Let's see how to use .
Free Text Search
The simplest way to use is to use free-text search, such as in the query below:
index=windowslogs aliceThe query will search for all events containing the alice keyword (case-insensitive). If you don't know the field names or just want to run a quick hunt for a unique keyword, free-text searches are your best choice. However, to run more complex searches, you'd need to use search operators and work with parsed fields and their values.
Search Operators
Splunk operators (opens in new tab) are the building blocks used to construct any search query. These operators are used to filter, remove, and refine your search results based on the specified criteria. Below, we will cover relational, logical, and wildcard operators. Note that for the filters to work, the events must be parsed into fields - the next rooms will explain the process in more detail.
Relational Operators
These operators are used to compare two expressions. They determine the relationship between the expressions, such as whether one is equal to, not equal to, greater than, or less than the other. Let's check out some examples below.
| Operator | Example | Explanation |
|---|---|---|
Equals = |
UserName=Mark |
Search for all events in which the field name UserName is equal to Mark |
Not Equal To != |
UserName!=Mark |
Search for all events in which the field name UserName is not equal to Mark |
Less Than < |
Age<10 |
The field Age has a value of less than 10 |
Less Than or Equal To <= |
Age<=10 |
The field Age has a value of less than or equal to 10 |
Greater Than > |
Outbound_Traffic>50 |
The Outbound_Traffic field value is greater than 50 |
Greater Than or Equal To >= |
Outbound_Traffic>=50 |
The Outbound_Traffic field value is greater than or equal to 50 |
Let's get hands-on and use the != relational operator to locate all event logs in our index where the field AccountName is not equal to System. Start with the query below and don't forget to set your time range back to All time!
index=windowslogs AccountName!=SYSTEMIn the screenshot below and in your Splunk instance, you can see that we have successfully filtered for all events that do not include the AccountName field value of SYSTEM.

Logical Operators
Splunk supports the following logical operators, which can be used to connect or modify conditions and operate on Boolean values (true/false).
| Operator | Example | Explanation |
|---|---|---|
NOT |
NOT UserName=* |
Returns events where UserName field does not exist. Don't confuse it with != operator |
AND |
UserName=David AND IPAddress=10.10.10.10 |
Returns all events in which the UserName field is equal to David and the IPAddress field is equal to10.10.10.10 |
OR |
UserName=David OR UserName=John |
Returns all events in which the UserName field is equal to David or John |
IN |
UserName IN(David, John) |
A more convenient alternative to the OR keyword, especially for long lists. |
Let's get some more practice by appending the previous query to search for events that have the AccountName field James. With this query, you are telling Splunk to filter out the SYSTEM account name, and from the results, only see events from the account name James:
// AND operator is implied, so both queries are valid
index=windowslogs AccountName!=SYSTEM AND AccountName=James
index=windowslogs AccountName!=SYSTEM AccountName=James
Wildcards and CIDR Search
supports the use of wildcards and CIDR search for IP addresses to search ffor a partial or IP subnet match. For example:
| Symbol | Example | Explanation |
|---|---|---|
* |
status=*fail* |
This will return all events that have status field set to failed, failure, appfail, etc. |
* |
DestinationIp=172.* |
This will return all events that contain values like DestinationIp=172.90.0.0.1 or DestinationIp=172.18.5.22 |
N/A |
DestinationIp=172.18.0.0/16 |
This will return all events where DestinationIp field is within the 172.18.0.0/16 subnet |

Order of Evaluation
Quotes
In Splunk, quotation marks "" are used to define exact phrases or strings. You can wrap text in quotes, and will treat it as a single value. Quotes can also be used to escape search operators. For example:
index=windowslogs failed login: Search for events with failed and login keywords, in any orderindex=windowslogs "failed login": Search for the exact phrase "failed login", word order mattersindex=windowslogs "TO BE OR NOT TO BE": Search for the exact phrase containing NOT and OR
Parentheses
You can utilize parentheses in Splunk to help group conditions together and control how the search is applied. Since OR operator takes precedence over AND, parentheses can help set the correct order of conditions. For example, imagine you want to search for events containing alice and bob together, or charlie alone:
| Your Search | How Splunk Evaluates It |
|---|---|
index=windowslogs alice AND bob OR charlie(Implicit search, no parentheses) |
index=windowslogs alice AND (bob OR charlie)(Mistake! Splunk evaluated OR before AND) |
index=windowslogs (alice AND bob) OR charlie(Explicit search with parentheses) |
index=windowslogs (alice AND bob) OR charlie(Correct! The results match your requirements) |
How many events in the windowslogs index have an EventID field value equal to 4624?
How many events are observed with the DestinationIp = 172.18.39.6 and DestinationPort = 135?
Use the query index=windowslogs Hostname=Salena.Adam DestinationIp=172.18.38.5
Which SourceIp returns the highest count?
How many events are returned when you search the term cyber*?
Which operator is given the lowest priority in Splunk searches?
Your network may generate thousands of logs every minute, all of which are ingested into your solution. Searching for anomalies without filters can quickly become overwhelming. ’s Search Processing Language () enables analysts to apply filters using search commands to narrow down search results and focus only on the most relevant events.
In , commands are linked together using a pipe symbol |. Each pipe passes the output of one command into the next, allowing you to refine your results step by step. Let’s look at some useful commands that help filter and organize search results.
Useful Filtering Commands
Fields
The fields (opens in new tab)command is used to include or exclude specific fields from your search results. To exclude a field, use a minus sign - before the field name. The plus sign + can be used to include a field explicitly, but it isn’t required. By default, fields includes any fields listed after the command. Let’s try it out in our Splunk instance by highlighting the following fields. This makes it easy to see how useful the fields command can be when working with logs that contain hundreds of available fields.
index=windowslogs | fields host User SourceIp

Dedup
The dedup (opens in new tab) command removes duplicate values from your search results. For example, if our logs contain seven distinct IP addresses in the SourceIp field, the results will return seven events, one for each unique IP. The command is useful for subsearches and for cleaning identical events (e.g., Microsoft 365 often sends 50 events for a single activity).
index=windowslogs
| fields EventID User Image Hostname SourceIp
| dedup SourceIp
Rename
The rename (opens in new tab) command allows you to change the name of a field in your search results. This can help improve the readability of your search results, especially if the original fields are too long or not suitable for showing them in the screenshots in formal SOC reports.
index = windowslogs
| fields EventID User Image Hostname SourceIp
| rename User as Employee
The command is also useful to flatten JSON or XML subfields. For example, for a JSON log entry like {"request": {"path": "/admin", "ip": "10.0.0.2"}}, Splunk will create two fields: request.path and request.ip. If you don't want to type the prefix every time, consider removing it like in the example below:
index=jsondata
| rename request.* as * // request.path -> path; request.ip -> ip
Regex
The regex (opens in new tab) command allows you to filter search results using regular expressions, which match specific text patterns in field values. This is useful when you need to find events that follow a specific format rather than an exact keyword. Splunk regular expressions are PCRE (Perl Compatible Regular Expressions) and use the PCRE C library.
index = windowslogs | regex Image = "\.exe$"
The query above applies a regular expression to the Image field, returning only events where the field value ends with .exe. The $ symbol specifies that the match must occur at the end of the string. That was the simplest example, but regex is irreplaceable for complex searches, especially on custom or poorly-parsed data sources.

Use the fields command to highlight Domain, SourceProcessId, and TargetProcessId.
Which SourceProcessId has the highest value?
Try out this query index=windowslogs | regex TargetObject="Manager$".
Which TargetObject field value contains the highest number of results?
The Search Processing Language () provides further commands that help organize and structure your search results. When working with log data, raw search results can be overwhelming, and some events may contain fields that may not be relevant to your investigation. commands enable you to filter, order, and format these results, allowing you to focus on the most important information.
Table Command
The table (opens in new tab) command allows you to select only the fields you are interested in viewing and displays them in a clean, readable format. This is especially useful when building timelines, investigating specific hosts or users, or comparing multiple fields. This query will create a table out of named fields and organize them by timestamp. Use the table command to answer the first question.
index=windowslogs | table _time EventID Hostname SourceName

Useful Structuring Commands
Other commands can be used alone or combined with table to hone in on the data you're really interested in. Let's look at some examples in the table below.
| Command | Example | Explanation |
|---|---|---|
head |
index=windowslogs | head 20 |
Returns the first (newest) 20 events. Useful to speed up the search if you don't need complete results |
tail |
index=windowslogs | tail 20 |
Returns the last (oldest) 10 events. Useful to speed up the search if you don't need complete results |
sort |
index=windowslogs | sort User |
This will sort the logs in alphabetical order based on the field User |
reverse |
index=windowslogs | reverse |
This command reverses the order of events (descending order) |
Timelining With Table
The table command can be used to create timelines that help analysts visualize how events unfolded. By organizing key fields, we can reconstruct the sequence of actions that occurred on a system. For example, we can list all actions happening on the Salena.Adam host in a chronological order, and then exclude system noise or add additional columns, if required.
index = windowslogs Hostname = Salena.Adam
| table _time Hostname EventID Category
| reverse

Subsearches
Imagine you are reviewing Sysmon process creation events and want to understand their logon context: did a process originate from a remote session (LogonType 3/10) or a service (LogonType 5)? Sysmon doesn't log the LogonType field, so you need to correlate across two data sources: Sysmon ID 1 for the process creation, and Security ID 4624 for the logon context. The LogonId field, present in both, is your link between them:
- You get the Image, User, LogonId from the original Sysmon event (EventID=1)
- Using LogonId field, you find the corresponding Logon event (EventID=4624)
- You get the LogonType and IpAddress from the corresponding Logon event
With Splunk subsearches (opens in new tab) and join keyword, you can correlate across multiple data sources within one search, and, for our example, build a unified tablecontaining both process and logon details:
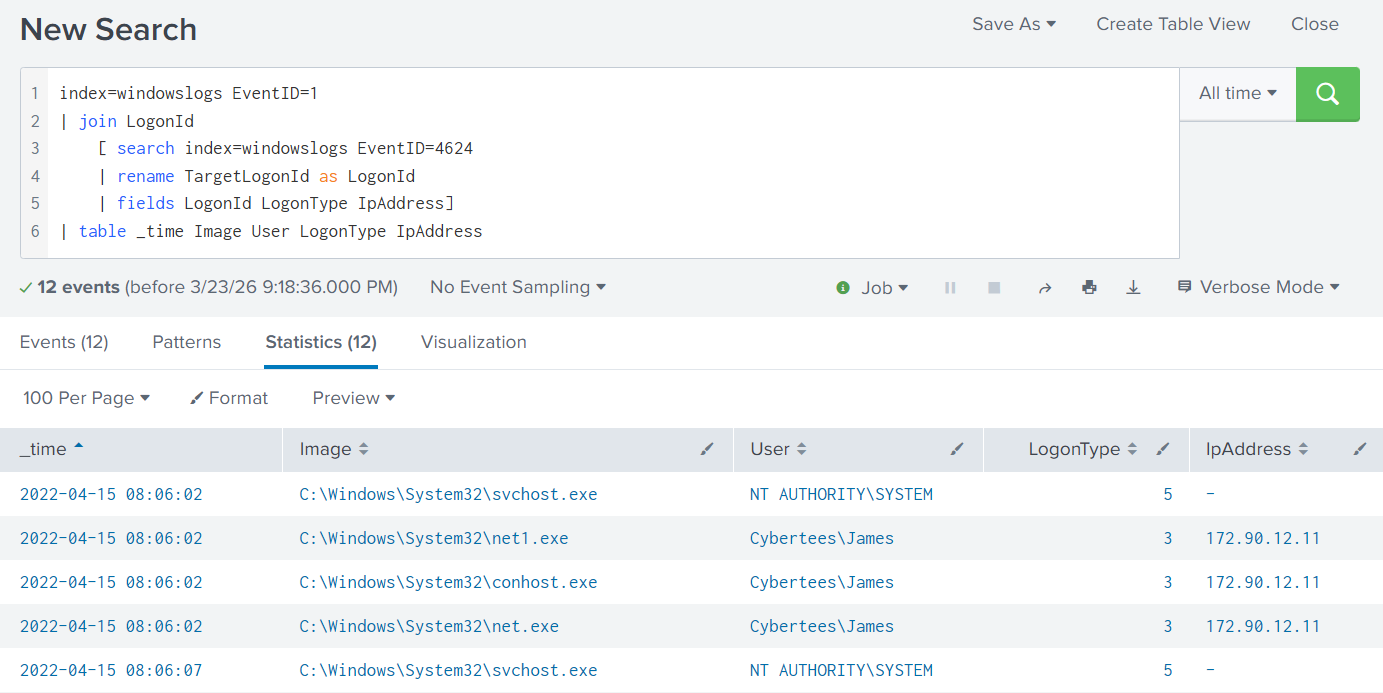
index=windowslogs EventID=1
| join LogonId
    [ search index=windowslogs EventID=4624
    | rename TargetLogonId as LogonId
    | fields LogonId LogonType IpAddress]
| table _time Image User LogonType IpAddress
Let's unwrap the query above step by step:
The subsearch within [ ... ] is executed |
|
| The main search is executed |
|
Overall, subsearches are extremely powerful, but also don't perform very well on large data sets. Most of subsearch queries can be replaced with a more-performant stats and eval command, that you will learn in the following task. Still, if you ever need need to enrich data source A with fields from data source B, try using subsearch + join combination!
Build a table that highlights the EventID, AccountName, and AccountType fields.
Which AccountName appears first in your results?
Append the above query to include the reverse command.
Which EventID appears first?
Use the query below to build a timeline of events.
What password was given to the user A1berto?index=windowslogs EventID=1| table _time ParentProcessId ProcessId ParentCommandLine CommandLine| reverse
Transforming commands (opens in new tab) allow you to change raw event data into useful summaries, statistics, and visualizations. Instead of viewing every individual log, they help analysts aggregate, count, and analyze patterns across many events. Searches that utilize transforming commands are referred to as transforming searches in .
General Transformational Commands
| Command | Example | Explanation |
|---|---|---|
| top | index=windowslogs | top User limit=5 |
Returns the ten most frequent values of the field specified. A numerical value can be included with limit= to reduce or expand the results |
| rare | index=windowslogs | rare User limit=5 |
Returns the ten least frequent values of the field specified. A numerical value can be included with limit= to reduce or expand the results |
Highlight
You can use the highlight (opens in new tab) command to visually mark the chosen field values when viewing raw log data. In the example below, we can use the following query to highlight the terms specified. Remember to change the view format from List to Raw to view the results.
index=windowslogs | highlight User EventID Image "Process accessed"
Stats
The stats (opens in new tab) command is a powerful tool in Splunk. It allows you to calculate statistics, such as counts, sums, and averages, of fields within your search results. This can be useful when summarizing large volumes of data to identify trends or anomalies. The table below covers some standard stats functions.
| Command Function | Example | Explanation |
|---|---|---|
| Average | stats avg(ProcessCount) |
Calculates the average value of the chosen field |
| Max | stats max(Price) |
Returns the maximum value of the chosen field |
| Min | stats min(UserAge) |
Returns the minimum value of the chosen field |
| Sum | stats sum(Cost) |
Returns the sum of the chosen field values |
| Count | stats count by SourceIp |
Returns the number of occurrences of the chosen field |
You can try the stats command with the example below, which returns the total number of occurrences for each EventID and displays them in ascending order.
index=windowslogs | stats count by EventID | sort EventID
Chart
The chart (opens in new tab) command returns your search results in a table, which you can then use to create helpful visualizations. This command utilizes many of the same functions as stats. Let's give it a shot to visualize the count of events containing the User field with this query.
index=windowslogs | chart count by User
Timechart
The timechart (opens in new tab) command is used to visualize how data changes over time. It is beneficial for spotting trends, peaks, and anomalies in your log data. In the example below, we use timechart to track process activity over time. The following query removes any NULL Image field values and creates a time-based area chart showing the top five most frequently occurring process images within 30-minute intervals.
index=windowslogs Image!="" | timechart span=30m count by Image limit=5
Data Enrichment and Field Manipulation
IP Location
You can use the iplocation (opens in new tab) command to enrich your search results with geographic information about IP addresses. It uses Splunk's built-in geolocation tables to add fields such as City, Region, and Country. Try it out with the query below.
index=windowslogs | iplocation SourceIp | stats count by Country
Lookup
Similarly, lookup (opens in new tab) is used to enrich events using external data sources. It matches a field in your search to a corresponding field in a CSV file or lookup table. In this example, a CSV was created that associates the Hostname field with an employee role signified by UserRole.
index=windowslogs
| lookup user_roles Hostname OUTPUT UserRole
| stats count by Hostname UserRole
Eval
The eval (opens in new tab) command is one of the most versatile tools in Splunk. It allows you to create new fields, modify existing ones, and perform calculations directly within your searches. It can be used to make data more readable and prepare fields for use in visualizations. In the example below, we created a new field called LogonTypeDesc to give a more descriptive name to numeric LogonType values.
index=windowslogs
| eval LogonTypeDesc = case(LogonType == 3, "Network Logon", LogonType == 5, "Service")
| stats count by LogonType LogonTypeDesc
The query assigns:
- Network Logon when
LogonTypeis 3 - Service when
LogonTypeis 5

Use the top command to query the Image field.
Which Image field value has the most occurrences?
Try out the iplocation command with the SourceIp field.
Which Region do the IP addresses in your events originate from?
Try out this lookup query. Which Image field value has the highest RiskScore?index=windowslogs| lookup image_riskscore Image OUTPUT RiskScore| stats count by Image RiskScore| sort - RiskScore
Anomaly Detection
Sometimes you might investigate a data set with lots of different events (e.g., logins) and will need to quickly identify outliers, the events that look suspicious compared to the others. For example, imagine a data set of 2,000 logins with just four fields: time of the login, username, source IP, and source country. How would you identify logins from unexpected countries, if field statistics don't show any anomalies?
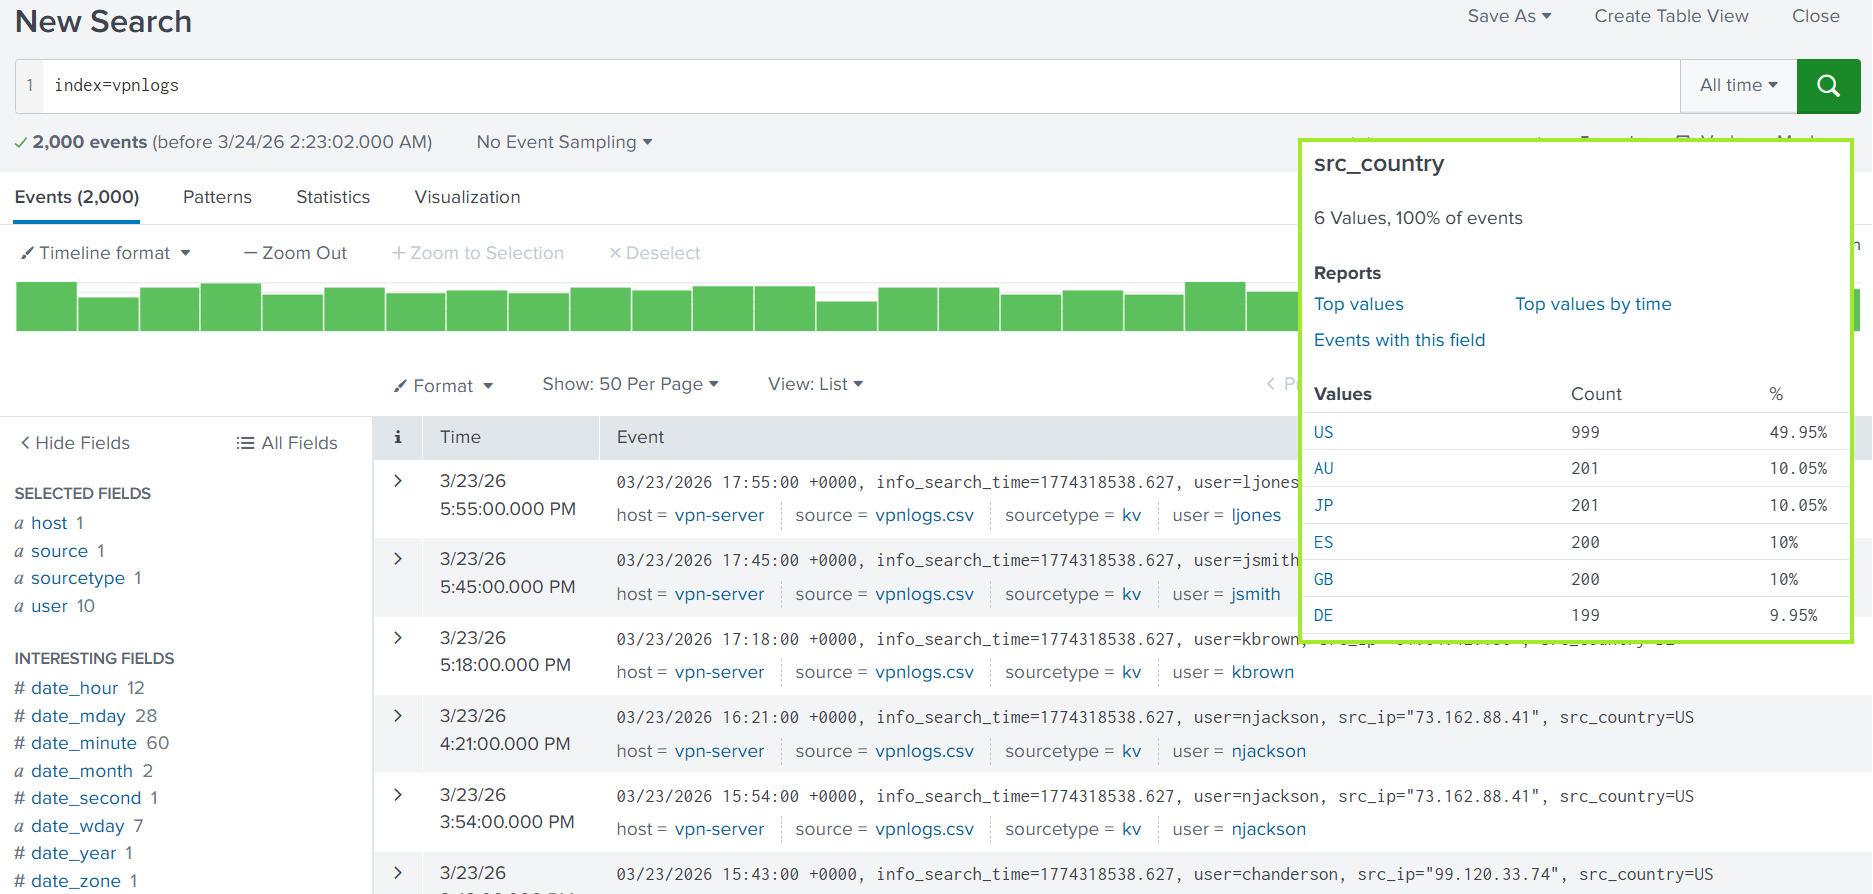
Detecting Outliers by Country
For a US-based user, logging in from the US is expected, but for an EU-based user, it might be a sign of intrusion. To create aggregated statistics per user, start with the search below. The eventstats command is very similar to stats, but preserves raw events for further processing; and where command is like search, but a more powerful. The query may look complex, so you are encouraged to read the descriptions below. After you run the query, you'll see two potentially compromised users:
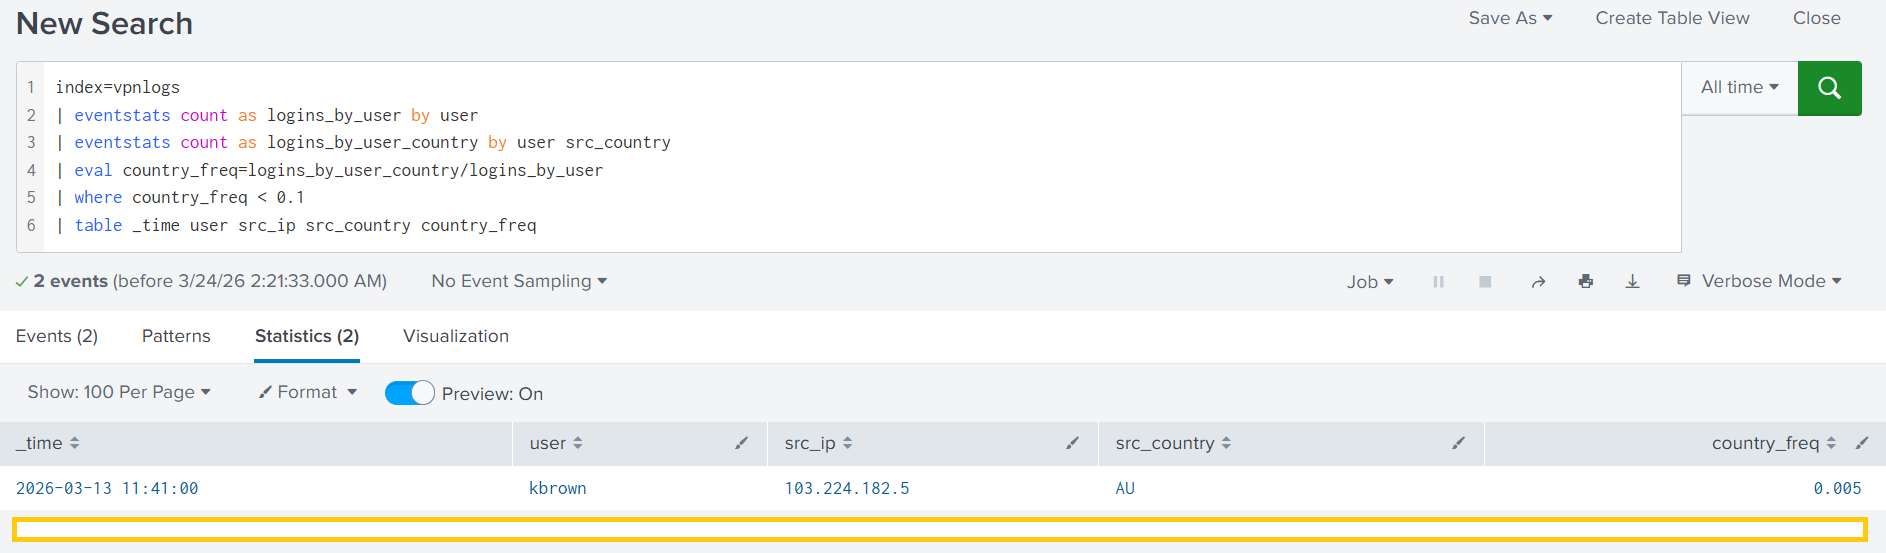
| Line / Command | Result |
|---|---|
| Line 2: Counts total logins by user | For kbrown user, logins_by_user=200 |
| Line 3: Counts logins by user and source country | For kbrown and Austria, logins_by_user_country=1 |
| Line 4: Evaluates frequency of logins per country | For kbrown and Austria, country_freq=0.005 |
| Line 5: Includes only rare user-country pairs | Note: The sensitivity (0.1) is called the threshold |
| Line 6: Shows the outliers as a table | Only 2 outliers out of 2,000 login events! |
In summary, we have found two potentially compromised users: kbrown, and another one you'll need for the task. Both of them logged in from the anomalous countries only once, which is a strong signal of either VPN usage or a breach. Check out the query yourself and answer the first two questions from the task:
index=vpnlogs
| eventstats count as logins_by_user by user
| eventstats count as logins_by_user_country by user src_country
| eval country_freq=logins_by_user_country/logins_by_user
| where country_freq < 0.1
| table _time user src_ip src_country country_freq
Detecting Outliers by Hour
Following a similar approach, you can hunt for logins during anomalous hours. However, this task is a bit harder, since you need to account for different time zones and different habits of your employees. Some will log in strictly during working hours, while others may log in even at night. To account for this, let's calculate a few variables:
typical_hour: An average hour when the employee logs in, such as 13:30 UTCstdev_hour: How predictable the login hour is, where 0 means the most predictablestdev_hour=2means the employee is expected to log in at 13:30 UTC ± 2 hours
zscore: A number of standard deviations between the observed and typical login hourzscore=3means the login hour was x3 anomalous for that specific user
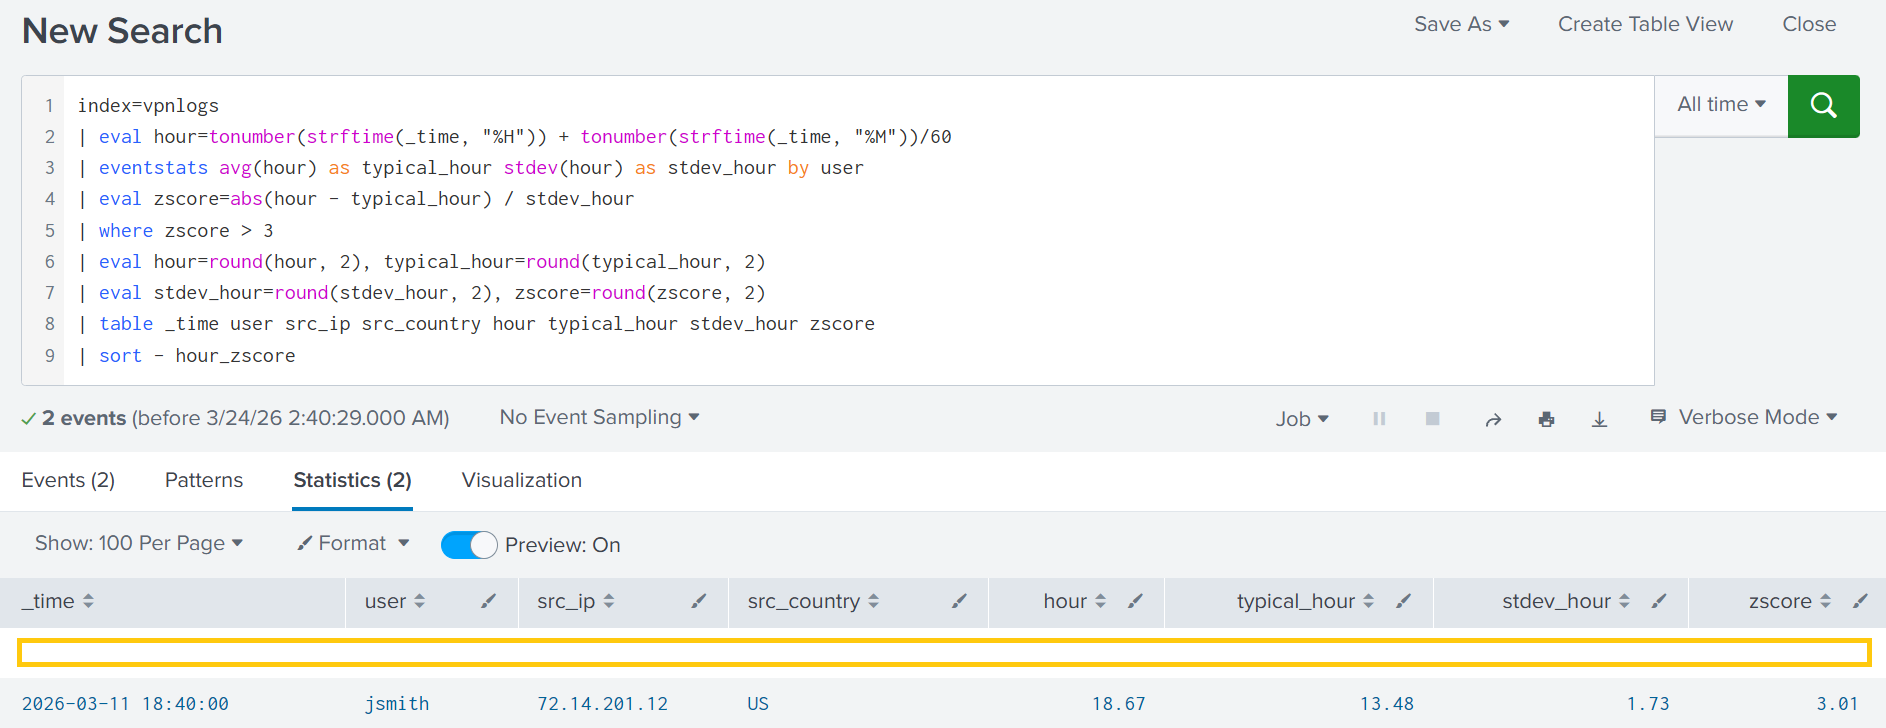
In summary, the query identifies anomalous login hours and detects two additional outliers, one of which is jsmith. You can see that the typical login hour for that user is around 13:30, and the deviation for the user is low. However, the observed login was made at 18:30, which is something worth investigating! Run the query below to find out the second outlier and answer the second question:
index=vpnlogs
| eval hour=tonumber(strftime(_time, "%H")) + tonumber(strftime(_time, "%M"))/60
| eventstats avg(hour) as typical_hour stdev(hour) as stdev_hour by user
| eval zscore=abs(hour - typical_hour) / stdev_hour
| where zscore > 3
| eval hour=round(hour, 2), typical_hour=round(typical_hour, 2)
| eval stdev_hour=round(stdev_hour, 2), zscore=round(zscore, 2)
| table _time user src_ip src_country hour typical_hour stdev_hour zscore
| sort - hour_zscoreand Impossible Travel
More advanced detections, such as the Impossible Travel (opens in new tab), are built upon the same basic commands you learned in this room. All you need is knowledge, some math, and threat context, such as IP geolocation from the iplocation command or threat intelligence from lookup tables. Then, you even play with fit and apply commands, which leverage machine learning algorithms to train on your data and improve the detection of future outliers.
Run the first anomaly detection query (index=vpnlogs).
Which other user is marked as an outlier?
Which country is anomalous for the user from Q1?
Answer Example: CN
Run the second anomaly detection query (index=vpnlogs).
Which user suspiciously logged in at 3 AM?
In this room, you learned how to use ’s Search Processing Language () to filter, structure, and transform raw log data into meaningful insights. You practiced using commands to build tables, charts, and visualizations to help uncover patterns and relationships between events.
To continue learning and try out your newly acquired skills, check out the -based challenge rooms below.
Complete the room and continue on your cyber learning journey!
Ready to learn Cyber Security?
TryHackMe provides free online cyber security training to secure jobs & upskill through a fun, interactive learning environment.
Already have an account? Log in