
Traffic Analysis Pitfalls
Learn about Visibility, Context, and Gaps in the traffic Analysis.
medium

To access material, start machines and answer questions login.
It is 02:47. Our fires an alert.
Alert: Large Outbound Transfer
Source:      10.10.15.44 (WKST-FINANCE-04)
Destination: 172.67.153.42:443
Protocol:    UDP
Bytes Out:   847 MB
Duration:    4h 12m
Time: 2026-04-02 02:47 UTC- We pull the IP. Every threat intelligence feed returns the same result: clean.
- No malware associations, no infrastructure, reputation score: benign.
- We check logs for any query resolving to that IP: nothing.
- We check the SNI for the destination hostname: Encrypted.
We have a destination IP, a port, a byte count, and a duration. Every other signal our detection stack depends on has been rendered invisible.

What Changed
Most traffic analysis techniques were designed for a simpler network: a connection to an IP meant a connection to one specific server. Attackers and legitimate services used separate IP ranges, so reputation databases could easily distinguish between them. queries carried hostnames in cleartext. handshakes exposed the destination name in the SNI field.
That picture no longer describes modern networks. A single IP now serves millions of domains simultaneously through CDNs. lookups are encrypted end-to-end before they reach our sensor. Encrypted Client Hello conceals hostnames. traffic no longer exclusively runs over . None of this is experimental. It is the default behavior of every major browser and CDN provider.
What This Room Covers
- Why IP-based monitoring fails against CDN infrastructure, and what to examine instead
- How /3 and the QUIC protocol have broken the assumptions built into most detection tooling
- How over HTTPS and Encrypted Client Hello eliminated two historically reliable detection signals, and what alternatives remain
- How to select the right log source for each investigative question
- How enrichment turns a meaningless IP into actionable context
Prerequisites
This room is part of the Advanced Traffic Analysis module in the Level 2 path. Before proceeding, you should be comfortable with the following:
- Network Fundamentals: /IP, resolution, and how and work at the protocol level.
- Wireshark: The Basics: Opening a packet capture and applying display filters.
- Level 1 Path: Alert triage, log analysis, and threat intelligence fundamentals.
The investigation runs in , with all data sources pre-ingested and ready to query. Task 2 covers the lab environment and where to find everything.
Continue to the next task.
Set up your virtual environment

The alert from Task 1 identified 10.10.15.44 (WKST-FINANCE-04), making a sustained connection to 172.67.153.42 on port 443. IP reputation returns clean. That IP address belongs to Cloudflare, which simultaneously serves traffic for tens of millions of domains. This task covers why IP-based triage is useless here and what to investigate instead.

Lab Connection
Click the Start Machine button below to start the lab. Please give five minutes to start and access the dashboard using this link:https://LAB_WEB_URL.p.thmlabs.com.

All logs for this room are pre-ingested in index=lab. To get started, navigate to the Search & Reporting app, set the time range picker to All Time, and run your searches against index=lab as shown below:
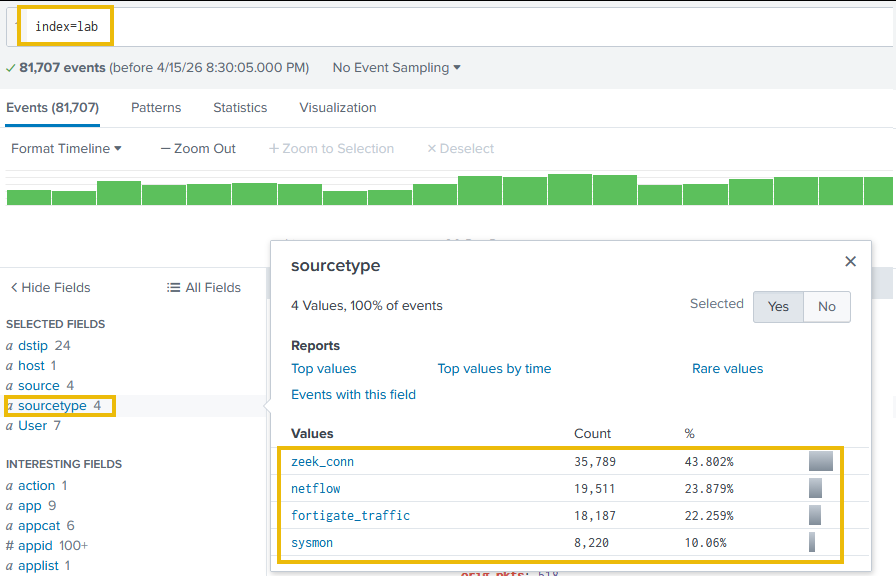
The index contains FortiGate firewall logs, Zeek connection records, Sysmon endpoint telemetry, and NetFlow data. Throughout this task, we will use these sources to examine the alert connection, apply ASN enrichment, and surface the behavioral signals that IP reputation cannot.
The CDN Visibility Problem
When WKST-FINANCE-04 connected to 172.67.153.42, our logs recorded the source IP, destination IP, port, and byte count. What they did not record is which service the traffic was actually destined for - that Cloudflare address simultaneously proxies traffic for millions of distinct services. Our logs show us the CDN hop. They cannot show us what is behind it.
This is why IP reputation returns clean, and blocking is not an option. The IP is not malicious. It is shared infrastructure. Detection requires a different approach.
Why IP-Based Monitoring Fails Against CDNs
Traditional IP reputation was built on a simpler assumption: one IP, one organization. CDNs invalidated that entirely. A single Cloudflare anycast address simultaneously proxies traffic for millions of distinct services, which is why no reputation feed will ever flag it, as blocking it would take down legitimate access for all of them. The four CDN providers we will encounter most often in enterprise traffic:
| CDN Provider | ASN | Representative IP Ranges |
|---|---|---|
| Cloudflare | AS13335 | 173.245.48.0/20, 103.21.244.0/22, 103.22.200.0/22, 103.31.4.0/22, 141.101.64.0/18, 108.162.192.0/18, 190.93.240.0/20, 188.114.96.0/20, 197.234.240.0/22, 198.41.128.0/17, 162.158.0.0/15, 104.16.0.0/13, 104.24.0.0/14, 172.64.0.0/13, 131.0.72.0/22 — full list (opens in new tab) |
| Fastly | AS54113 | 151.101.0.0/16 |
| Akamai | AS16625 | 23.32.0.0/11 |
| AWS CloudFront | AS16509 | 13.32.0.0/15, 52.84.0.0/15 |
When we see these ASNs during an investigation, IP-based triage is off the table. We need to shift to a different set of signals.
How Attackers Exploit CDN Infrastructure
Attackers exploit the same properties that make CDNs useful: shared infrastructure, clean reputation, and encrypted traffic. Two techniques appear consistently across enterprise incidents.
1) Domain Fronting
Domain fronting (MITRE ATT&CK T1090.004 (opens in new tab)) exploits the gap between the TLS SNI field (which advertises a legitimate hostname like www.microsoft.com) and the HTTP Host header inside the encrypted session, which routes traffic to attacker-controlled infrastructure. Every observable indicator points to a trusted domain while the actual C2 traffic hides inside the encrypted payload. APT29 (opens in new tab) used this extensively against Google App Engine during 2016-2018; Lotus Blossom (opens in new tab) continues to exploit Fastly infrastructure after Cloudflare and closed the technique on their platforms.
2) CDN Tunneling and Worker Abuse
Where domain fronting has been restricted, attackers have moved to Cloudflare Workers and Cloudflare Tunnel, exposing C2 services through *.workers.dev and *.trycloudflare.com, both domains allowlisted by most content filters. BlackWater Cloudflare Workers (opens in new tab) used Cloudflare Workers as a C2 relay; SerpentineCloud (2025) (opens in new tab) routes C2 through Cloudflare Tunnel endpoints in organizations that had allowlisted *.trycloudflare.com.
The Investigative Pivot: What to Look at When IP Is Meaningless
When the destination resolves to CDN infrastructure, we shift away from IP triage entirely. Let's open Splunk at MACHINE_IP and work through each signal in turn:
1) ASN Enrichment
Before we narrow down to a specific connection, let's get a picture of where all outbound traffic is actually going. We will use the asn_lookup table, which enriches each destination IP with its ASN, organization name, traffic category, and risk tier at query time. ASN enrichment does not reveal which domain is behind a CDN IP address. What it tells us is the type of organization that operates the destination infrastructure. Traffic to Cloudflare CDN is expected. Traffic to Bulletproof Hosting or a Tor exit node requires immediate attention, regardless of IP reputation. This means we can also apply today's threat intelligence to logs ingested months ago, without re-ingesting them.
Now let's look at what our network is actually talking to:
Search Query:
index=lab sourcetype=fortigate_traffic
| lookup asn_lookup network AS dstip OUTPUT dst_asn_org dst_category dst_risk
| stats count by dst_category dst_asn_org
| sort -count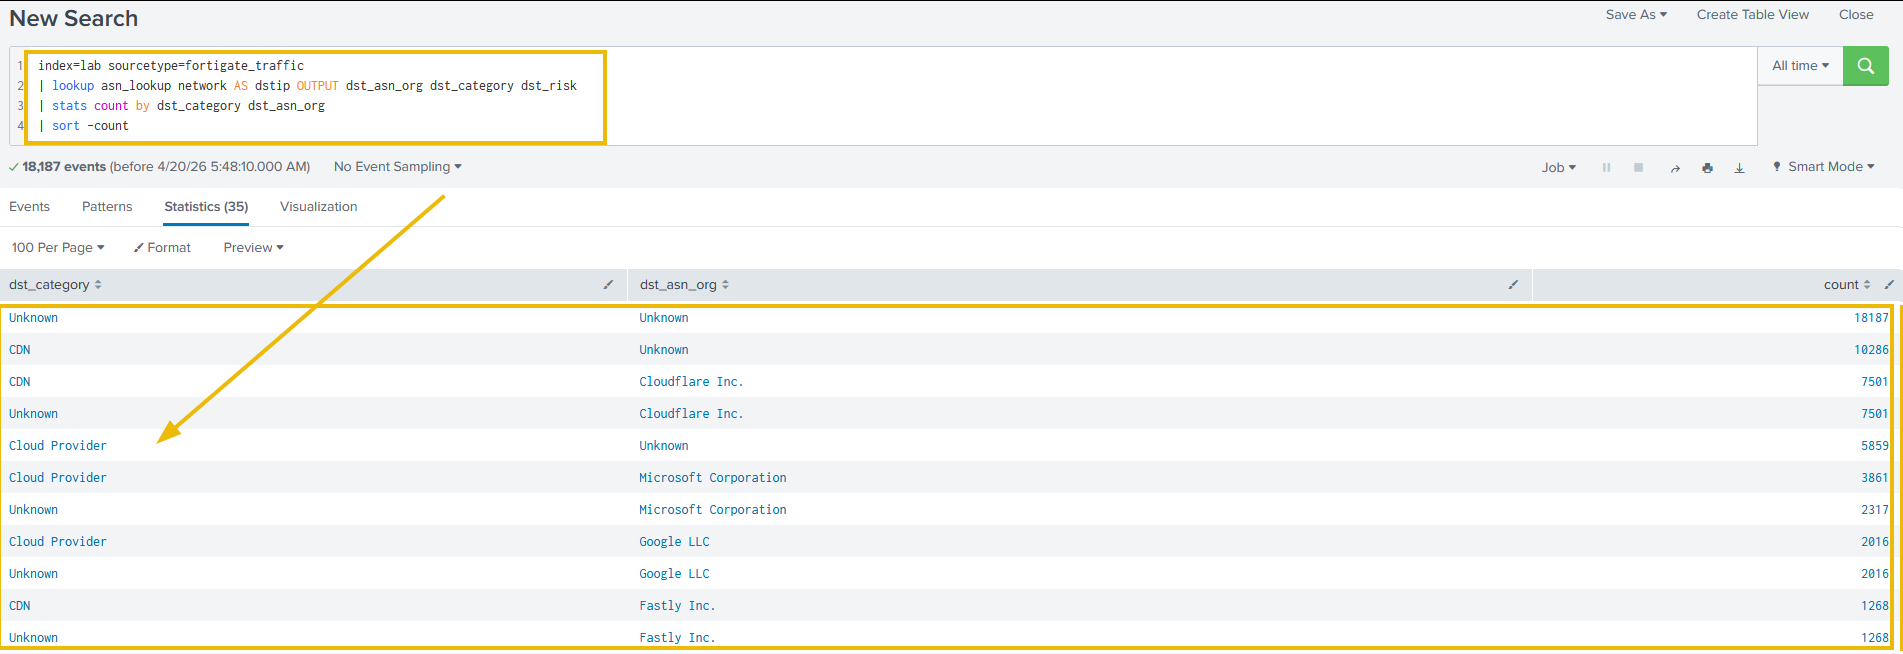
The output shows CDN and cloud traffic making up the bulk of the results, as expected. What we are looking for are the outliers: any Bulletproof Hosting (opens in new tab) or Tor exit nodes sitting in that list. Those are the connections IP reputation missed. The ASN lookup caught them. With the overall picture established, let's now examine the specific connection from our opening alert and start with the raw log:
Search Query:
index=lab sourcetype=fortigate_traffic srcip=10.10.15.44 dstip=172.67.153.42
| table _time srcip dstip proto sentbyte rcvdbyte
| sort _time | head 5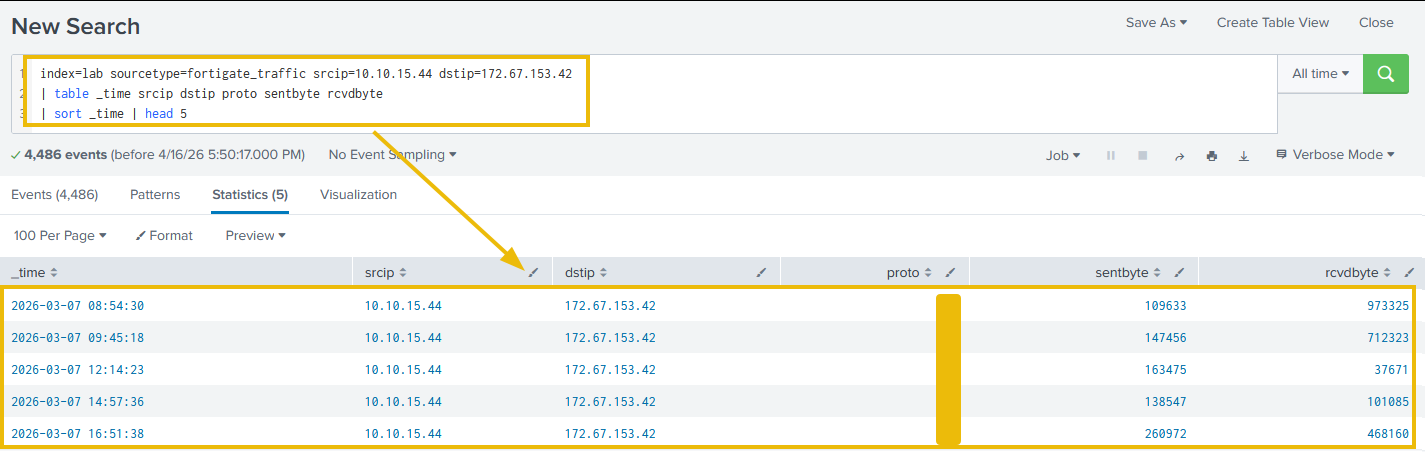
As we can see, the raw log gives us a source IP, a destination IP, a protocol number, and byte counts. 172.67.153.42 alone tells us nothing: no signal to escalate, no signal to close. Now let's apply ASN enrichment to the same record:
Search Query:
index=lab sourcetype=fortigate_traffic srcip=10.10.15.44 dstip=172.67.153.42
| lookup asn_lookup network AS dstip OUTPUT dst_asn_org dst_category
| table _time srcip dstip proto sentbyte rcvdbyte dst_asn_org dst_category
| sort _time | head 5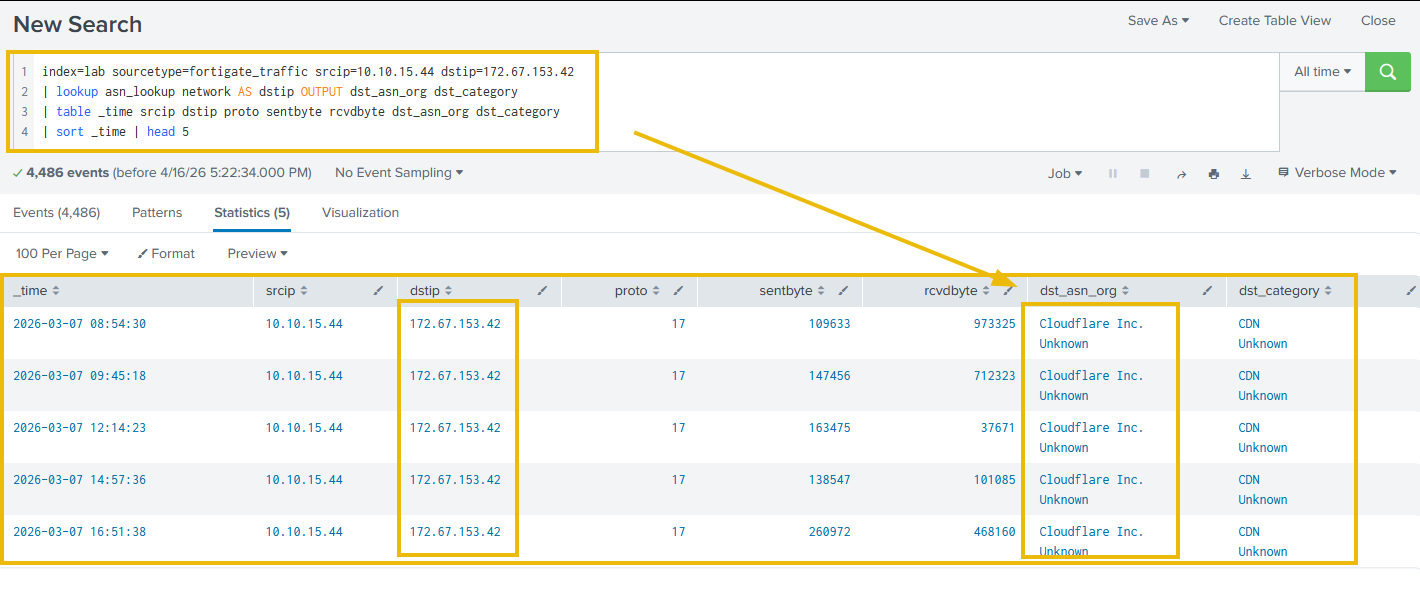
Looking at the output, 172.67.153.42 is identified as a Cloudflare CDN IP address. That single field explains why IP reputation returned clean. This address is shared infrastructure serving tens of millions of services simultaneously, which means we cannot block it, sinkhole it, or match it against reputation feeds. ASN enrichment tells us what type of infrastructure we are dealing with. To identify what is behind it, we need to look at how DNS traffic behaves, which is covered in the next section.
2) Behavioral Baselines
A CDN IP in isolation tells us nothing. What matters is the traffic pattern around it. Three signals can indicate C2 activity through CDN infrastructure. Each comes with caveats worth understanding before escalating:
- Beaconing regularity: Connections to the same CDN IP at fixed intervals with no corresponding user activity. Browsers do not generate metronomic outbound traffic to a single destination at consistent sub-minute intervals. This is the most reliable of the three signals.
- Asymmetric volume: High outbound byte counts without proportional inbound responses. A CDN serving legitimate content returns substantially more data than it receives. C2 exfiltration inverts this ratio. This signal produces false positives in environments with significant upload activity, such as backup or file sync services, so it should be combined with beaconing frequency before escalation.
- Off-hours persistence: Connections continuing overnight or during hours when the host user is inactive. Legitimate CDN requests follow user sessions; C2 beacons are indifferent to whether anyone is logged in. Confirming which process is responsible at scale requires Sysmon EventID 3 deployed across the estate. Without it, we can see something is beaconing, but cannot attribute it to a specific process.
Now, let's look at whether any of these signals are present in the connection from our opening alert:
Search Query:
index=lab sourcetype=fortigate_traffic srcip=10.10.15.44 dstip=172.67.153.42
| eval hour=strftime(_time,"%Y-%m-%d %H")
| stats count as per_hour min(sentbyte) as min_b max(sentbyte) as max_b by hour
| sort -per_hour | head 15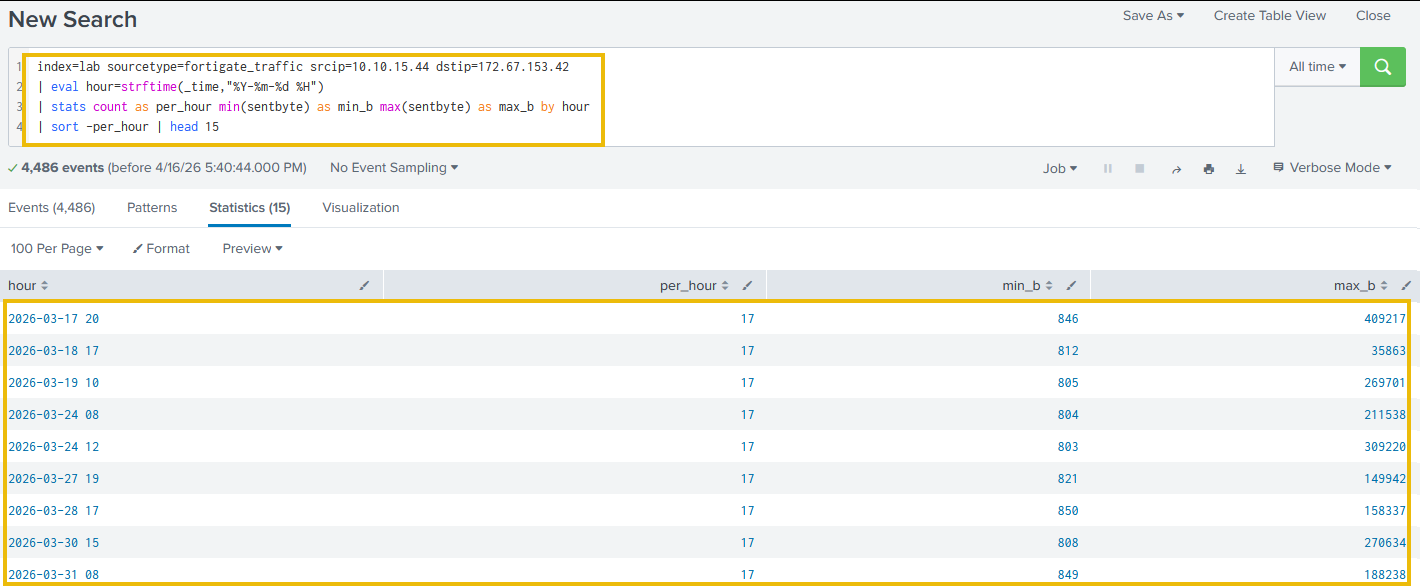
As we can see, 17 connections every hour, consistent across weeks. The min_b values sit in a tight band around 800 bytes: that is the beacon keepalive. The max_b spikes vary significantly, representing data bursts riding alongside the regular keepalive traffic. All three signals are present: fixed-interval beaconing, asymmetric volume spikes, and activity persisting well outside business hours. No browser produces this pattern.
A note on jitter: Cobalt Strike lets operators set a jitter percentage on the beacon interval. A 240-second beacon with 25% jitter fires anywhere between 180 and 300 seconds, making a single connection look irregular. The hourly query above accounts for this: min_b and max_b capture the full spread within the hour, and the connection count stays stable regardless of how individual intervals shift. A jittered beacon at 240 seconds with 25% jitter still produces roughly 17 connections per hour. Where tighter analysis is needed, add stddev(sentbyte) as std_b to the query. A low standard deviation paired with a consistent hourly count tells us we are looking at automated tooling, with or without jitter applied.
Note on process attribution: Identifying the specific process responsible for this traffic requires endpoint telemetry, such as EventID 3, deployed on the host. Without it, we can see something is beaconing, but cannot determine what. Task 5 covers this in full.
Traditional CDN Detection: Enforced Internal
The most reliable traditional method for identifying what is behind a CDN IP is enforced internal . When all traffic routes through a corporate resolver, we can log every domain lookup along with its resolved IP address. A Cloudflare IP alone tells us nothing, but the query that preceded it tells us which domain was accessed, giving us the context we need to close the CDN triage gap.
The limitation: when a host switches to over HTTPS (covered in Task 4), those lookups are encrypted before they reach the internal resolver. The trail disappears, and behavioral signals become our next layer of detection.
How many connections in the Fortigate logs have a dst_category of Bulletproof Hosting?
Looking at the hourly beaconing results, What is the minimum min_b value in the hourly results, representing the beacon keepalive size in bytes?
 Our watches port 443, our intercepts , and the detection stack was built around . For years, that was the right foundation: ran over , everything flowed through ports our sensors understood, and the assumption held. That is no longer the case.
/3 runs over using the QUIC transport protocol. This is not just a change in how connections are established; it changes what our detection infrastructure can see. Signature rules written for silently miss QUIC sessions. inspection cannot touch traffic. filters scoped to /443 exclude it entirely. This is not a misconfiguration issue. We are watching the right port on the wrong transport.
What QUIC Is
QUIC is a transport protocol standardized in 9000 that replaces under /3. It runs over on port 443 with 1.3 built in. There is no separate handshake to inspect. As of 2025, approximately 35% of global web traffic uses /3. Every major browser and CDN supports it by default.
What Breaks
signatures on /443. A rule written as alert TCP any any -> any 443 will never fire on a QUIC connection. The protocol is UDP, so the rule silently misses it. To better understand, let's run the following search query:
Search Query:
index=lab sourcetype=zeek_conn "id.resp_p"=443
| eval transport=if(proto="udp","QUIC (UDP/443)","HTTPS (TCP/443)")
| stats count by transport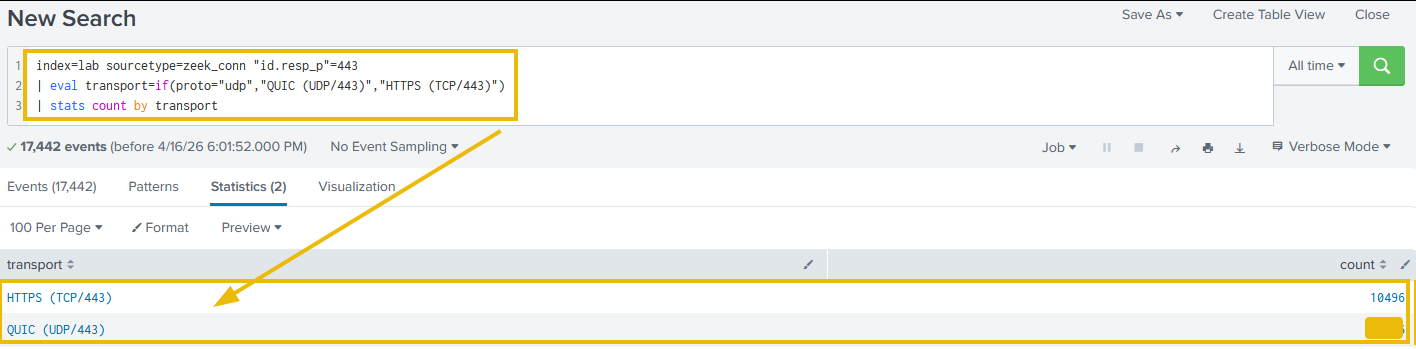
As shown in the output, approximately 22% of all traffic on port 443 is QUIC. That means an alert TCP rule is silently missing nearly a quarter of all encrypted outbound sessions, without a single alert firing.
Proxy inspection. Enterprise web proxies terminate connections to perform TLS inspection. QUIC runs over UDP. It bypasses the proxy entirely. We are inspecting the fallback while QUIC sessions go uninspected.
Detecting QUIC
The most reliable signal here is straightforward: UDP/443 in our flow logs means QUIC. No other common enterprise application uses /443.
At the firewall, we work through four steps:
- Log all
protocol=UDP, dst_port=443flows - Enrich the destination with ASN context
- Investigate any session destined for a non-CDN, non-cloud IP
- Flag sessions with unusually long duration or high outbound volume
Now let's run the following search query to look for QUIC sessions showing the kind of duration and volume that no browser would produce:
Search Query:
index=lab sourcetype=zeek_conn service=quic
| lookup asn_lookup network AS "id.resp_h" OUTPUT dst_asn_org dst_category
| where duration > 3600
| table _time "id.orig_h" "id.resp_h" duration orig_bytes resp_bytes dst_asn_org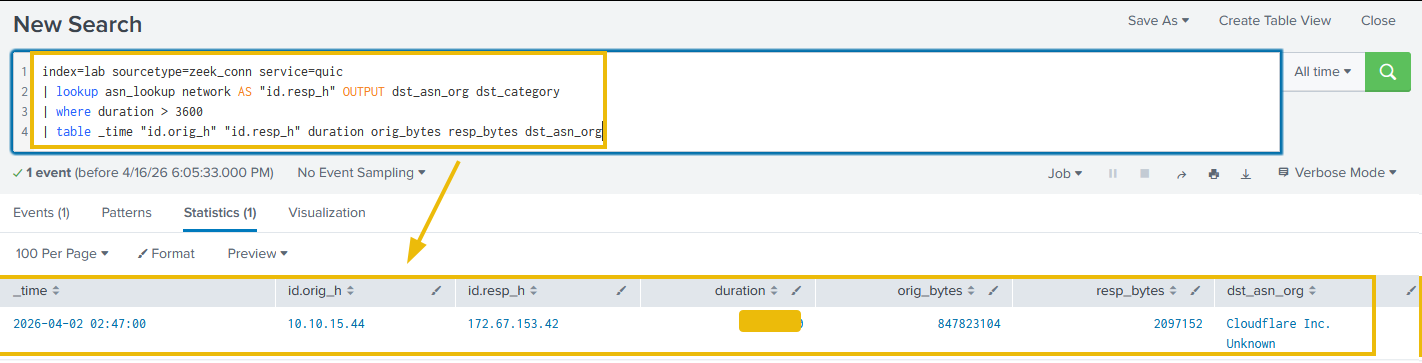
Looking at the output, one session stands out immediately: 4 hours 12 minutes, 847 MB outbound, 2 MB inbound. The destination is CDN, but the duration and byte asymmetry are not typical of browser behavior. This is the alert from Task 1. The reason there was no proxy log for it: it was QUIC, not TCP.
Detection and Mitigation
Before making any policy change, check whether our security platform already supports QUIC inspection. Palo Alto Networks, Fortinet, and Check Point have added QUIC parsing to their NGFW and IPS platforms. If our platform can inspect UDP/443 natively, we tune the existing ruleset to cover QUIC. The same policy applied to TCP/443 also applies to UDP/443, and inspection coverage is restored with no impact on user traffic.
If our platform does not support QUIC inspection, we face a genuine trade-off. QUIC now carries roughly 35% of global web traffic, so blocking UDP/443 is not a casual decision. That said, in environments where all encrypted traffic must pass through a proxy for inspection, allowing uninspected QUIC sessions is the worst of the two options. Every major browser negotiates QUIC via the Alt-Svc (Alternative Service) header and falls back to /2 over automatically when /443 is unreachable. Users see no broken sites. The trade-off is a small latency increase on sessions that would have used QUIC. Where full visibility is a hard requirement, blocking outbound /443 is a well-understood policy deployed across many enterprise environments.
Run the transport breakdown query. How many port 443 sessions in the Zeek logs use QUIC (UDP/443)?
Run the anomalous QUIC session query. What is the duration in seconds of the session that exceeds one hour?
used to be one of the most reliable detection signals we had. Every domain lookup arrived in plaintext on /53: readable, correlatable, loggable. Then over HTTPS arrived, encrypting those queries within standard HTTPS. Shortly after, Encrypted Client Hello encrypted the one field in the handshake that still revealed the destination hostname.
Between them, over HTTPS (DoH) and Encrypted Client Hello (ECH) removed two signals analysts had relied on for decades. This task covers what each protocol does to our visibility and the detection techniques that compensate for it.

Part a: Over HTTPS
Why Used to Be So Useful
Every domain lookup crossed the network in cleartext on /53. That gave analysts: beaconing detection via query intervals, DGA pattern matching on NXDOMAIN spikes, real-time threat feed matching, sinkholing, and a full audit trail of every domain a host ever contacted.
The SolarWinds breach (SUNBURST, December 2020 (opens in new tab)) compromised approximately 18,000 organizations. Investigators identified the malware, in part, through logs. SUNBURST encoded victim identifiers into DGA subdomain queries at 120-minute intervals. With DoH, that detection path is significantly harder.
What DoH Does to Visibility
DoH ( 8484 (opens in new tab)) encrypts queries inside HTTPS, sending them directly to an external resolver such as 1.1.1.1 or 8.8.8.8. From the network, it looks identical to any other HTTPS request. What disappears: C2 detection via DNS timing, DGA detection, threat feed matching, DNS sinkholing, and the DNS audit trail.
The Silent Host Pattern
When a workstation switches to DoH, it stops appearing in UDP/53 logs entirely. A host that generated hundreds of DNS queries per day for months and then produces zero is a detectable anomaly, even though we can no longer see what it is resolving.
Let's look across all internal hosts and find any that have gone silent:
Search Query:
index=lab sourcetype=zeek_conn "id.resp_p"=53 proto=udp
| timechart span=1d count by "id.orig_h"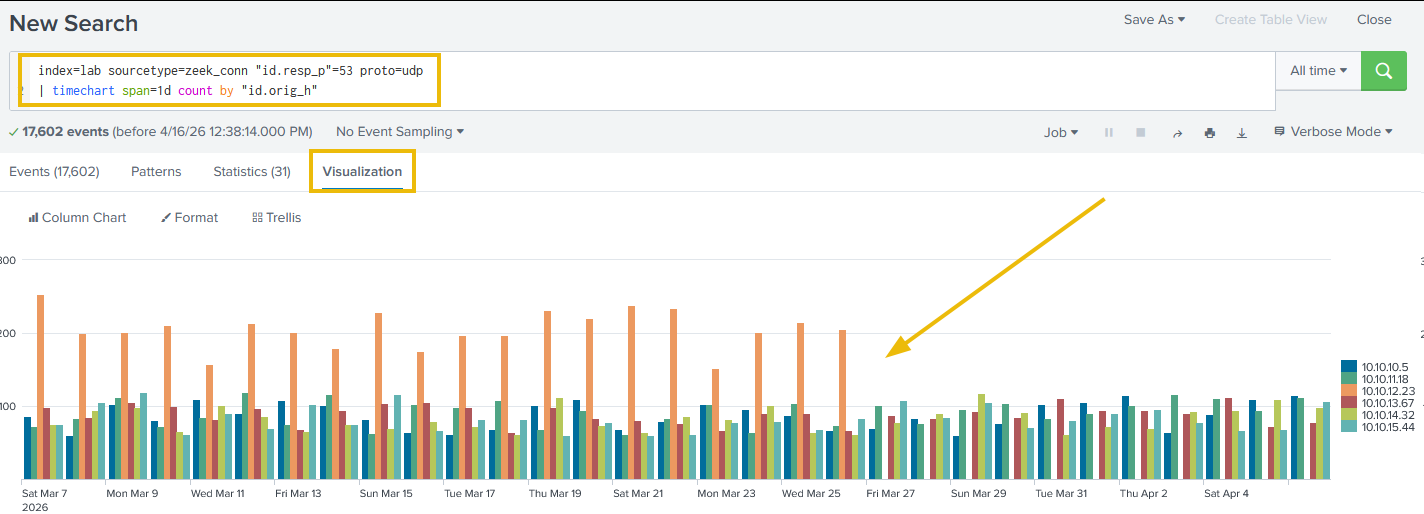
Looking at the time chart, every internal workstation shows consistent daily traffic, except one. After March 26, 10.10.12.23 (WKST-MKTG-07) drops to zero and stays there. Let's narrow it to that host and confirm the exact switch date:
Search Query:
index=lab sourcetype=zeek_conn "id.orig_h"="10.10.12.23" "id.resp_p"=53 proto=udp
| timechart span=1d count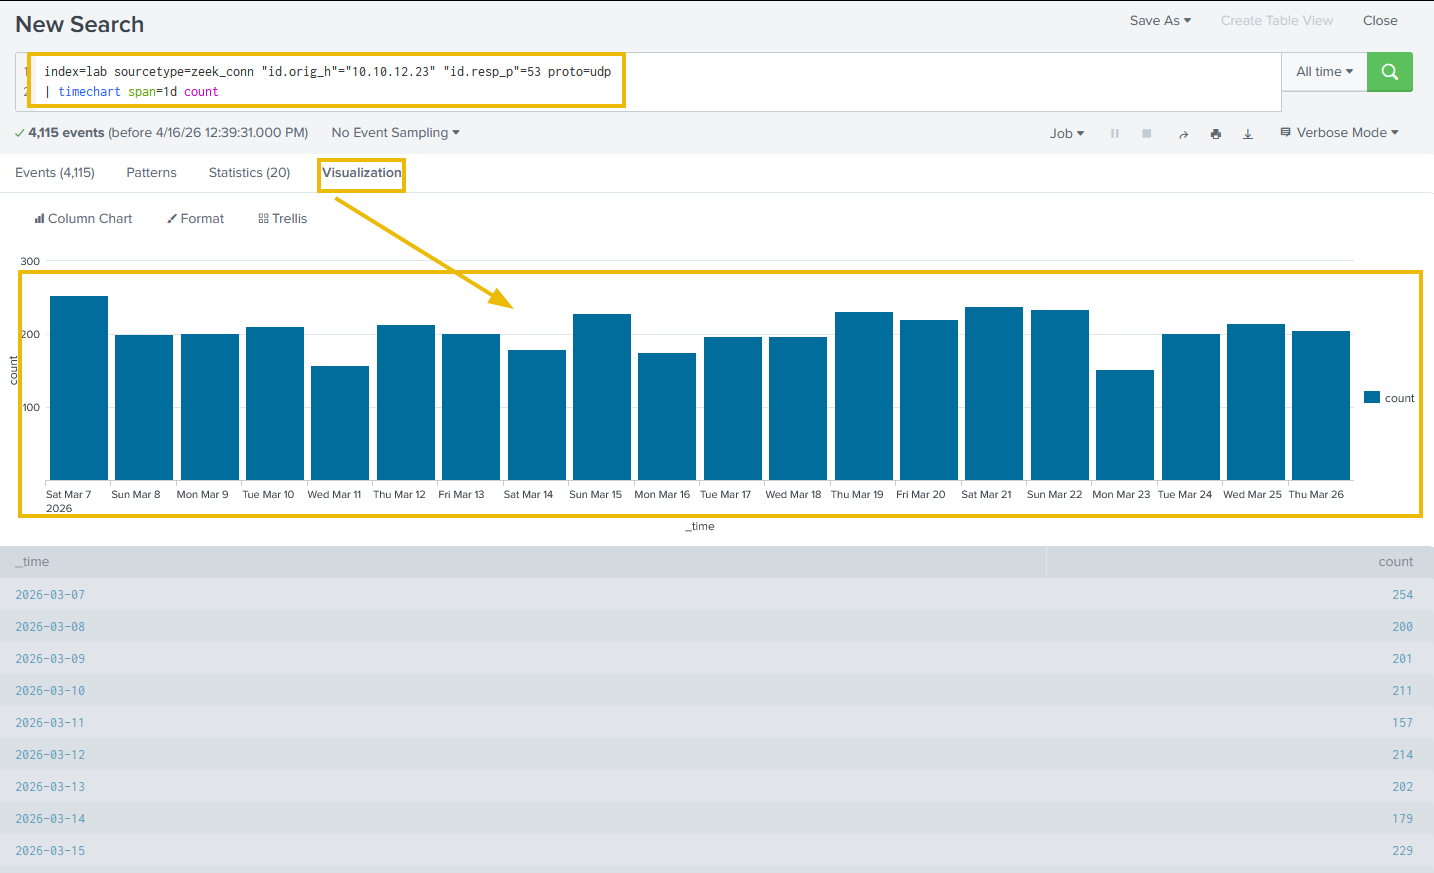
As we can see, WKST-MKTG-07's /53 traffic drops completely from March 27, pinpointing the exact date DoH took over on this host. Now let's confirm DoH is actually what replaced it:
Detection and Mitigation: Monitor Known DoH Resolver IPs
When /53 stops, TCP/443 connections to known DoH resolvers (1.1.1.1, 8.8.8.8, 9.9.9.9, or 149.112.112.112) should appear in its place. Let's check:
Search Query:
index=lab sourcetype=zeek_conn "id.orig_h"="10.10.12.23" "id.resp_p"=443
| search "id.resp_h"="1.1.1.1" OR "id.resp_h"="8.8.8.8"
| timechart span=1d count by "id.resp_h"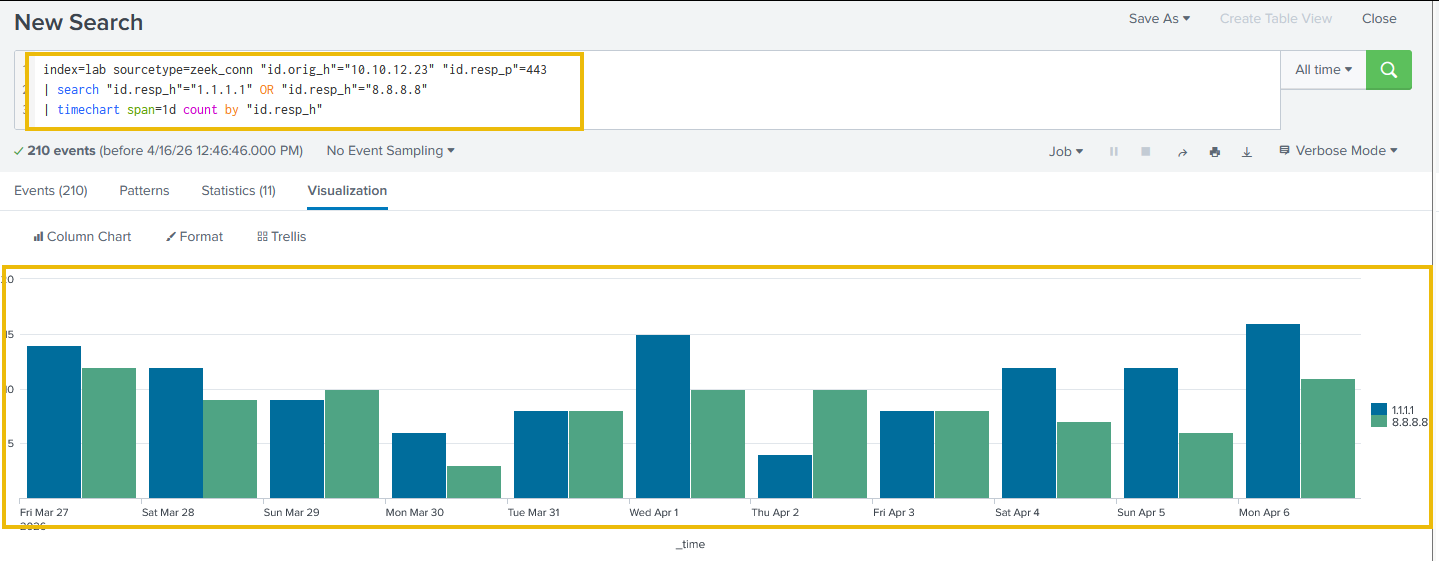
Looking at the output, connections to 1.1.1.1:443 appear from March 27 onwards, with zero before that date. The two signals confirm each other: /53 drops exactly when /443 to Cloudflare DoH begins. This confirms DoH is in use. It does not show us what the host is resolving. Those lookups are now encrypted. The only remaining path to hostname visibility on this host is endpoint telemetry.
Part b: Encrypted Client Hello (ECH)
TLS Server Name Indication (SNI) historically sent the destination hostname in plaintext during the TLS handshake, even in encrypted sessions. Security teams relied on this for URL filtering, threat feed matching, and traffic classification.
ECH (RFC draft (opens in new tab)) encrypts the entire ClientHello, including SNI. A network observer now sees only the destination IP and port. The hostname is gone. Cloudflare has enabled ECH by default across its network, covering roughly 20% of global web traffic.
Working Around the Blind Spot
- JA4 fingerprinting: Fingerprints the TLS handshake parameters instead of the hostname. Consistent across a malware family, even when SNI is hidden.
- Certificate Transparency logs: Every certificate is publicly logged. Query
crt.shwith a suspected IP or domain to find the hostname even when ECH hides it. - Endpoint telemetry: The process knows what it requested. EventID 22 captures lookups before they are encrypted.
Run the all-hosts DNS timechart below. On what date does WKST-MKTG-07 (10.10.12.23) first appear with zero UDP/53 queries? (Answer Format: YYYY-MM-DD)
From the DoH confirmation query results, how many total DoH connections does WKST-MKTG-07 make on 2026-03-27 across both resolvers?
We have a alert: a suspicious IP, byte counts, and a timestamp. When the investigation needs to answer which process on this host initiated this connection, none of that is sufficient. logs have never carried that answer.
Which source we reach for first determines whether the investigation moves forward or stalls. Let's examine each log source against the specific question it can answer, and be clear about where each one stops.
The Fidelity-Scalability Trade-off
Every log source sits somewhere between two opposing properties: fidelity (how complete the information is) and scalability (how practical it is to retain and query at enterprise scale).
Raw captures every byte of every packet, but is expensive to store beyond short retention windows. records are tiny by comparison, but they cannot show us what was in the payload. Selecting the right source means knowing where each one sits on this spectrum.
| Log Source | What It Answers | Fidelity | Scalability |
|---|---|---|---|
| / | Who talked to whom, when, how long, how much data | Flow metadata only | Enterprise-scale: years of retention practical |
| FortiGate / NGFW logs | Was the connection allowed? What URL? Which user? | URL, user, policy decision | Managed: dependent on /SSL inspection |
| EventID 3 | Which process on which host initiated this connection? | Process-attributed, full endpoint context | Requires deployment on each host |
| Raw | What were the exact bytes exchanged? | Maximum: full payload | Impractical beyond short retention windows |
| enrichment layer | What do we know about the destination IP? | Context appended at query time | No additional storage cost |
Matching Sources to Questions
Let's examine the key investigative questions and the log sources that answer each one.

The Same Connection Through Four Lenses
Let's see these differences in practice. We will use the suspicious connection from Task 3: WKST-FINANCE-04 (10.10.15.44) to 172.67.153.42. We will query it across four sourcetypes. Each answers a different investigative question and also has a ceiling.
The Firewall View
Let's start with the FortiGate. Was this connection allowed, and what are the flow basics?
Search Query:
index=lab sourcetype=fortigate_traffic srcip=10.10.15.44 dstip=172.67.153.42
| table _time srcip dstip dstport proto sentbyte rcvdbyte duration action
| sort _time | head 10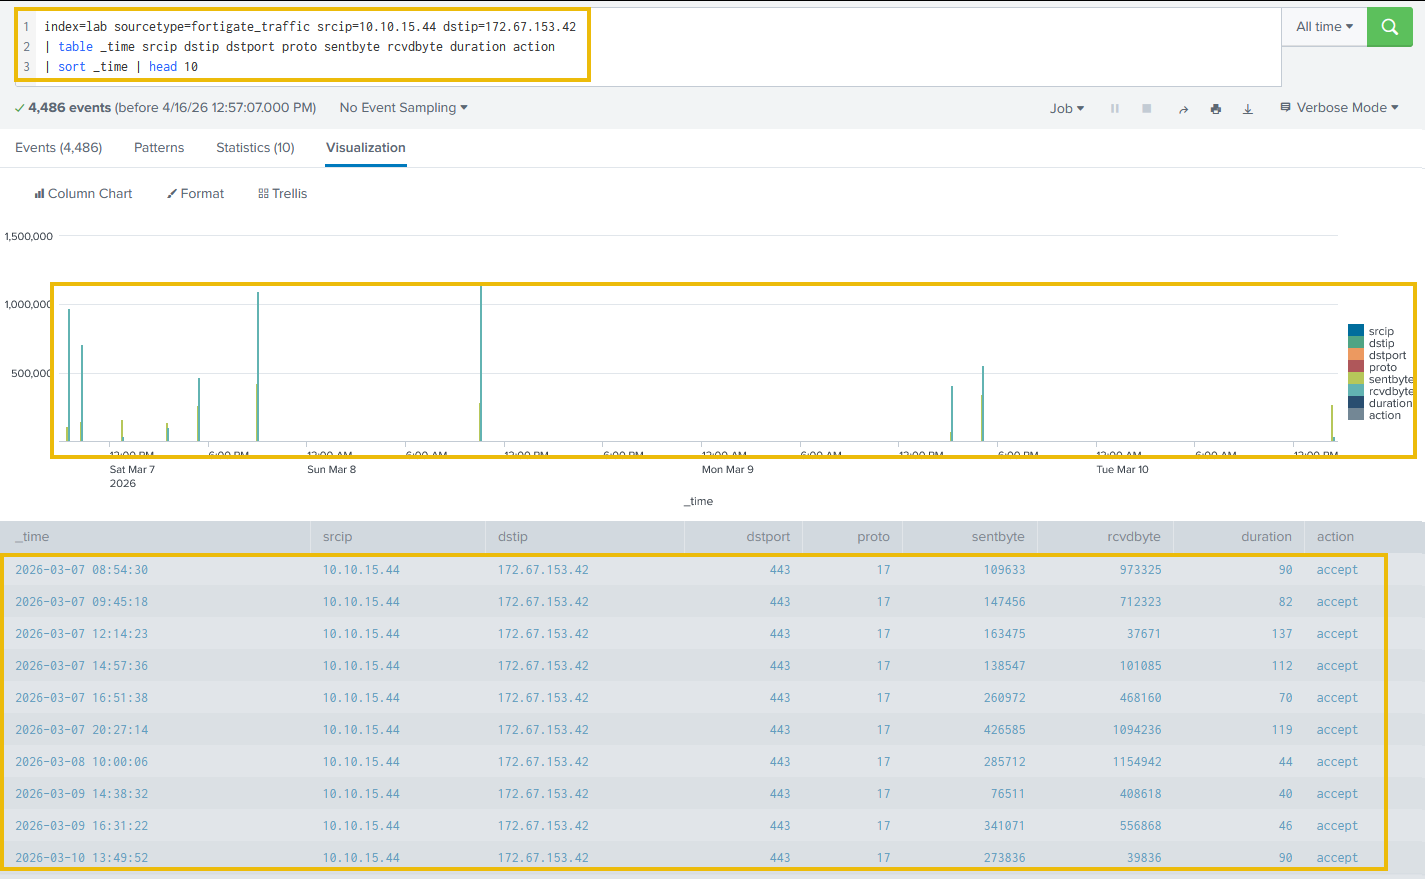
As we can see, UDP (proto 17) on port 443 is accepted by policy, with a rate of 1 every 4 minutes from March 17. The FortiGate confirms that the connection exists and provides byte counts and the protocol. It cannot tell us which process is responsible.
The NetFlow View
NetFlow gives us independent corroboration: a second source confirming the flow from a different network vantage point.
Search Query:
index=lab sourcetype=netflow src_ip=10.10.15.44 dst_ip=172.67.153.42
| table _time src_ip dst_ip dst_port protocol bytes_out bytes_in duration
| sort _time | head 10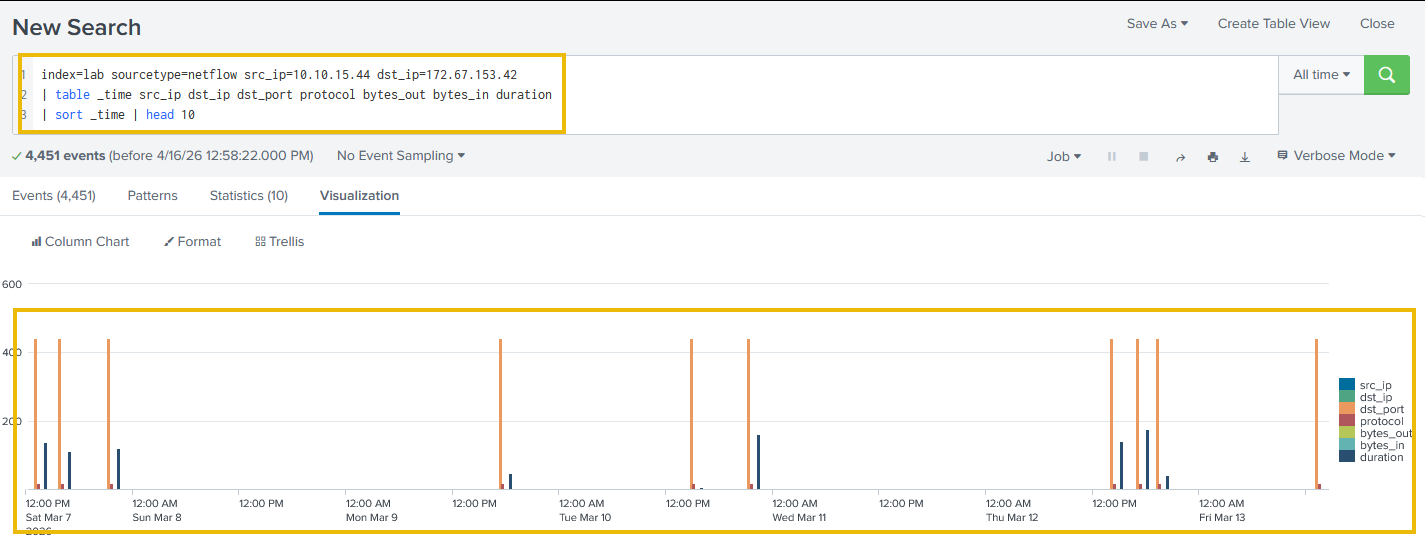
Looking at the output, the result is structurally identical to the FortiGate: on port 443, consistent byte counts, repeating every four minutes. Two independent network-layer sources agree. Neither moves us closer to process attribution. That question cannot be answered solely from network-layer data.
The Zeek View
Zeek gives us something FortiGate and cannot: application-layer protocol identification. Both previous sources confirmed the presence of a flow on port 443. Zeek tells us what that flow actually is.
Search Query:
index=lab sourcetype=zeek_conn "id.orig_h"="10.10.15.44" "id.resp_h"="172.67.153.42"
| table _time "id.orig_h" "id.resp_h" proto service duration orig_bytes resp_bytes
| sort _time | head 10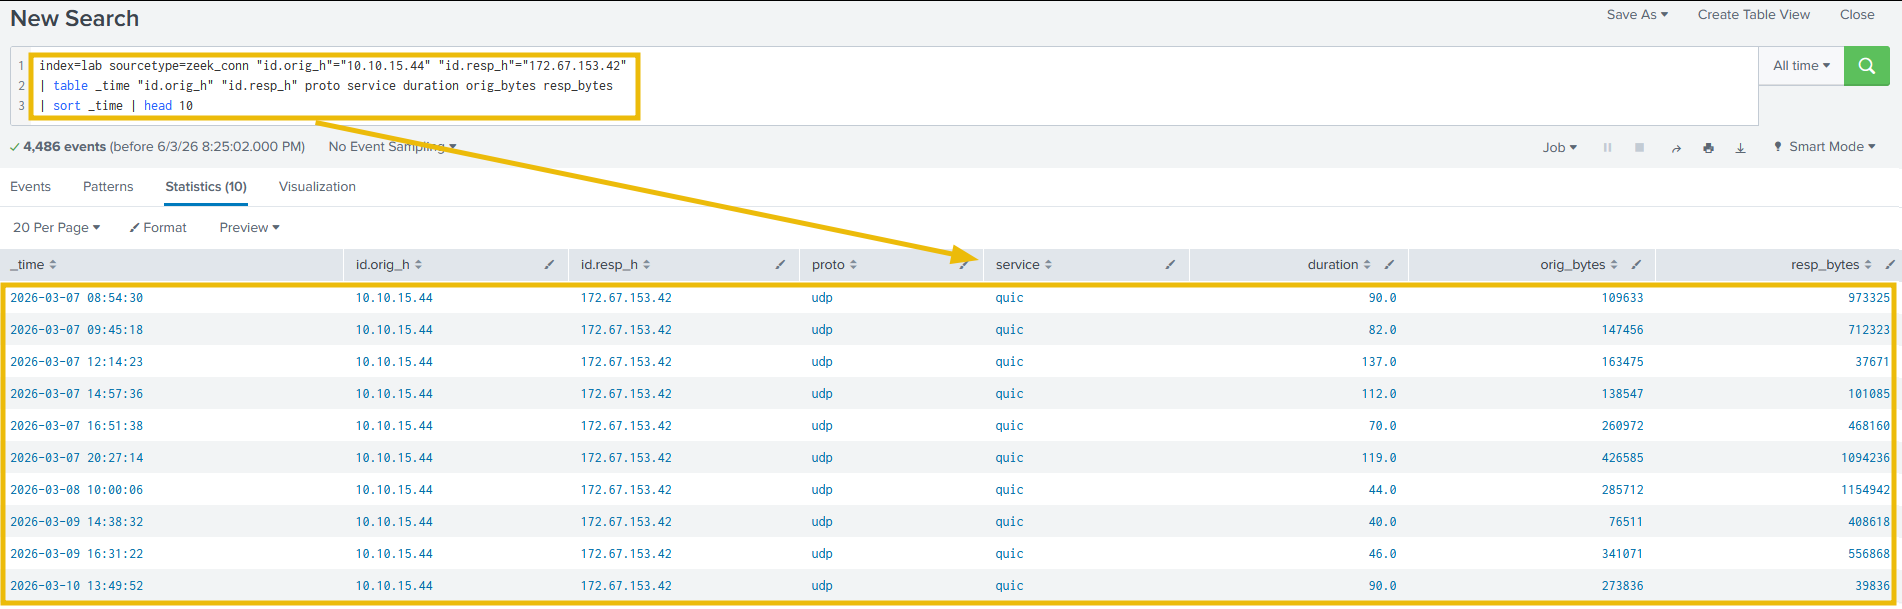
Looking at the output, the service field returns quic across every session, and proto confirms UDP throughout. This answers a question the previous two sources left open: there is no proxy log for this connection because QUIC runs over UDP and bypasses proxy inspection entirely. Three network-layer sources now agree on the flow. Zeek is the first to tell us what transport it is running on.
The Sysmon View
Sysmon EventID 3 is the process-attributed network connection log. Every TCP and UDP connection generates a record containing the process name (Image), PID, parent process (ParentImage), and full connection details. These fields do not exist anywhere in the network layer.
The query structure for process attribution:
index=lab sourcetype=sysmon SourceIp=10.10.15.44 DestinationIp=172.67.153.42
| table _time SourceIp DestinationIp DestinationPort Image ProcessId ParentImage
| sort _time | head 10
The Image field returns the full path to the process executable. ProcessId stays consistent for the lifetime of a process. A single PID appearing across hundreds of records spanning multiple days tells us the same process has been running continuously. ParentImage tells us what launched it: a browser launched by explorer.exe is expected; a script interpreter launched by a document application is not.
To surface which process is responsible for the most connections to a given destination:
index=lab sourcetype=sysmon DestinationIp=172.67.153.42
| stats count by Image
| sort -count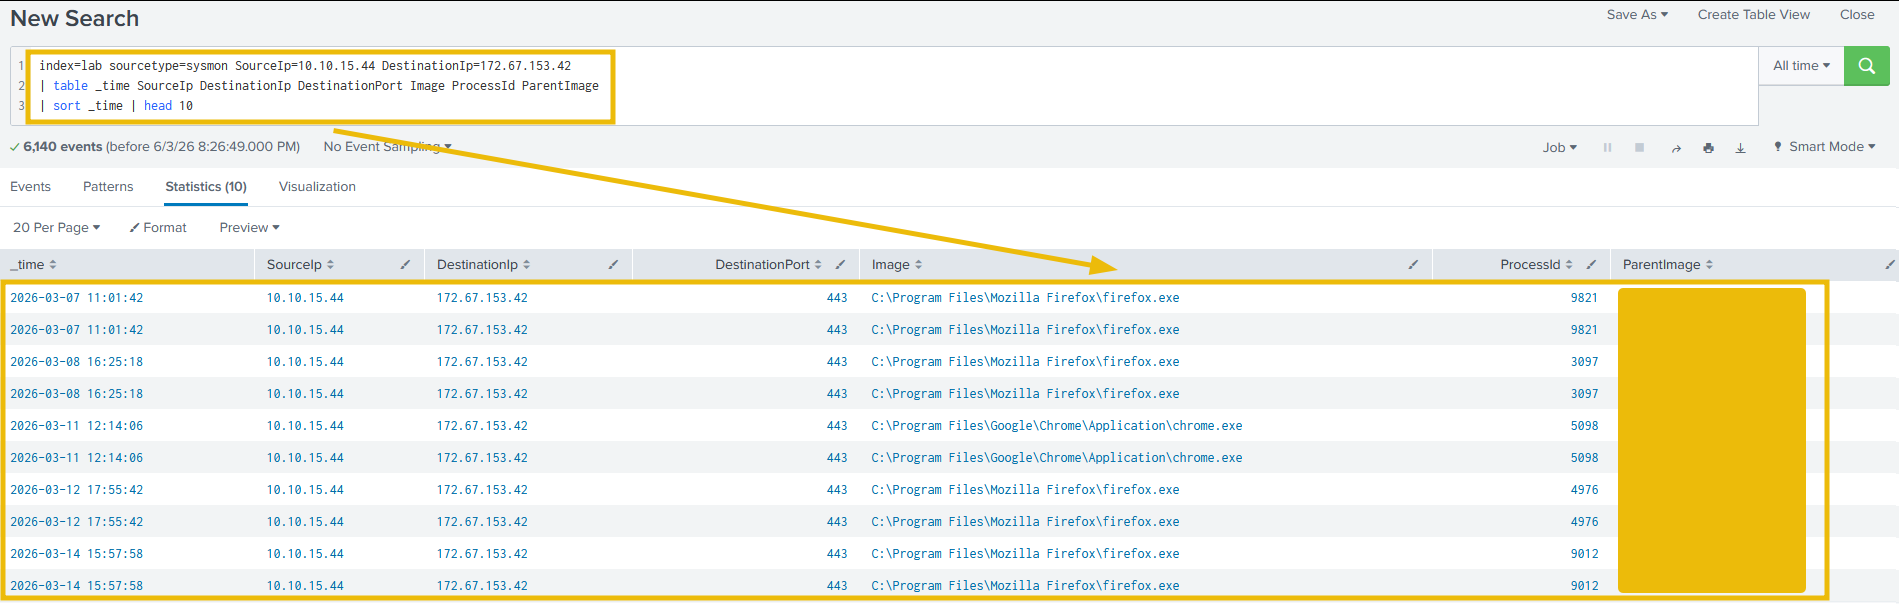
The count comparison is the signal. Browser processes making incidental CDN hits show tens of connections. A process running automated outbound connections shows thousands of connections. The volume gap between the two draws our attention. We apply both of these queries in Task 7, where they surface the pivotal finding of the WKST-FINANCE-04 investigation.
Note: EventID 3 is only available if is deployed on the endpoint. In practice, many large organizations have on fewer than 20% of their estate. Knowing which investigative paths close when is absent is part of working the hierarchy effectively.
Run the process count query against 172.67.153.42. Which process is responsible for the most connections to this destination?
 The connection is to
 185.220.101.34, and we are seconds away from closing the ticket. Every threat intelligence feed returns the same result: no malware associations, no C2 history, no blocklist entries. That IP belongs to AS205100, F3 Netze e.V., a Tor relay operator. One enrichment field is enough to move this ticket from routine closure to immediate escalation. The data was in the logs; the context was what we lacked.
ASN enrichment adds that context at query time, not at ingestion. A FortiGate log from six months ago can be enriched with intelligence we only have today, with no re-ingestion required.
ASN Categories Reference
Enrichment results only make sense if we know what each category means. The table below maps categories to analyst actions.
| Category | Examples | Analyst Action |
|---|---|---|
| CDN | Cloudflare (AS13335), Fastly (AS54113), Akamai (AS16625), CloudFront (AS16509) | Baseline check only. IP-based triage is not useful here. |
| Cloud Provider | AWS (AS16509), Azure (AS8075), GCP (AS15169) | Determine specific service if volume or behavior is anomalous. |
| DNS Resolver | Cloudflare DoH (AS13335 1.1.1.x), Google DNS (AS15169 8.8.x.x) | Confirm whether the host should use an external DNS server. |
| Bulletproof Hosting | Stark Industries Solutions (AS44477) | Immediate escalation. Routinely associated with malware hosting and phishing infrastructure. |
| Tor Exit / Anonymization | F3 Netze e.V. (AS205100) | Immediate escalation. Employee workstations should not route traffic through Tor exit relays. |
The distinction between CDN and Bulletproof Hosting is not about whether the IP address is known to be bad. It is a statement about the type of organization operating it. Traffic to Cloudflare is expected; traffic to Stark Industries requires explanation.

Running ASN Enrichment Against the FortiGate Logs
Let's start by establishing the baseline traffic picture before we look for anomalies:
Search Query:
index=lab sourcetype=fortigate_traffic
| lookup asn_lookup network AS dstip OUTPUT dst_asn dst_asn_org dst_category dst_risk
| stats count by dst_category dst_risk
| sort -count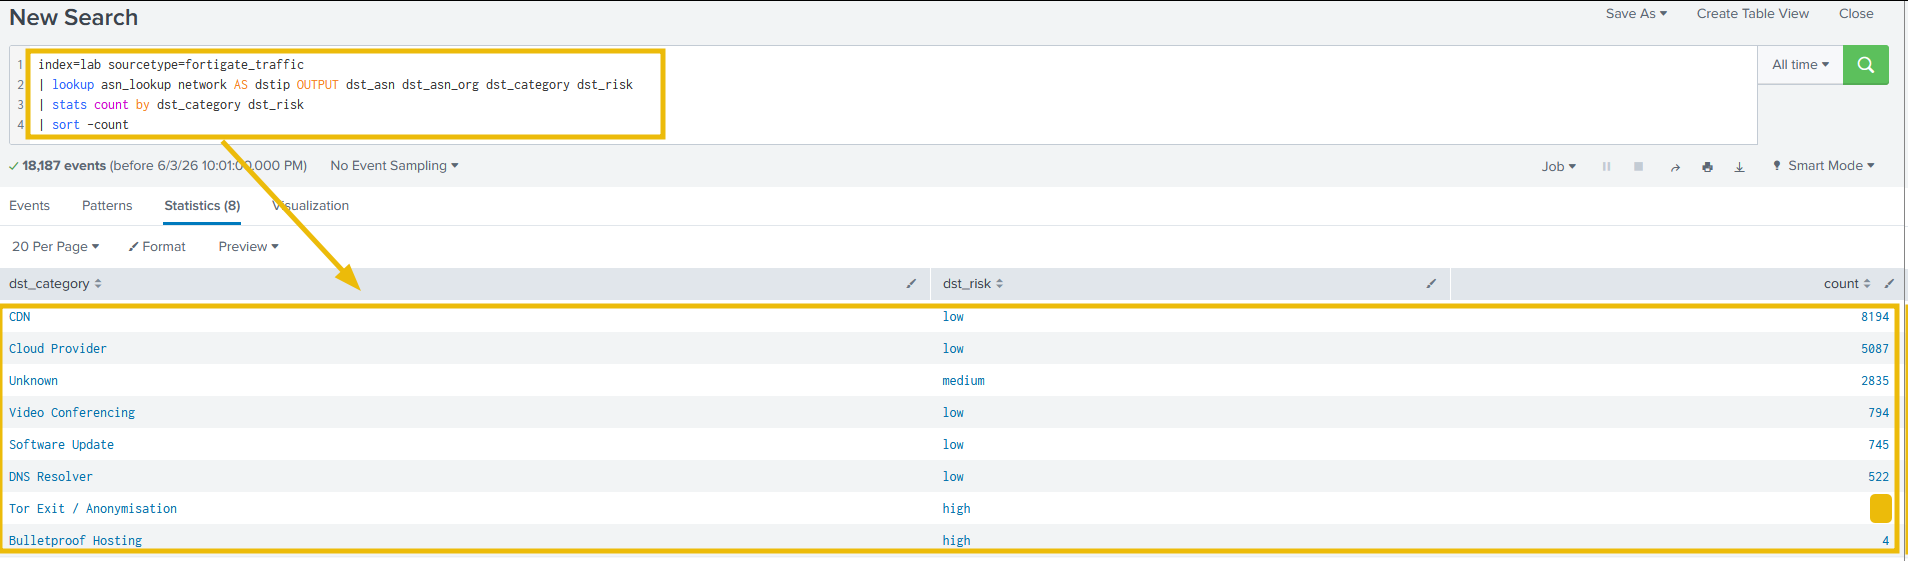
Looking at the output, CDN and cloud dominate as expected. The Bulletproof Hosting and Tor connections stand out immediately: both IPs pass reputation checks, but the ASN category classification surfaces them for what they are.
Step 2: Filter to High-Risk Destinations Only
Now let's cut through the noise and isolate only the connections that require analyst attention:
Search Query:
index=lab sourcetype=fortigate_traffic
| lookup asn_lookup network AS dstip OUTPUT dst_asn dst_asn_org dst_category dst_risk
| where dst_risk="high" OR dst_risk="critical"
| table _time srcip srcname dstip dstport proto sentbyte rcvdbyte dst_asn_org dst_category dst_risk
| sort _time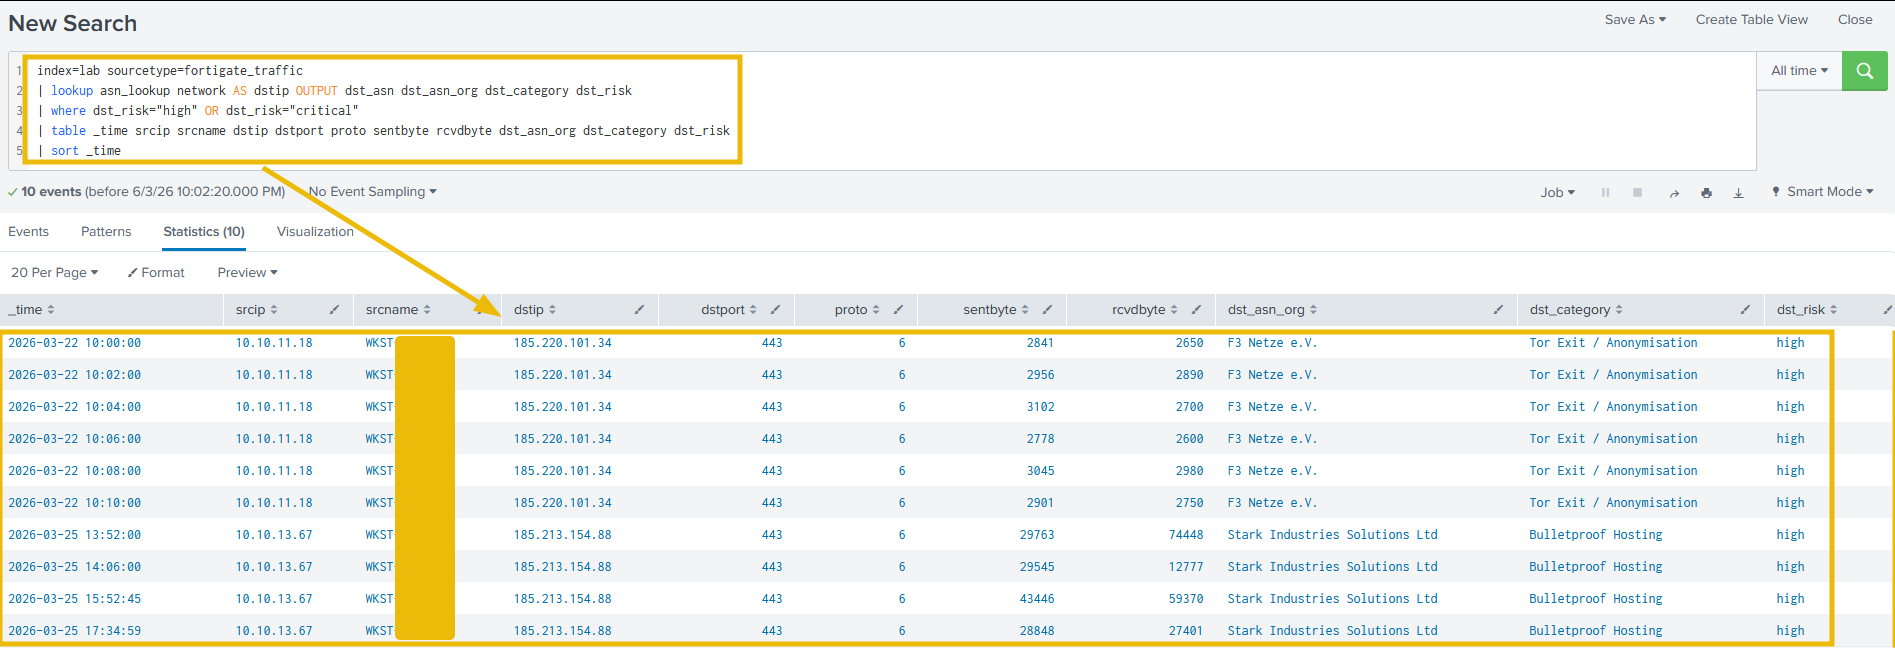
As we can see, two distinct incidents surface: 10.10.11.18 connecting to a Tor exit relay on March 22, and 10.10.13.67 connecting to Stark Industries on March 25. We went from a 17,000-row IP table to a two-incident triage list with a single query.
Step 3: Examine the Tor Exit Connections in Detail
Let's drill into the HR workstation's Tor connections and examine each session:
Search Query:
index=lab sourcetype=fortigate_traffic srcip=10.10.11.18 dstip=185.220.101.34
| table _time srcip dstip dstport proto sentbyte rcvdbyte duration
| sort _time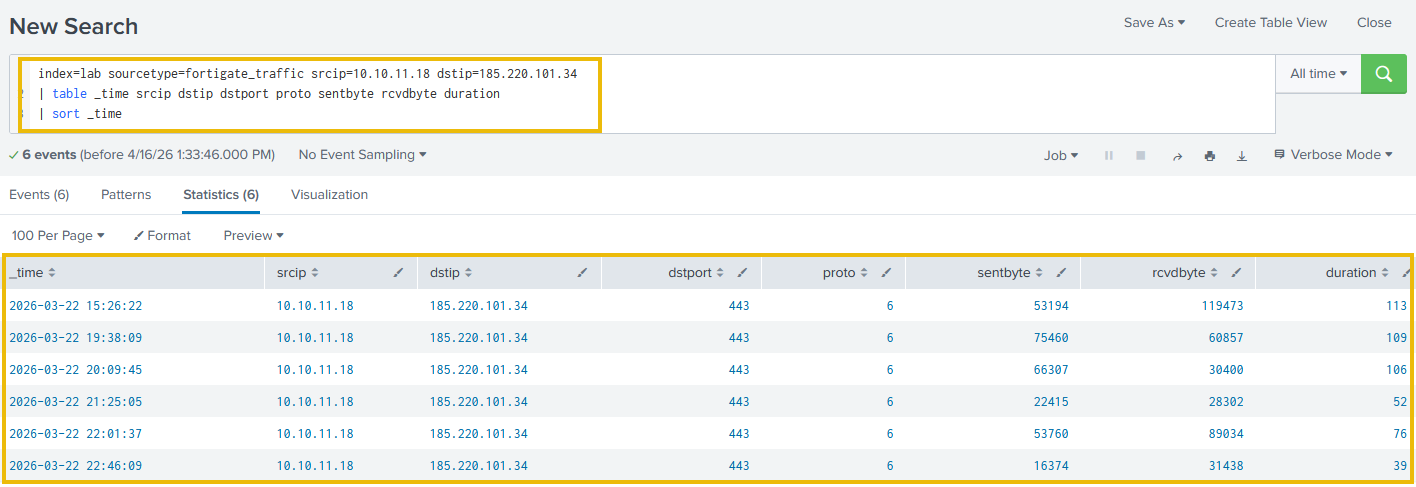
As we can see, these connections fire at regular two-minute intervals with consistent byte counts, which is consistent with automated tooling rather than manual browsing. An HR workstation connecting to a Tor exit relay at regular intervals requires immediate escalation, regardless of its reputation.
185.220.101.34 returns a clean reputation score from most threat intelligence feeds. It is not a flagged C2 IP and appears on no blocklist. The only reason this connection surfaces is ASN enrichment identifying F3 Netze e.V. as a Tor relay operator. Without that enrichment, it would have closed as a false positive.
Step 4: Examine the Bulletproof Hosting Connections
Now let's examine what WKST-SALES-11 was doing with Stark Industries:
Search Query:
index=lab sourcetype=fortigate_traffic srcip=10.10.13.67 dstip=185.213.154.88
| table _time srcip dstip dstport proto sentbyte rcvdbyte duration
| sort _time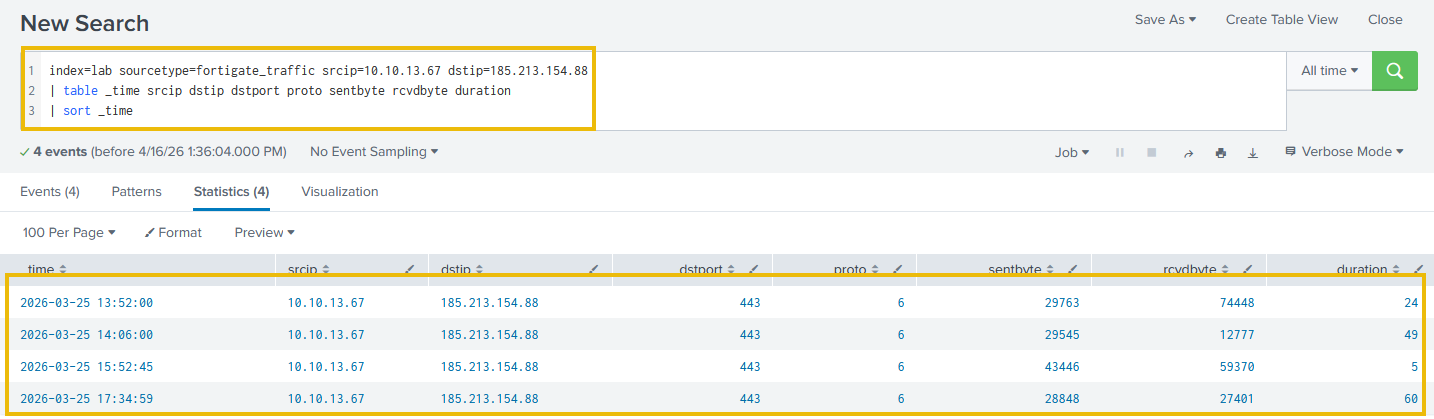
Looking at the output, there are four connections over one day on /443 to AS44477, a bulletproof hosting provider with a well-documented history in abuse reports. The connections are on port 443. A targeted capture or FortiGate application log review would be the next step to identify what was exchanged.
Run the baseline enrichment query. How many FortiGate connections resolve to a dst_category of Tor Exit / Anonymisation?
Run the high-risk filter query. What is the srcname of the workstation connecting to a Tor exit relay?
In Task 1, we left an alert open: sustained connections to a clean Cloudflare IP, 847 MB outbound, no record, no readable SNI. Each task since then has added another piece to the investigative toolkit. Now we close the case. Same host, sixteen days later. Work through the steps below in order.
The Alert
Alert: Large Outbound Transfer
Source:      10.10.15.44 (WKST-FINANCE-04)
Destination: 172.67.153.42:443
Protocol:    UDP
Bytes Out:   847 MB
Duration:    4h 12m
Time:        2026-04-02 02:47 UTC
No DNS record, no readable SNI, IP reputation clean. Let's begin.
Step 1: IP Reputation and ASN Check
Let's establish what we actually know about the destination IP:
Search Query:
index=lab sourcetype=fortigate_traffic dstip=172.67.153.42
| lookup asn_lookup network AS dstip OUTPUT dst_asn dst_asn_org dst_category dst_risk
| stats count by dstip dst_asn dst_asn_org dst_category dst_risk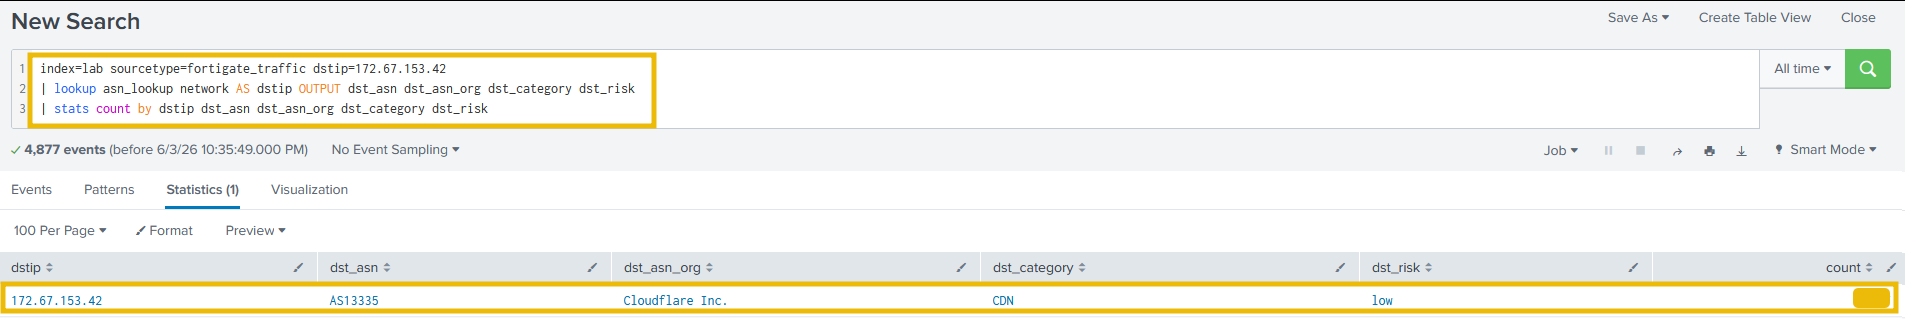
As we can see, this is Cloudflare infrastructure. Reputation returns clean because that is the correct result for a CDN serving millions of domains simultaneously. IP triage is closed, and we pivot to behavioral analysis.
Step 2: Full Connection History
Let's examine whether the April 2 transfer is an isolated event or part of a longer pattern:
Search Query:
index=lab sourcetype=fortigate_traffic srcip=10.10.15.44 dstip=172.67.153.42
| timechart span=1d sum(sentbyte) as daily_bytes_out count as daily_connections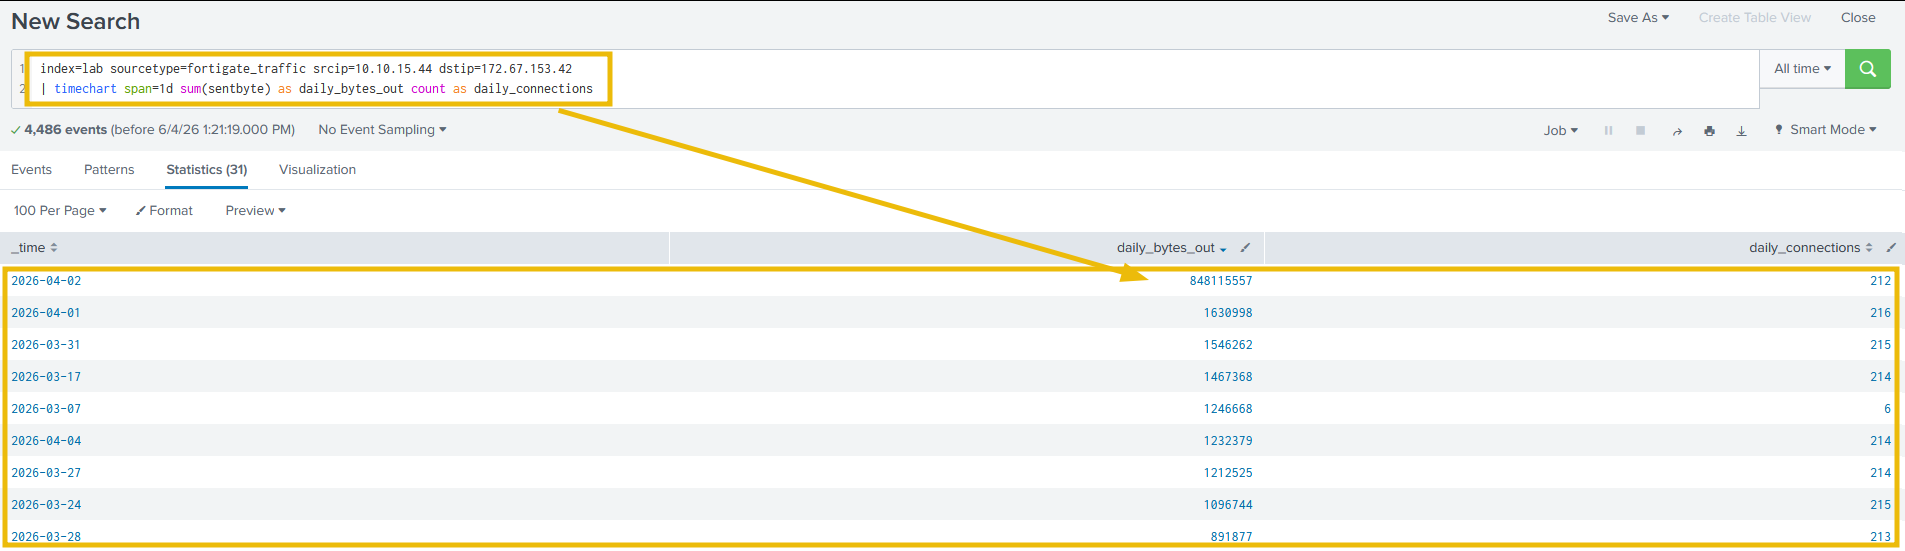
Looking at the output, consistent connections per day from March 17 with small byte counts, firing at regular sub-5-minute intervals throughout. On April 2, the daily total spikes to 848 MB. Beaconing began 16 days before the exfiltration event.
Step 3: Confirm the Exfiltration Event
Step 2 returned a daily total across all connections on April 2. To isolate the individual exfiltration event, let's filter to that day and sort by bytes sent to surface the largest connection first:
Search Query:
index=lab sourcetype=fortigate_traffic srcip=10.10.15.44 dstip=172.67.153.42 earliest="04/02/2026:00:00:00" latest="04/03/2026:00:00:00"
| table _time srcip dstip dstport proto sentbyte rcvdbyte duration
| sort -sentbyte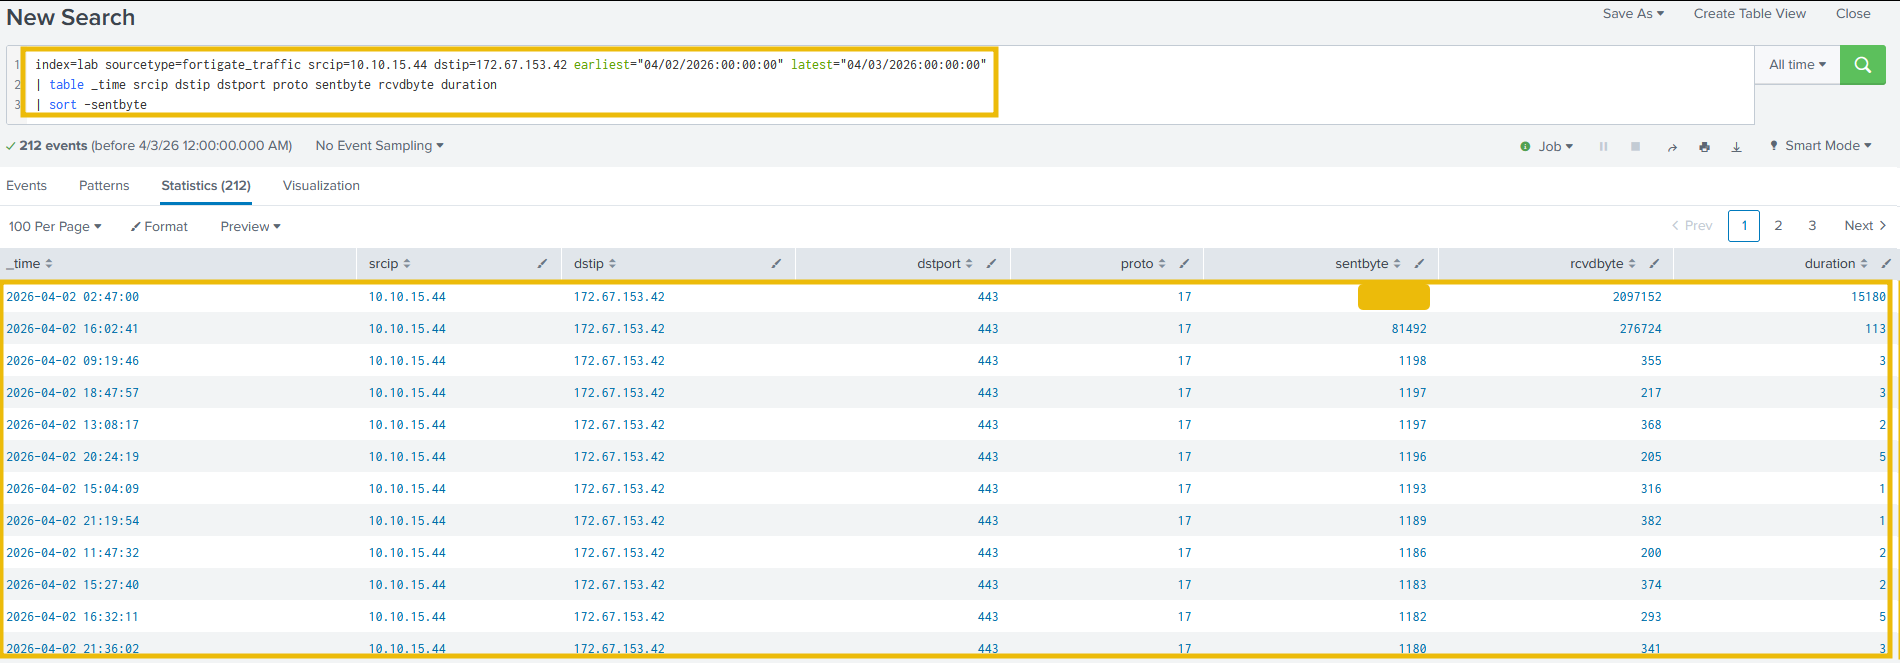
Looking at the output, all 212 connections on April 2 are returned. The top record is immediately identifiable: 2026-04-02 02:47 UTC, protocol 17 (UDP/QUIC), sentbyte 847 MB out, rcvdbyte 2,097,152 (2 MB in), duration 15,180 seconds (4 hours 12 minutes). The remaining 211 records show sentbyte values in the 1,100-1,200 byte range; these are the regular C2 beacon keepalives that continued to fire throughout the day. The contrast confirms the exfiltration event. The byte asymmetry is consistent with exfiltration. The next step is process attribution via Sysmon.
Step 4: Process Attribution via Sysmon
Two network-layer sources confirmed that the connection exists. Neither can tell us what is generating it. Let's query Sysmon:
Search Query:
index=lab sourcetype=sysmon SourceIp=10.10.15.44 DestinationIp=172.67.153.42
| stats count by Image ProcessId
| sort -count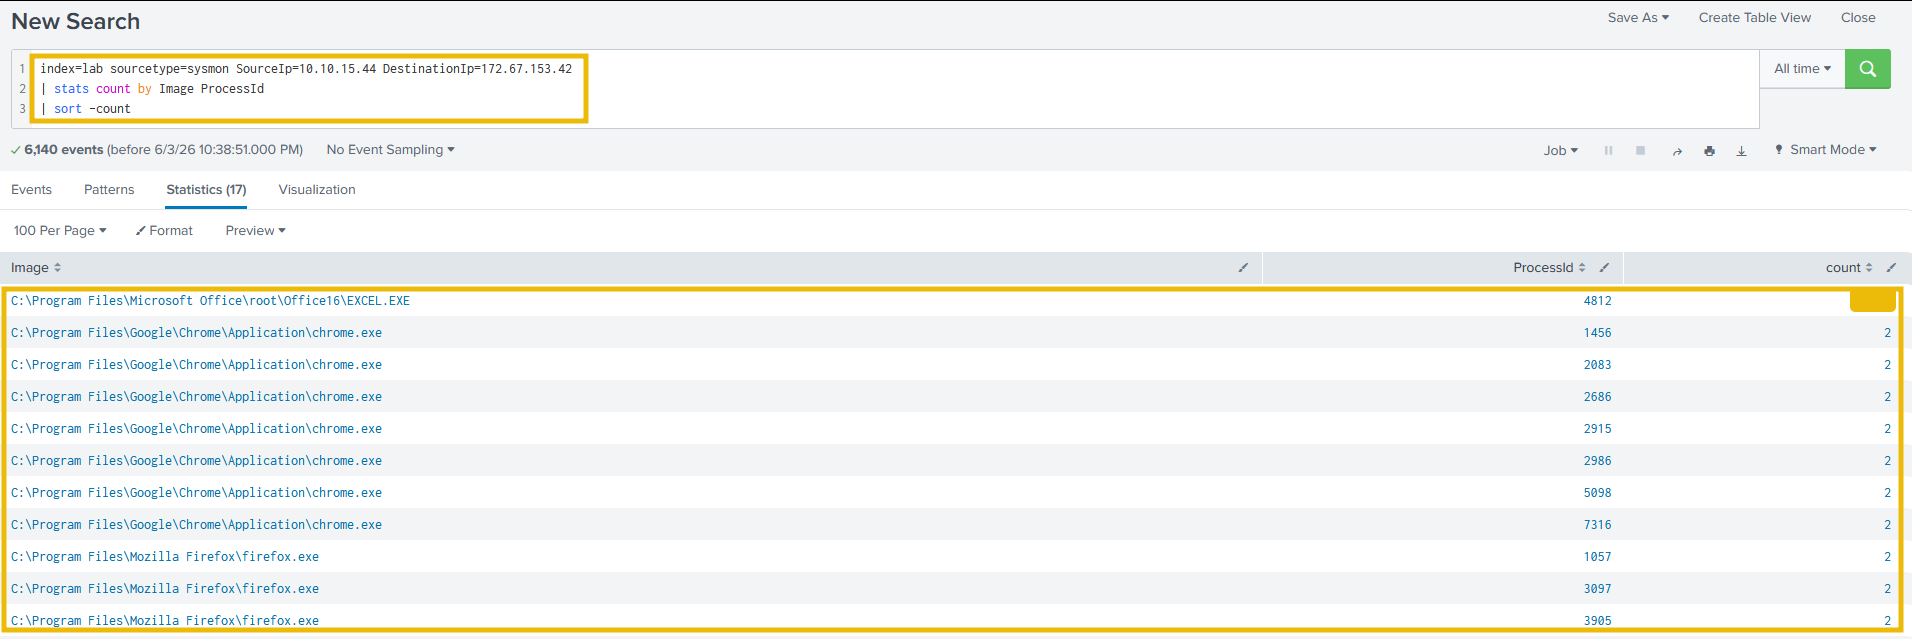
Looking at the output, EXCEL.EXE ( 4812) accounts for 6,000+ connections, far more than any other process. Chrome and Firefox appear across multiple process IDs, each with just 2 connections, consistent with incidental browsing activity hitting the same Cloudflare IP. The gap between 6,000+ and 2 is the signal.
Now let's confirm this process was active continuously across multiple days:
Search Query:
index=lab sourcetype=sysmon SourceIp=10.10.15.44 DestinationIp=172.67.153.42
| bin _time span=1d
| stats count by _time Image ProcessId
| where match(Image, "EXCEL.EXE")
| sort _time
| head 5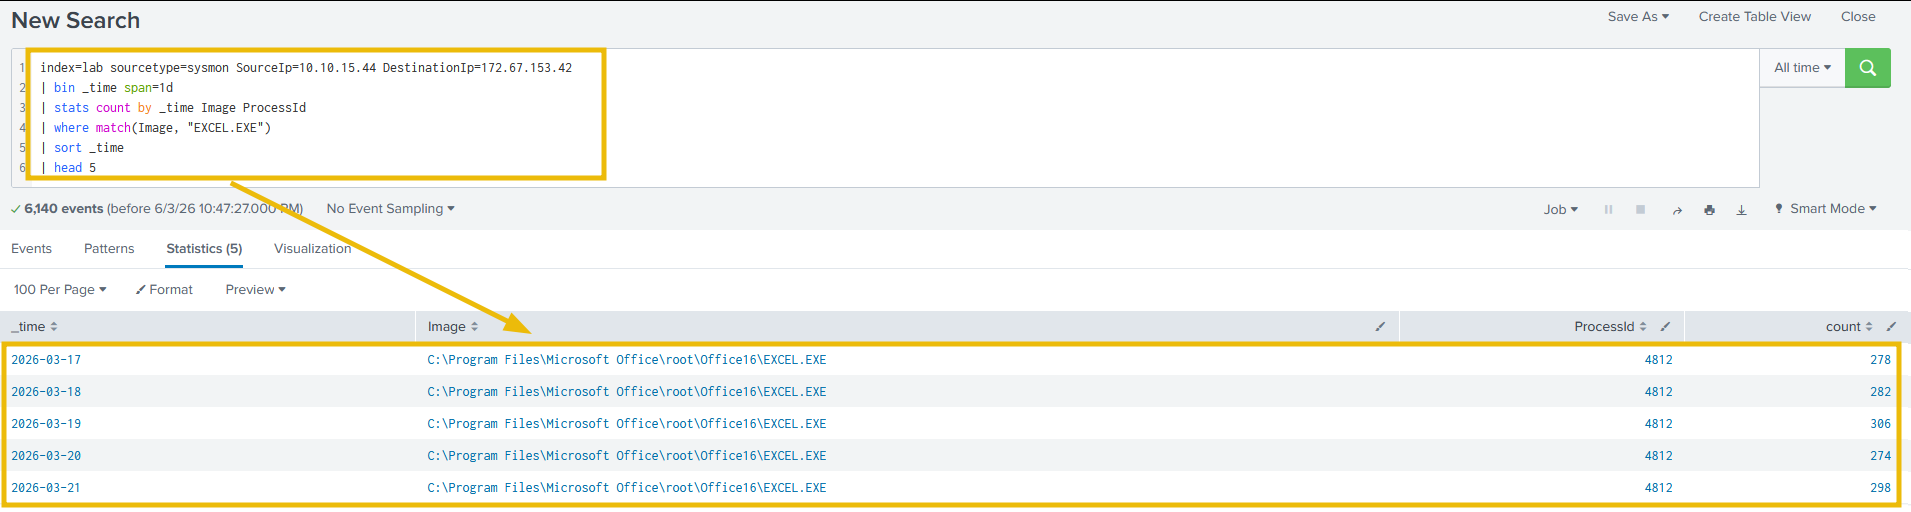
As we can see, PID 4812 consistently made connections from March 17 onward, with daily counts in the 270-310 range. Microsoft Excel is not a QUIC client. A legitimate session does not beacon at machine-clock regularity for 16 days. This is the pivotal finding: only told us what was responsible.
Step 5: Confirm QUIC Transport in Zeek
Let's validate the transport protocol from a second independent source:
Search Query:
index=lab sourcetype=zeek_conn "id.orig_h"="10.10.15.44" "id.resp_h"="172.67.153.42"
| stats count by proto service duration
| sort -count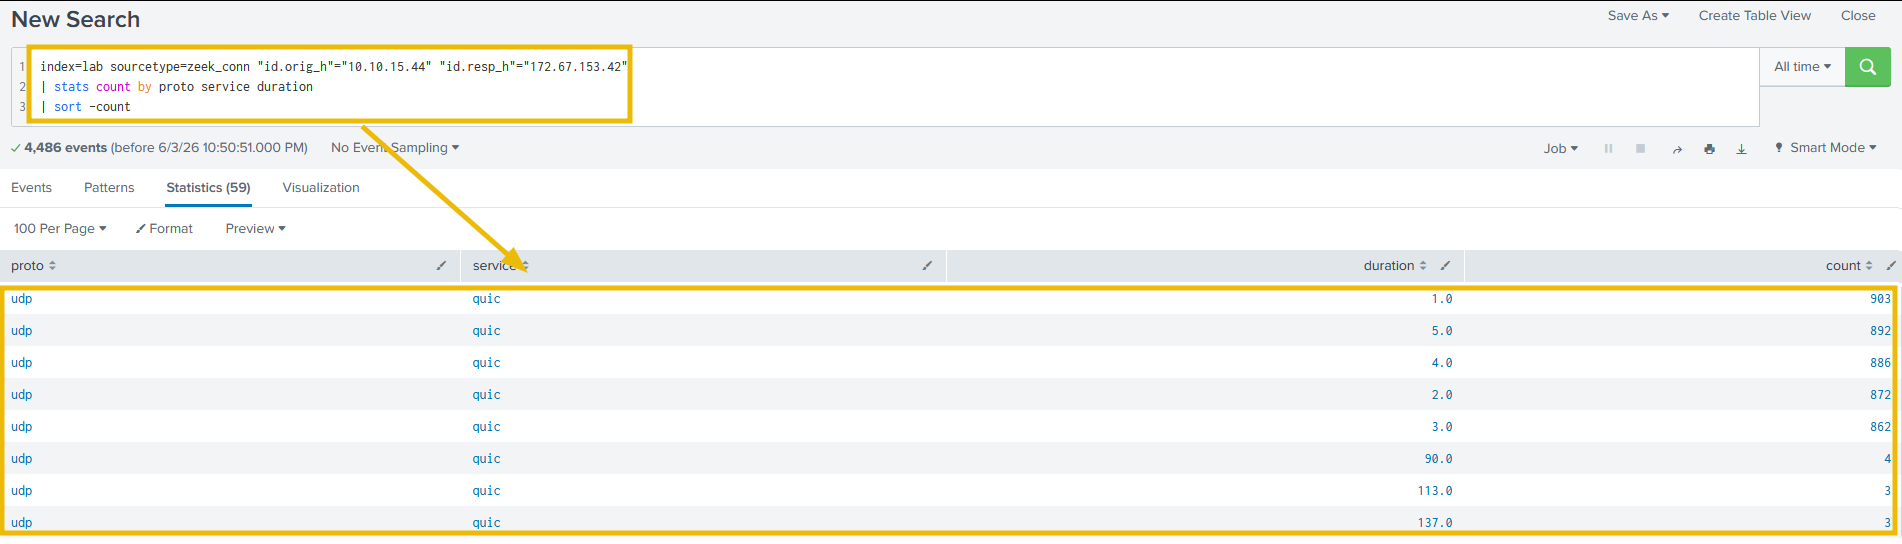
Looking at the output, independently confirms QUIC across every session. The single largest extended session in the results is the April 2 exfiltration. QUIC bypassed proxy inspection entirely, which is why no proxy log exists for any of these sessions.
Step 6: Check for DNS Queries From WKST-FINANCE-04
Why was there no DNS record in the original alert? Let's answer it in two steps.
First, let's confirm whether this host uses DNS at all:
Search Query:
index=lab sourcetype=zeek_conn "id.orig_h"="10.10.15.44" "id.resp_p"=53 proto=udp
| timechart span=1d count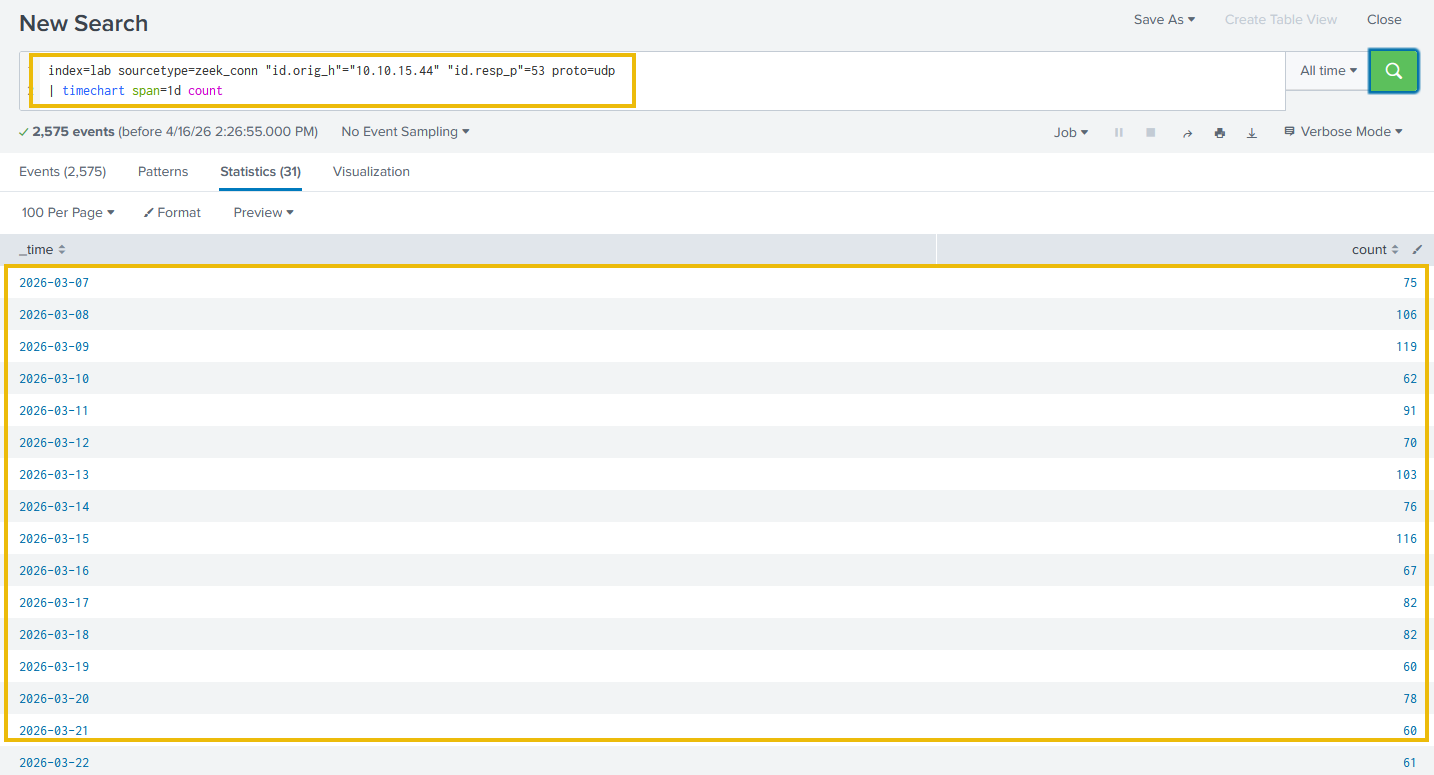
The output shows consistent /53 traffic across the dataset, with 60-120 queries per day. WKST-FINANCE-04 uses normally for its browsing activity. Now let's ask the more specific question: was 172.67.153.42 ever resolved via DNS?
Search Query:
index=lab sourcetype=zeek_dns "id.orig_h"="10.10.15.44"
| search answers="172.67.153.42" OR query="172.67.153.42"
Zero results. This host generates hundreds of queries per day, yet never looks up 172.67.153.42. The reason is straightforward: EXCEL.EXE is connected to the destination via a hardcoded IP address, with no hostname to resolve. DNS was bypassed entirely, which is why the original alert had no DNS record to investigate.
Step 7: How Long Has EXCEL.EXE (PID 4812) Been Running?
Let's calculate the precise compromise window:
Search Query:
index=lab sourcetype=sysmon Image="*EXCEL.EXE" ProcessId=4812 SourceIp=10.10.15.44
| stats min(_time) as first_seen max(_time) as last_seen count
| eval first_seen=strftime(first_seen,"%Y-%m-%d %H:%M:%S")
| eval last_seen=strftime(last_seen,"%Y-%m-%d %H:%M:%S")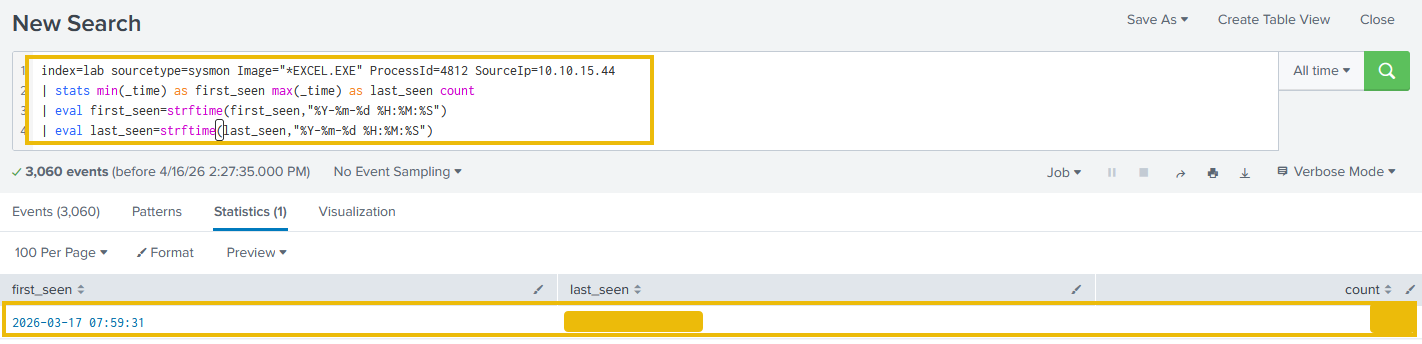
Looking at the output, 4812 has been running continuously for 16 days without a single restart. A macro-enabled workbook opened on the first_seen date established beaconing immediately and waited before executing the final exfiltration. The alert we responded to was not the start of this incident; it was the end.
How many bytes were transferred outbound in the April 2 exfiltration event?
Run the process count query. How many connections does EXCEL.EXE make to 172.67.153.42?
What is the last_seen timestamp for EXCEL.EXE (PID 4812)?
Investigation Summary
| Step | Data Source | Finding |
|---|---|---|
| 1. IP / ASN | FortiGate + ASN Lookup | AS13335 (Cloudflare). Clean reputation. CDN. |
| 2. Connection History | FortiGate time chart | Beaconing from March 17, every 4 min, for 16 days |
| 3. Exfil Event | FortiGate | April 2 02:47 , 847 MB, /QUIC |
| 4. Process Attribution | EventID 3 | EXCEL.EXE 4812, 3,060 connections over 16 days |
| 5. Transport | QUIC confirmed. bypass confirmed. | |
| 6. Check | No /53 from host. DoH in use. | |
| 7. | 4812 active March 17 to April 2, 16 days without restart |
Assessment: Confirmed data exfiltration via QUIC through Cloudflare CDN infrastructure. EXCEL.EXE (PID 4812) beaconed every 4 minutes from March 17 and exfiltrated 847 MB on April 2 at 02:47 UTC, running for 16 days without restarting. There was no DNS record, no proxy log, and no SNI. The investigation succeeded only because Sysmon was deployed on WKST-FINANCE-04.
Extracted IOCs
| Indicator Type | Value | Context |
|---|---|---|
| Internal Host | 10.10.15.44 (WKST-FINANCE-04) | Compromised host |
| C2 IP | 172.67.153.42 | Cloudflare-proxied C2 |
| C2 ASN | AS13335 | Cloudflare, Inc. |
| Malicious Process | EXCEL.EXE (PID 4812) | C2 beaconing and exfiltration via QUIC |
| Process Path | C:\Program Files\Microsoft Office\root\Office16\EXCEL.EXE |
Responsible for 3,060 connections over 16 days |
| Beacon Interval | 240 seconds (4 minutes) | Active from March 17, 2026 |
| Exfil Event | 2026-04-02 02:47 | 847 MB outbound |
| Transport | /443 (QUIC) | Bypassed ; missed by rules |
Room Summary
Modern networks have outpaced the monitoring assumptions on which most detection stacks were built. This room walked through why that happened and what an analyst can do about it.

Continue to complete the room.
Ready to learn Cyber Security?
TryHackMe provides free online cyber security training to secure jobs & upskill through a fun, interactive learning environment.
Already have an account? Log in