
Wazuh
Explore Wazuh: an all-in-one, free, and open-source security solution.
medium

To access material, start machines and answer questions login.
Welcome to a room showcasing the capabilities of the security platform. In this room, you can expect to learn the following things:
- What is and why is it a powerful unified security solution
- Where is used and how to navigate it
- Learning about rules and security alerts
- Digesting logs to view events on and Windows
- How you can extend using plugins and its
Firstly, let's understand what actually is. While it started as an -focused tool, has grown into a unified security platform that combines endpoint detection and response, event management, , and cloud security monitoring under one roof. It goes well beyond traditional by:
- Auditing devices for common vulnerabilities
- Monitoring for suspicious activity on the endpoints
- Visualising complex events into neat dashboards and graphs
- Providing compliance reporting for frameworks like , , and
Founded in 2015, (opens in new tab) is used across organisations of all sizes - from small businesses to large enterprises and government institutions. operates on a manager and agent model. Simply put, there is one server (manager) that stores and processes the data, and many hosts (agents) that send data to the manager. Let's look at this model in the diagram below:
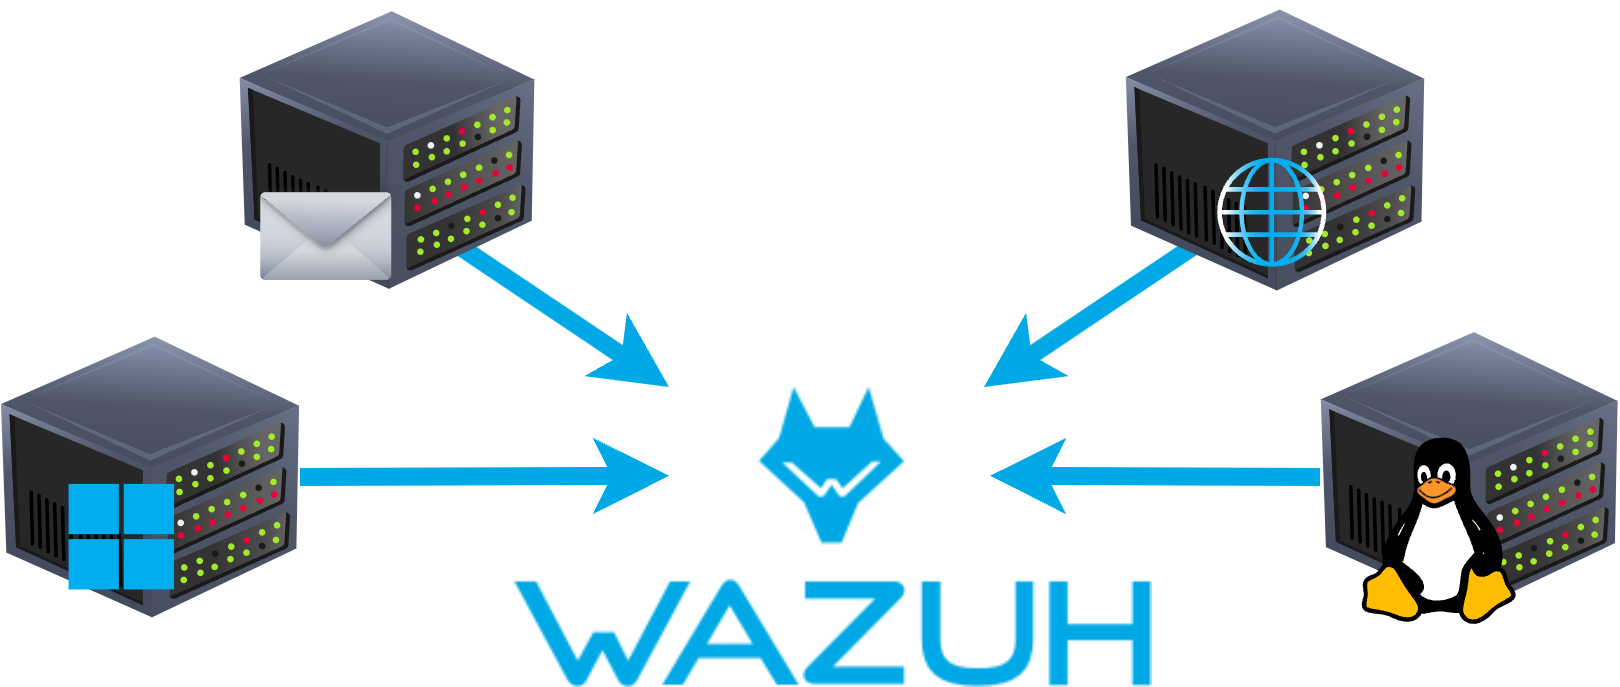
We can see logs from four Agents being sent to the server
What is the term that Wazuh calls a device that is being monitored for suspicious activity and potential security threats?
Lastly, what is the term for a device that is responsible for managing these devices?
Set up your virtual environment

Connect to the TryHackMe network and deploy the management server attached to this task and wait a minimum of five minutes before visiting the server on https://LAB_WEB_URL.p.thmlabs.com (opens in new tab).
If you load the management server too early, it will say " Server is not ready yet" Please wait a few more minutes before refreshing the page and trying again. Once it has started, log in using the following credentials:
Username: (make sure that this is lowercase!)
Password: eYa0M1-hG0e7rjGi-lRB2qGYVoonsG1K
Select "Global Tenant" after successfully logging in. Refer to the animated GIF below of the process if you are stuck.
Note: The questions within the tasks of this room will expect the data stored on this management server, so it is vital that you are able to connect to this server before continuing.
The management server in this room will show the agents as being disconnected - this is expected.
Login to the Wazuh management server by following this link (opens in new tab) before proceeding.
Devices that record the events and processes of a system are called agents. Agents monitor the processes and events that take place on the device, such as authentication and user management. Agents will offload these logs to a designated collector for processing, such as .
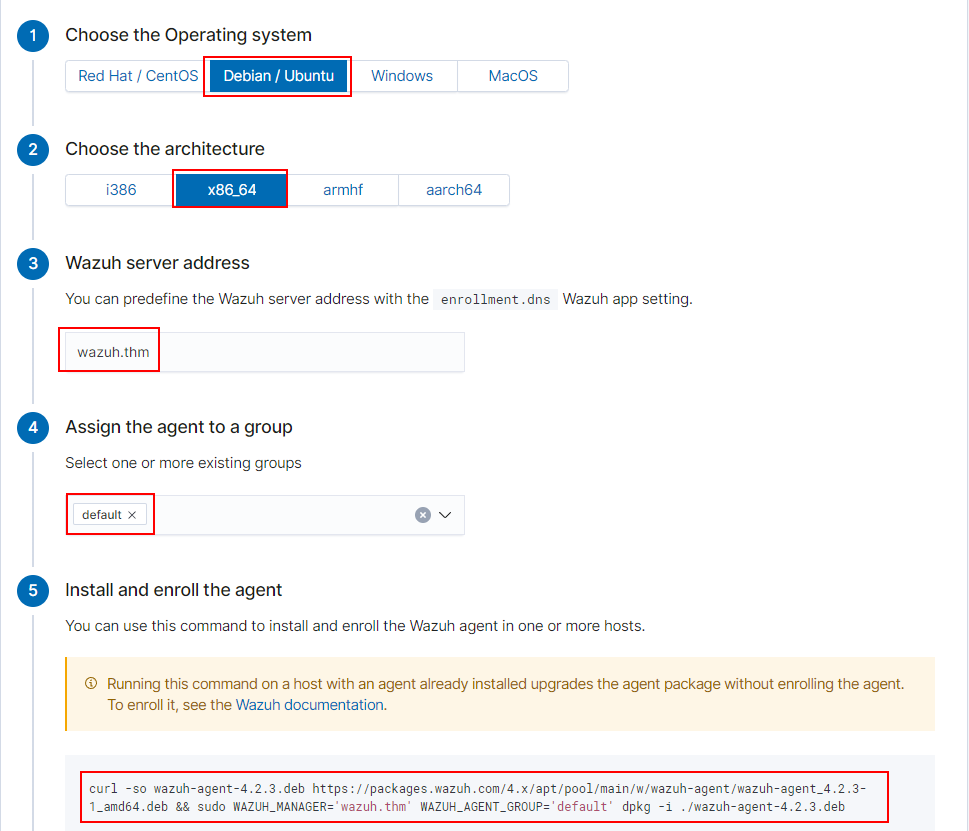
In order for to be populated, agents need to be installed onto devices to log such events. can guide you through the agent deployment process provided you fill out some pre-requisites such as::
- Operating System
- The address of the server that the agent should send logs to (this can be a entry or an IP address)
- What group the agent will be under - you can sort agents into groups within if you wish
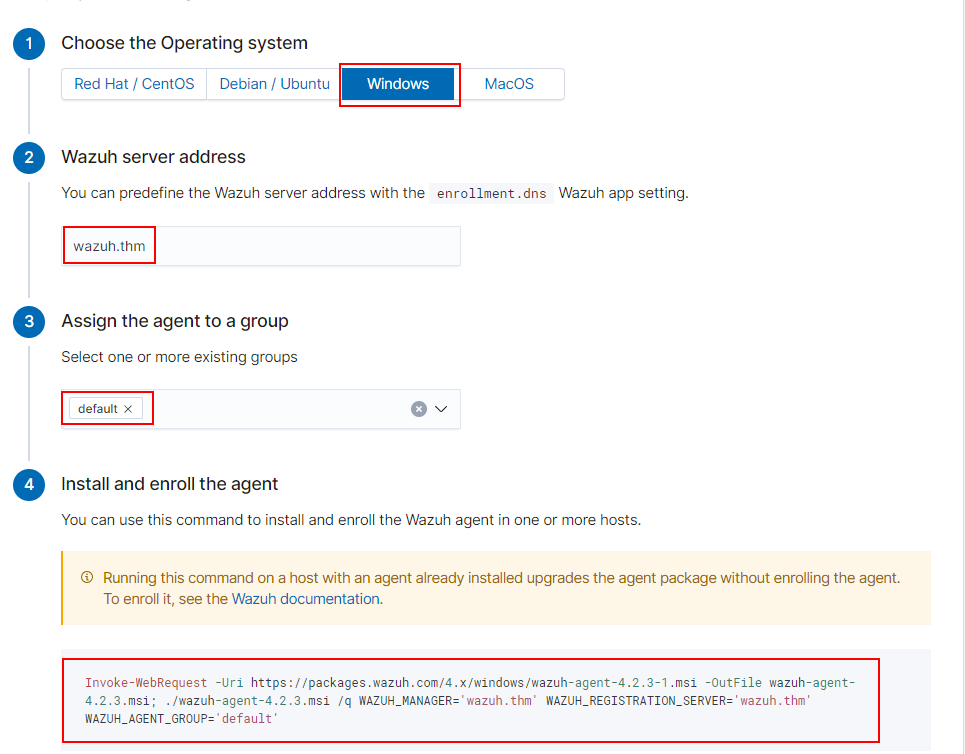
This wizard can be launched by navigating to the following location on the server: -> Agents -> Deploy New Agent as illustrated in this screenshot below:
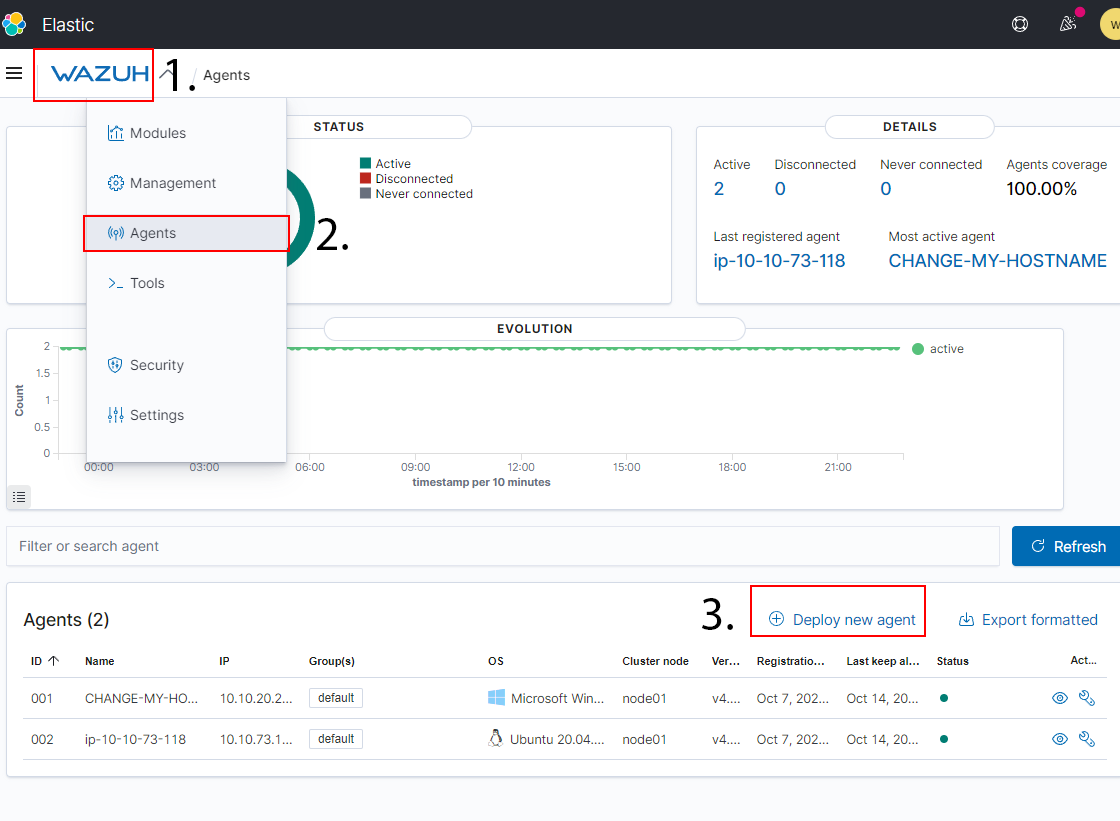
Once you navigate to this display, the intuitive wizard will be available to you. I have shared screenshots of using the wizard to install Wazhur's agent on both Windows and Debian/Ubuntu. At stage 4, you are given a command to copy and paste to your clipboard which will install & configure the agent on the device that you wish to collect logs from.
Installing the agent on Windows:
Installing the agent on Debian/Ubuntu:
Navigate to the "Agents" tab by pressing Wazuh -> Agents
How many agents does this Wazuh management server manage?
What are the status of the agents managed by this Wazuh management server?
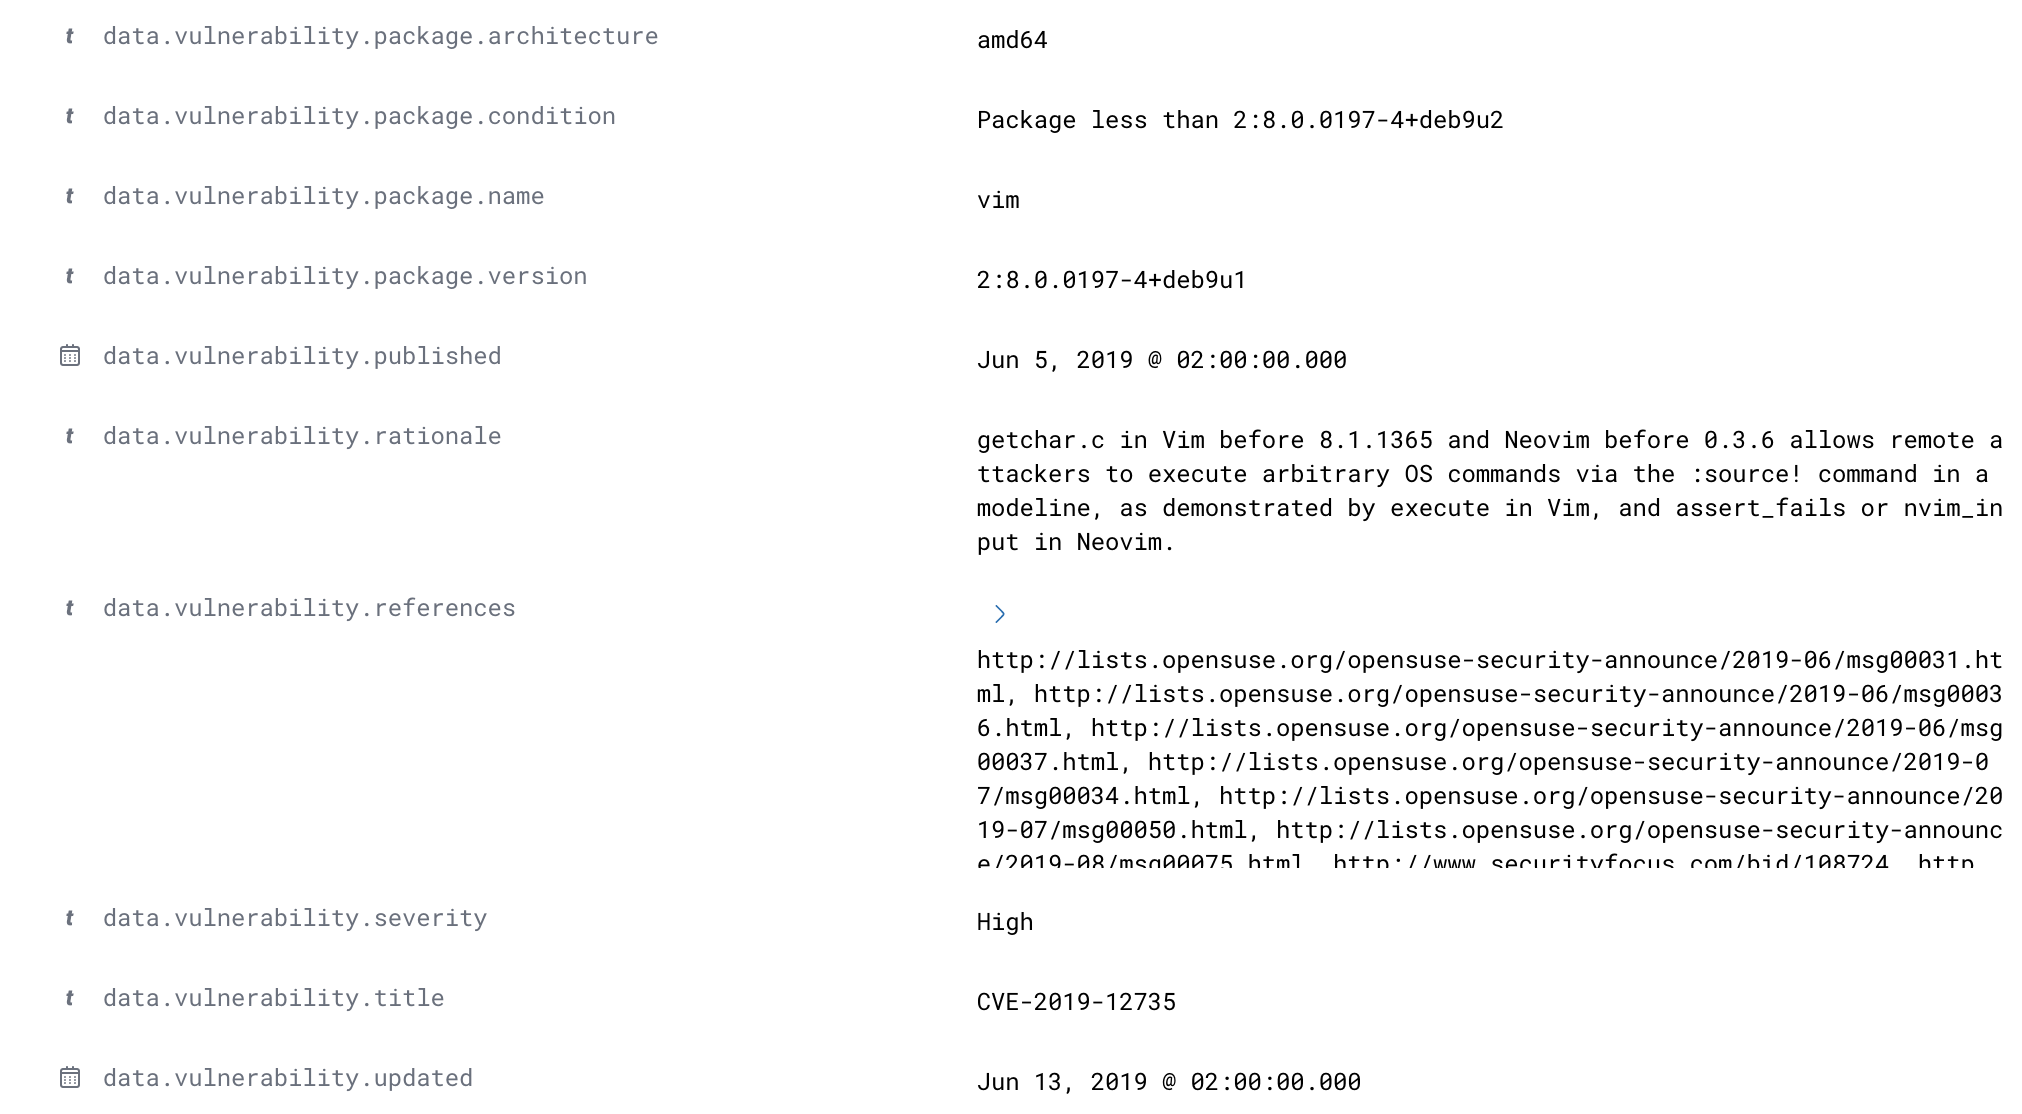
’s module is a powerful tool that can be used to periodically scan an agent's operating system for installed applications and their version numbers.
Once this information has been gathered, it is sent back to the server and compared against a database of CVEs to discover potential vulnerabilities. For example, the agent in the screenshot below has a version of Vim that is vulnerable to -2019-12735.
The vulnerability scanner module will perform a full scan when the agent is
first installed on a device and must be configured to run at a set interval then after
(by default, this is set to 5 minute intervals when enabled) like so:
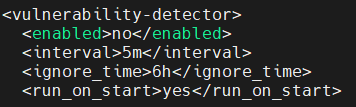
Configuring the management server to audit agents for vulnerabilities frequently (/var/ossec/etc/ossec.conf)
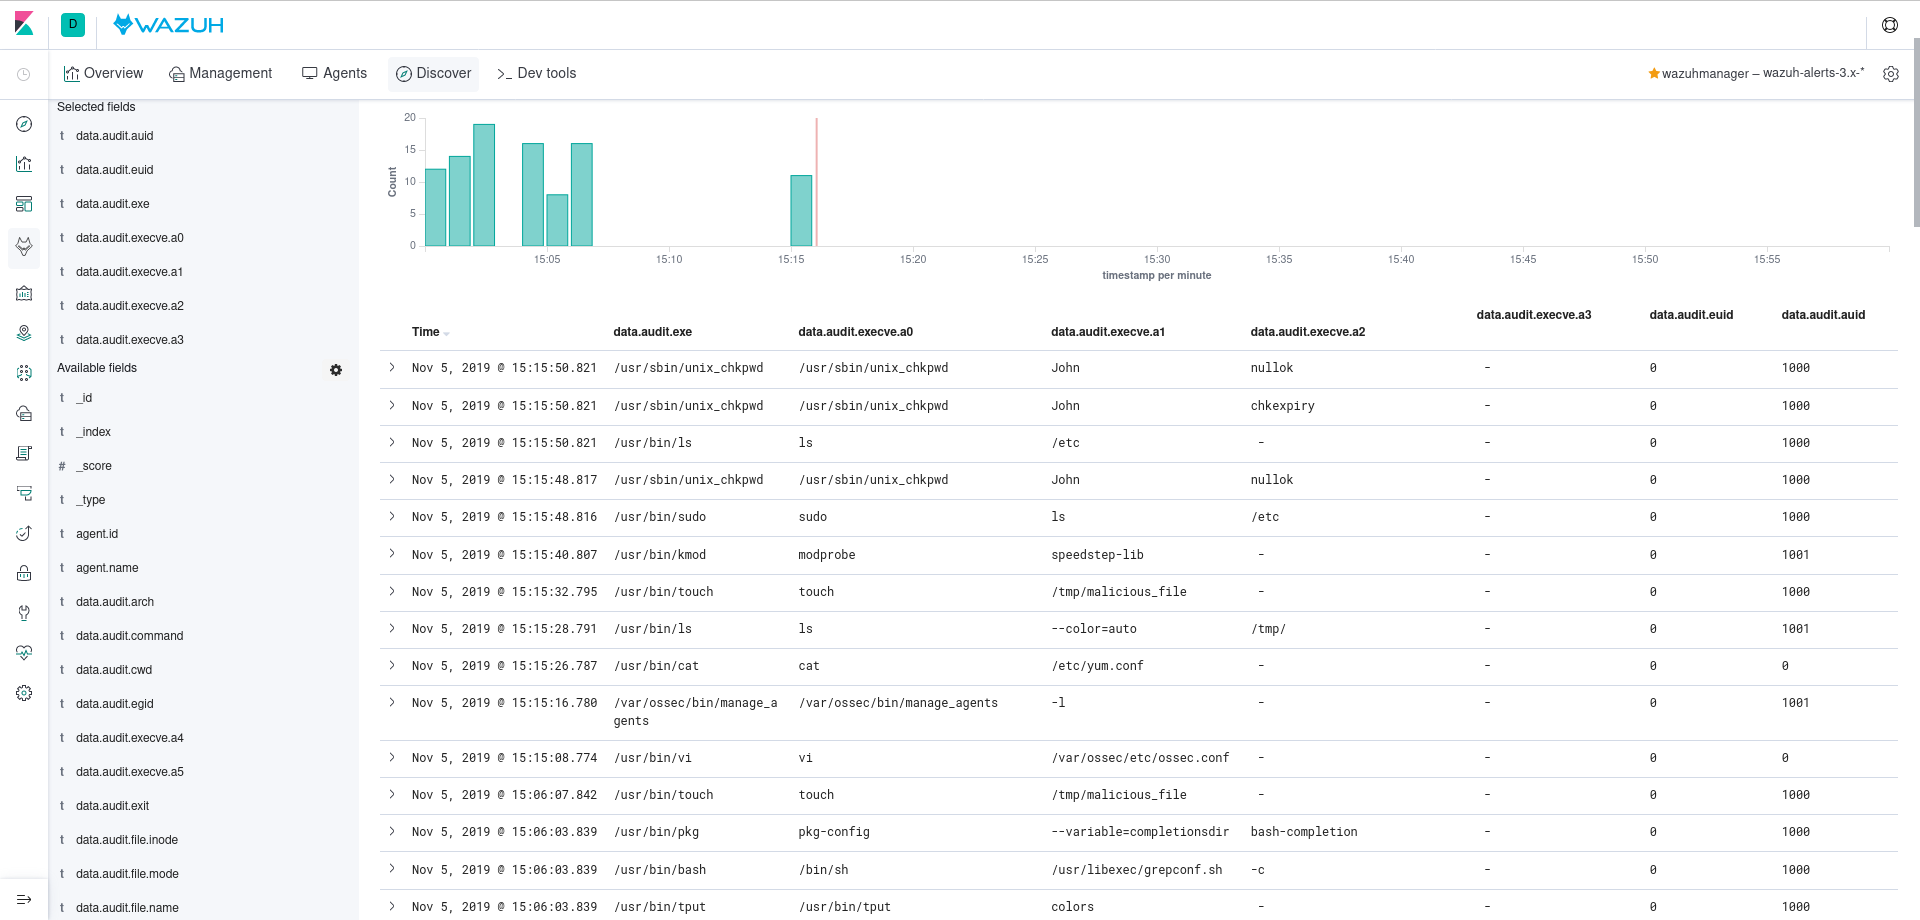
is capable of testing an agent's configuration against certain rulesets to check for compliance. However, out of the box, it is arguably sensitive. Take, for example, this host running the agent. There have been a total of 769 events occurring that the system performs as part of its daily maintenance
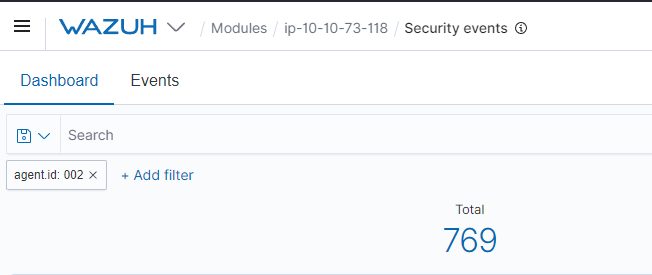
These frequent actions, such as removing files, are often detected as a security event. These events and the related severities are determined by 's rulesets, which is something that we will come on to explore adjusting in another task.
We can analyze these events individually by selecting the event's dropdown. You can sort events based upon various factors such as timestamp, tactics, or description.
Ensure that you are logged in to the Wazuh management server on HTTP://MACHINE_IP (opens in new tab)
Navigate to the Agents tab by pressing Wazuh -> Agents like so
Select the agent named "AGENT-001"
How many "Security Event" alerts have been generated by the agent "AGENT-001"?
Note: You will need to make sure that your time range includes the 11th of March 2022
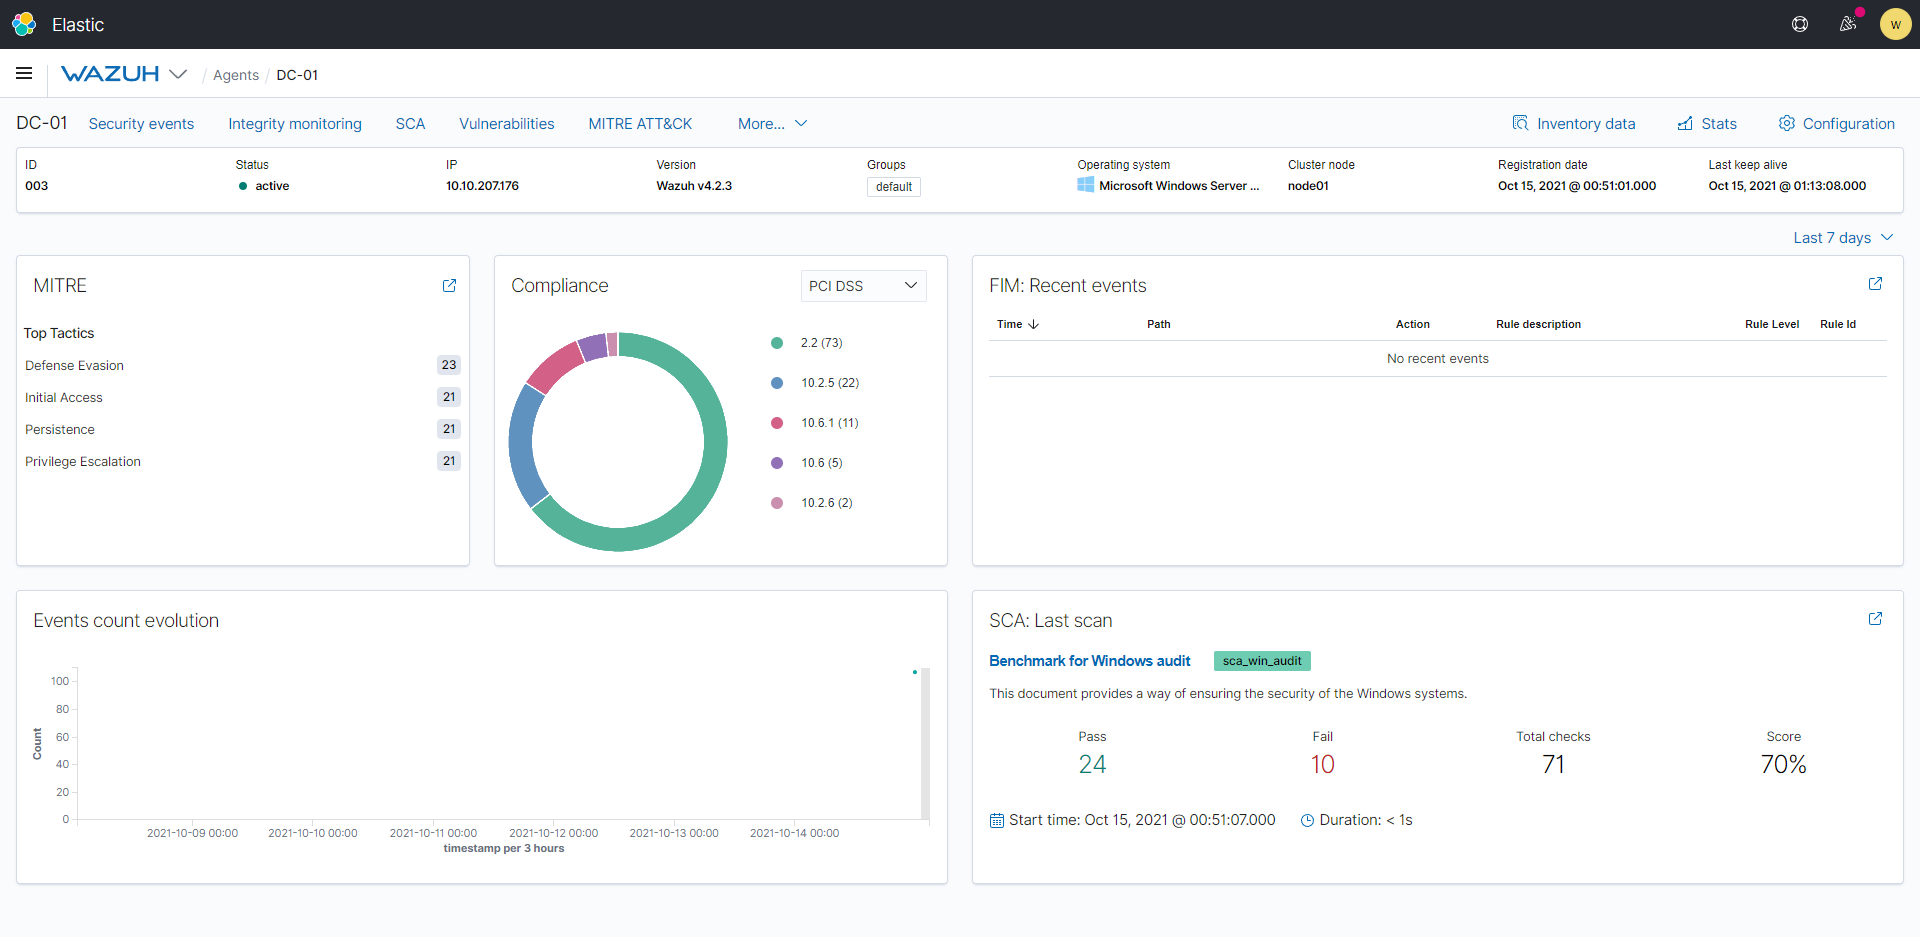
is capable of auditing and monitoring an agent's configuration whilst proactively recording event logs. When the agent is installed, an audit is performed where a metric is given using multiple frameworks and legislations such as , and .
For example, see how this agent -01 scores against , , and :
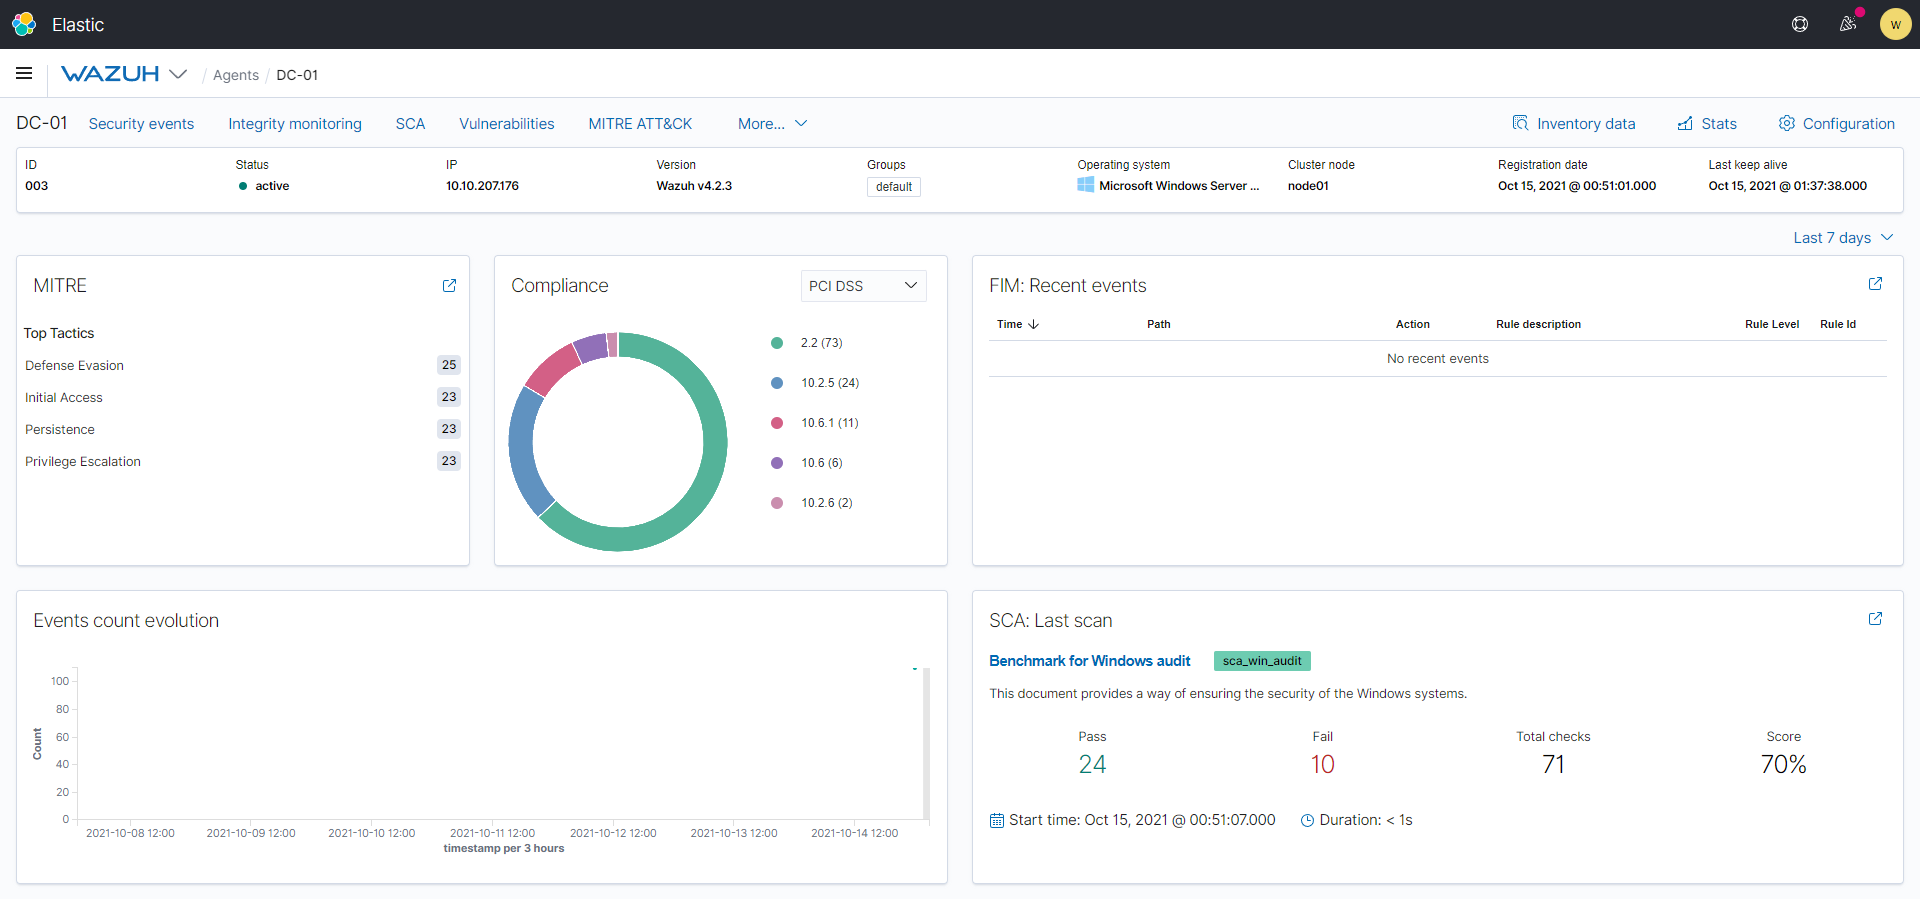
These frameworks are outlined in the Pentesting Fundamentals room if you wish to learn more about them.
presents a broad illustration of the logs. We can use the visualizations to break down this data and explore it further. Let's do this with the same agent. For example, see the benchmark for this domain controller running on a windows server:
Navigate to the "Modules" tab by pressing Wazuh -> Modules and open the "Policy Management" module like so:

's security event monitor is capable to actively record both successful and unsuccessful authentication attempts. The rule with an id of 5710 detects attempted connections that are unsuccessful for the protocol. Let's look at this animated picture below as an example.
The alert was created because someone tried to log onto the agent "ip-10-10-73- 118" with the user "cmnatic" which does not exist. I have summarized this alert into the table below:
| Field | Value | Description |
| agent.ip | 10.10.73.118 | This is the IP address of the agent that the alert was triggered on. |
| agent.name | ip-10-10-73-118 | This is the hostname of the agent that the alert was triggered on. |
| rule.description | : Attempt to login using a non-existent user | This field is a brief description of what the event is alerting to. |
| rule..technique | Brute-Force | This field explains the technique that the alert pertains to. |
| rule..id | T1110 | This field is the ID of the alert |
| rule.id | 5710 | This field is the ID assigned to the alert by 's ruleset |
| location | /var/log/auth.log | This field is the location of the file that the alert was generated from on the agent. In this example, it is the authentication log on the agent. |
For reference, this alert is stored in a specific file on the management server: /var/ossec/logs/alerts/alerts.log. We can use a command such as grep or nano to
search through this file on the management server manually.
           ubuntu@wazuh-server:~$ sudo less /var/ossec/logs/alerts/alerts.log
** Alert 1634284538.566764: - pam,syslog,authentication_success,pci_dss_10.2.5,gpg13_7.8,gpg13_7.9,gdpr_IV_32.2,hipaa_164.312.b,ni>
2021 Oct 15 07:55:38 ip-10-10-218-190->/var/log/auth.log
Rule: 5501 (level 3) -> 'PAM: Login session opened.'
User: root
Oct 15 07:55:37 ip-10-10-218-190 sudo: pam_unix(sudo:session): session opened for user root by ubuntu(uid=0)
uid: 0
Looking at the animated gif below, we can see how has created an alert for successful login to a Window's server running the agent. Because this attempt was successful, the severity of the alert is considered less than that of an unsuccessful login. This can, of course, be tailored to your environment. For example, if a user infrequently used is logged on, you can configure to
list this alert with higher severity.
Ensure that you are logged in to the Wazuh management server on HTTP://MACHINE_IP (opens in new tab)
Navigate to the "Management" tab by pressing Wazuh -> Management and open the "Rules" module like so:

All sorts of actions and events are captured and recorded on a Windows operating system. This includes authentication attempts, networking connections, files that were accessed, and the behaviours of applications and services. This information is stored in the Windows event log using a tool called .
We can use the agent to aggregate these events recorded by for processing to the manager. Now, we will need to configure both the agent and the application. uses rules that are made in formatting to be triggered. For example, in the snippet below, we are telling to monitor for the event of the .exe process starting.
         Sysmon schemaversion="3.30"
         HashAlgorithms md5 /HashAlgorithms
  EventFiltering
  !--SYSMON EVENT ID 1 : PROCESS CREATION--
  ProcessCreate onmatch="include"
  Image condition="contains" powershell.exe /Image
  /ProcessCreate
  !--SYSMON EVENT ID 2 : FILE CREATION TIME RETROACTIVELY CHANGED IN THE FILESYSTEM--
  FileCreateTime onmatch="include"  /FileCreateTime
  !--SYSMON EVENT ID 3 : NETWORK CONNECTION INITIATED--
  NetworkConnect onmatch="include"  /NetworkConnect
  !--SYSMON EVENT ID 4 : RESERVED FOR SYSMON STATUS MESSAGES, THIS LINE IS INCLUDED FOR DOCUMENTATION PURPOSES ONLY--
  !--SYSMON EVENT ID 5 : PROCESS ENDED--
  ProcessTerminate onmatch="include"  /ProcessTerminate
  !--SYSMON EVENT ID 6 : DRIVER LOADED INTO KERNEL--
  DriverLoad onmatch="include"  /DriverLoad
  !--SYSMON EVENT ID 7 : DLL (IMAGE) LOADED BY PROCESS--
  ImageLoad onmatch="include"  /ImageLoad
  !--SYSMON EVENT ID 8 : REMOTE THREAD CREATED--
  CreateRemoteThread onmatch="include"  /CreateRemoteThread
  !--SYSMON EVENT ID 9 : RAW DISK ACCESS--
  RawAccessRead onmatch="include"  /RawAccessRead
  !--SYSMON EVENT ID 10 : INTER-PROCESS ACCESS--
  ProcessAccess onmatch="include"  /ProcessAccess
  !--SYSMON EVENT ID 11 : FILE CREATED--
  FileCreate onmatch="include"  /FileCreate
  !--SYSMON EVENT ID 12 & 13 & 14 : REGISTRY MODIFICATION--
  RegistryEvent onmatch="include"  /RegistryEvent
  !--SYSMON EVENT ID 15 : ALTERNATE DATA STREAM CREATED--
  FileCreateStreamHash onmatch="include"  /FileCreateStreamHash
  PipeEvent onmatch="include"  /PipeEvent
  /EventFiltering
 /Sysmon
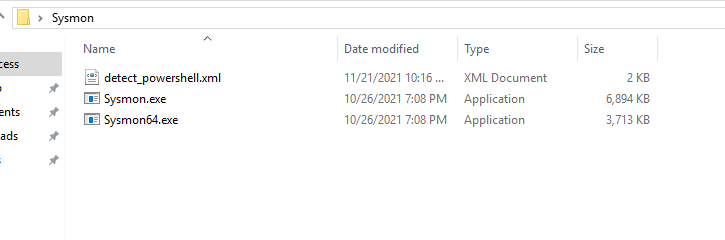
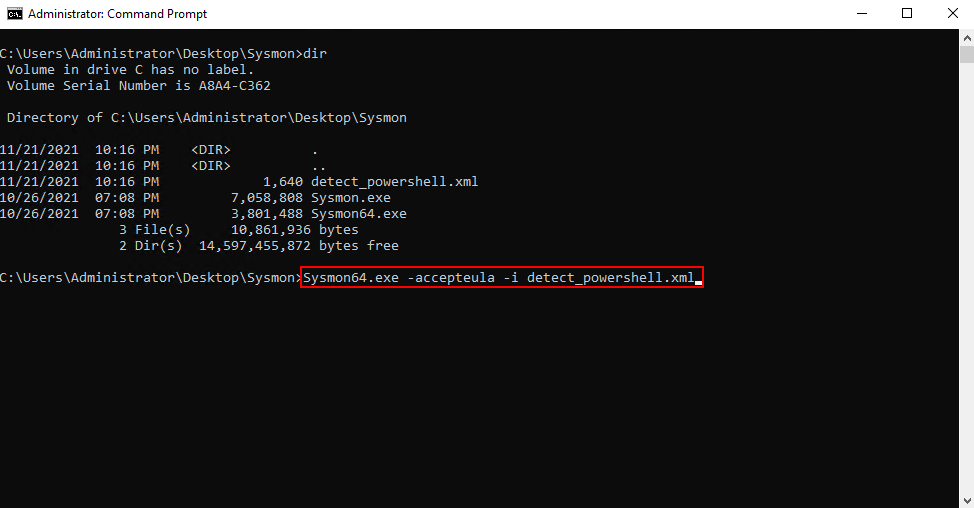
To instruct to do, we need to execute the application and provide the aforementioned configuration file like so: Sysmon64.exe -accepteula -i detect_powershell.xml
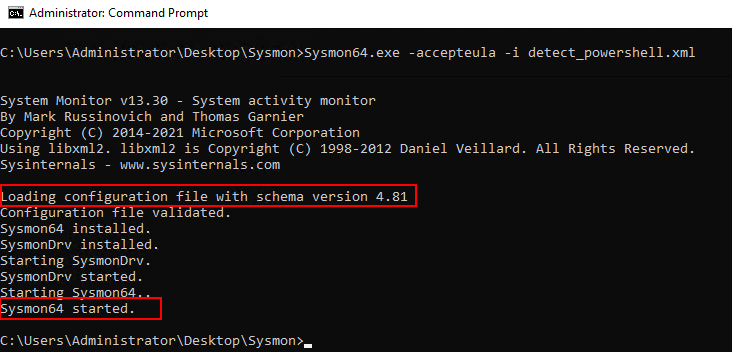
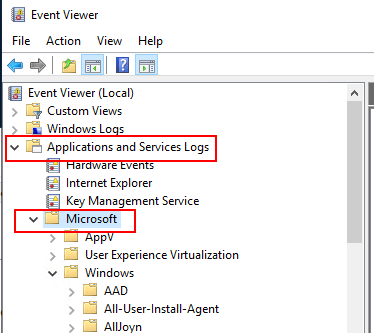
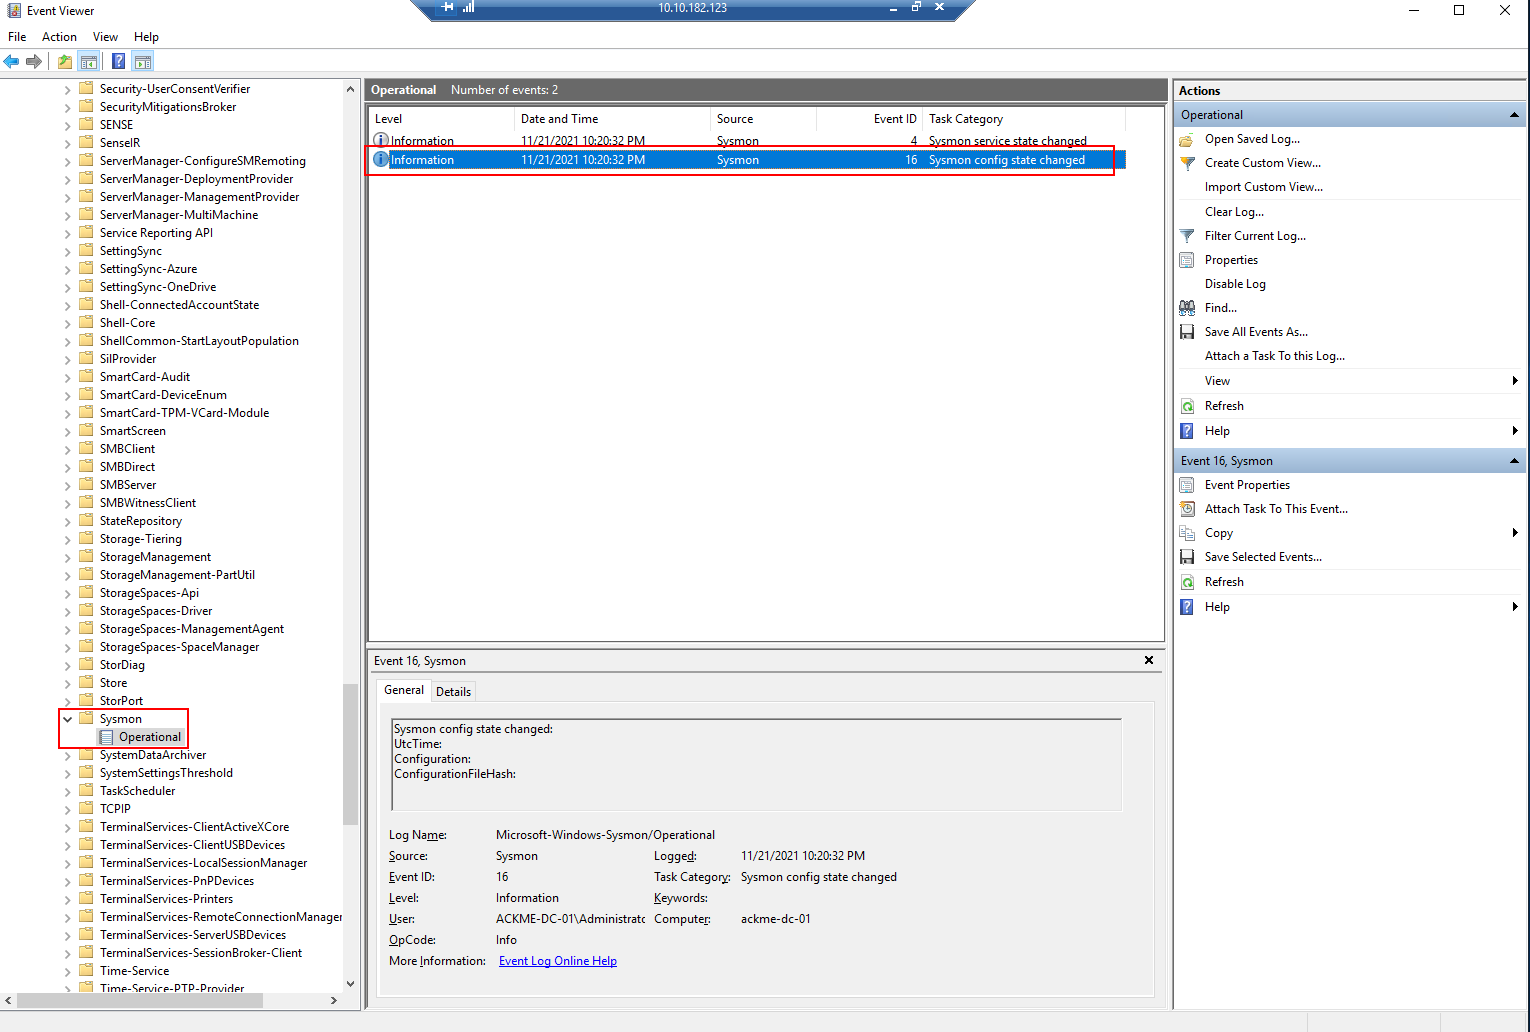
We can verify that Sysmon has accepted our configuration file by navigating to the Event Viewer and searching for the “Sysmon” module like so:
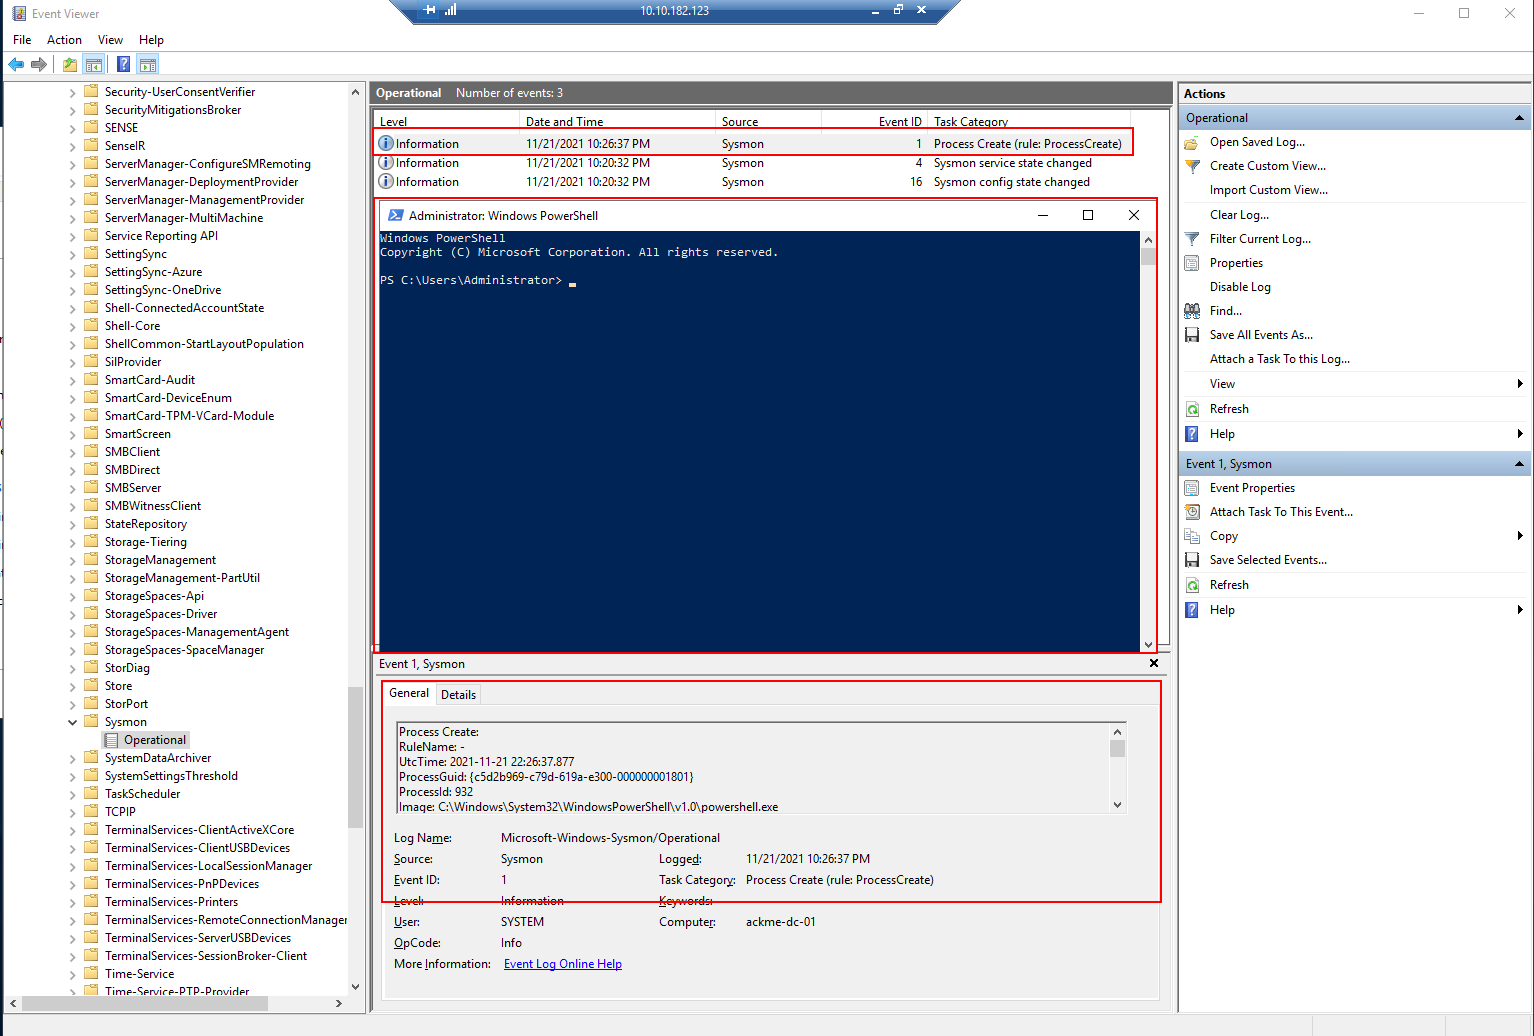
Let’s launch a powershell prompt on the Windows Server and return to our Event Viewer. We can now see a record of this powershell prompt being opened, kept within the Event Viewer.
Now we will need to configure the Wazuh agent on this Window
Server to instruct it to send these events to the Wazuh management server. To
do so, we need to open the Wazuh agent file located at: C:\Program Files (x86)\ossec-agent\ossec.conf
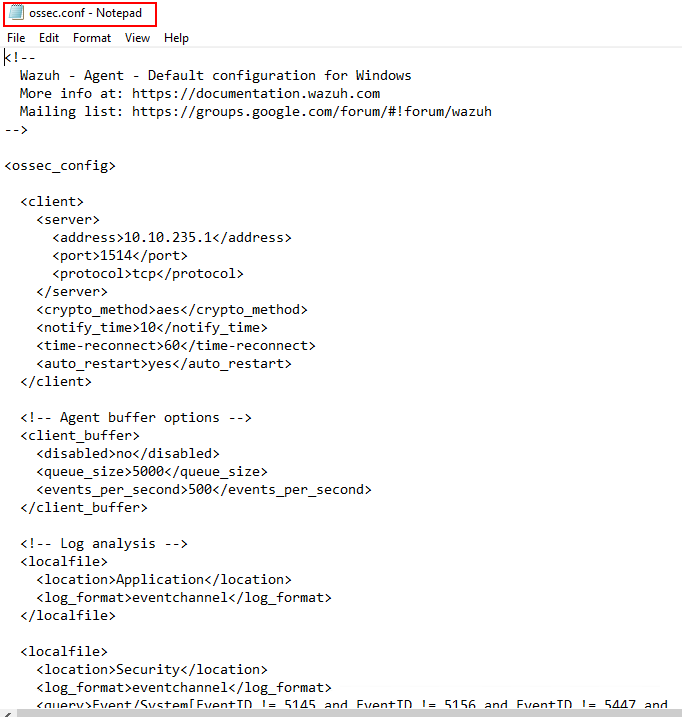
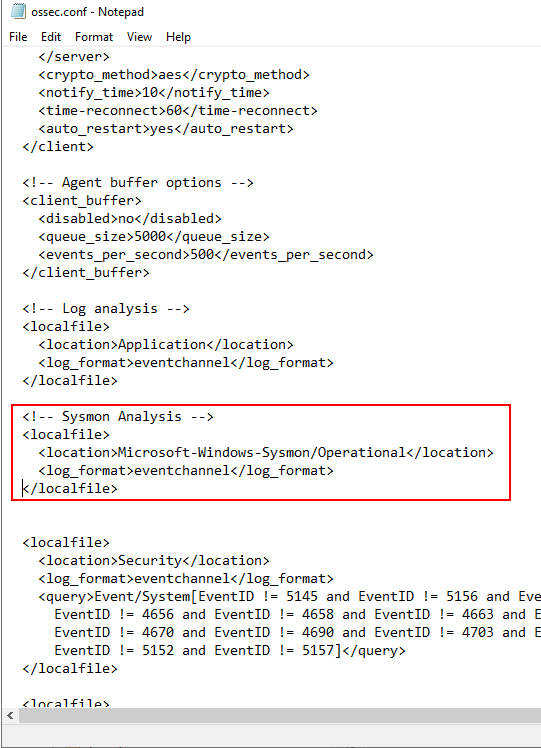
To include the following snippet:
           <localfile>
<location>Microsoft-Windows-Sysmon/Operational</location>
<log_format>eventchannel</log_format>
</localfile>
Looking like so:
Now, we will need to restart the Wazuh agent. In this instance, I am restarting the operating system just to be sure that these changes have taken place.
Once this is done, we need to tell the Wazuh Management server to add as
a rule to visualize these events.
This can be done
by adding an XML file to the local
rules located in /var/ossec/etc/rules/local_rules.xml
           <group name="sysmon,">
 <rule id="255000" level="12">
 <if_group>sysmon_event1</if_group>
 <field name="sysmon.image">\\powershell.exe||\\.ps1||\\.ps2</field>
 <description>Sysmon - Event 1: Bad exe: $(sysmon.image)</description>
 <group>sysmon_event1,powershell_execution,</group>
 </rule>
</group>
You will need to restart the Management server for this to apply. Once done, we can refer back to our Management server and notice that data has been retrieved from an agent.
What standard application on Windows do these system events get recorded to?
Capturing logs from a agent is a simple process similar to capturing events from a Windows agent. We will be using ’s log collector service to create an entry on the agent to instruct what logs should be sent to the management server.
For example, in this task, we will be monitoring the logs of an Apache2 web server. To begin, let’s configure the log collector service on a server running the agent.
comes with many rules that enable to analyze log files and can be
found in /var/ossec/ruleset/rules. Some common applications include:
- Docker
- FTP
- WordPress
- SQL Server
- MongoDB
- Firewalld
- And many, many more (approximately 900).
However, you can always make your own rules. In this task, Wazuh will digest Apache2 logs using the 0250-apache_rules.xml ruleset.
This ruleset can analyze apache2 logs for warnings and error messages like so: We
will need to insert this into the ’s agent that is sending logs to the
management servers configuration file located in /var/ossec/etc/ossec.conf:
             <!-- Apache2 Log Analysis -->
  <localfile>
    <location>/var/log/example.log</location>
    <log_format>syslog</log_format>
  </localfile>
utilises the auditd package that can be installed on Wazuh
agents running on Debian/Ubuntu and CentOS operating systems. In this task, we
will be using auditd on a Ubuntu system. Auditd monitors the system for certain
actions and events and will write this to a log file.
We can then use the log collector module on a Wazuh agent to read this log file and send it to the Wazuh management server for processing.
First, we will need to install the auditd package and an
auditd plugin. This may already be installed on your system; however, let’s install it to make sure. Let’s run the command sudo apt-get install auditd
audispd-plugins and enable this service to run currently as well as on boot.sudo
systemctl enable auditd.service & sudo systemctl start auditd.service
We will need to configure auditd to create a rule for the
commands and events that we wish for it to monitor. In this task, we will be
telling auditd to monitor for any commands executed as root.
You can extend this to monitor commands such as tcpdump, netcat, or catting files
such as /etc/passwd, which are all hallmarks of a breach.
Auditd rules are located in the following directory: /etc/audit/rules.d/audit.rules. We will be adding our rules manually.
For this task, we will need to open this audit.rules file
and append our rule ourselves. First, let’s edit the file using sudo nano
/etc/audit/rules.d/audit.rules and appending -a exit,always -F arch=64 -F
euid=0 -S execve -k audit-wazuh-c
           ## First rule - delete all
-D

## Increase the buffers to survive stress events.
## Make this bigger for busy systems
-b 8192

## This determine how long to wait in burst of events
--backlog_wait_time 0

## Set failure mode to syslog
-f 1

-a exit,always -F arch=b64 -F euid=0 -S execve -k  audit-wazuh-c
We will now need to inform audits of this new rule, so let's run this command sudo auditctl -R /etc/audit/rules.d/audit.rules to now read the new audit.rules file that we appended to in the previous task.
Now, let’s configure the system that is running a Wazuh
agent that we wish to monitor these events on. We’ll be monitoring a Linux host
in this case, so like in our previous tasks, we will need to configure the
Wazuh agent to detect this new log file that is generated by auditd like so
sudo nano /var/ossec/etc/ossec.conf and add the auditd log like so:
<localfile>
    <location>/var/log/audit/audit.log</location>
    <log_format>audit</log_format>
</localfile>
What is the full path & filename for where the aforementioned application stores rules?
Using Our Own Client
The management server features a rich and extensive to allow the management server to be interacted with using the command line. Because the management server requires authentication, we must first authenticate our client.
In this task, we will be using a machine with the curl tool installed to interact with the Wazuh management server API. First, we will need to authenticate ourselves by providing a valid set of credentials to the authentication endpoint.
Once we are authenticated, the Wazuh management server will give us a token (similar to a session) that we will need to provide for any further interaction. We can store this token as an environment variable on our Linux machine like the snippet below:
(replacing WAZUH_MANAGEMENT_SERVER_IP with the IP address of the Wazuh management server (i.e. MACHINE_IP):
TOKEN=$(curl -u : -k -X GET "https://WAZUH_MANAGEMENT_SERVER_IP:55000/security/user/authenticate?raw=true")
Let’s confirm that we have authenticated okay and have been given a token by the management server: curl -k -X GET "https://MACHINE_IP:55000/" -H "Authorization: Bearer $TOKEN"
           {
    "data": {
        "title": "Wazuh API",
        "api_version": "4.0.0",
        "revision": 4000,
        "license_name": "GPL 2.0",
        "license_url": "https://github.com/wazuh/wazuh/blob/master/LICENSE",
        "hostname": "wazuh-master",
        "timestamp": "2021-10-25T07:05:00+0000"
    },
    "error": 0
}
We can use the standard HTTP request methods such as GET/POST/PUT/DELETE by providing the relevant option after a -X i.e. -X GET
curl -k -X GET "https://MACHINE_IP:55000/manager/status?pretty=true" -H "Authorization: Bearer $TOKEN"
For example, let’s use the Wazuh API to list some statistics and important information about the Wazuh management server, including what services are being monitored and some general settings about the Wazuh management server:
curl -k -X GET "https://MACHINE_IP:55000/manager/configuration?pretty=true§ion=global" -H "Authorization: Bearer $TOKEN"
           {
  "data": {
    "affected_items": [
      {
        "wazuh-agentlessd": "running",
        "wazuh-analysisd": "running",
        "wazuh-authd": "running",
        "wazuh-csyslogd": "running",
        "wazuh-dbd": "stopped",
        "wazuh-monitord": "running",
        "wazuh-execd": "running",
        "wazuh-integratord": "running",
        "wazuh-logcollector": "running",
        "wazuh-maild": "running",
        "wazuh-remoted": "running",
        "wazuh-reportd": "stopped",
        "wazuh-syscheckd": "running",
        "wazuh-clusterd": "running",
        "wazuh-modulesd": "running",
        "wazuh-db": "running",
        "wazuh-apid": "stopped"
      }
    ],
    "total_affected_items": 1,
    "total_failed_items": 0,
    "failed_items": []
  },
  "message": "Processes status were successfully read in specified node",
  "error": 0
}
Or perhaps, we can use the management server’s API to interact with an agent:
curl -k -X GET "https://MACHINE_IP:55000/agents?pretty=true&offset=1&limit=2&select=status%2Cid%2Cmanager%2Cname%2Cnode_name%2Cversion&status=active" -H "Authorization: Bearer $TOKEN"
           {
  "data": {
    "affected_items": [
      {
        "node_name": "worker2",
        "status": "active",
        "manager": "wazuh-worker2",
        "version": "Wazuh v3.13.1",
        "id": "001",
        "name": "wazuh-agent1"
      }
],
    "total_affected_items": 9,
    "total_failed_items": 0,
    "failed_items": []
  },
  "message": "All selected agents information was returned",
  "error": 0
}
Using 's Console
has a powerful, integrated console within the website to query management servers and agents. Whilst it is not as extensive as using your own environment (where you can create and run scripts using python, for example), it is convenient.
To find this console, we need to open the "Tools" category within the heading at the top:
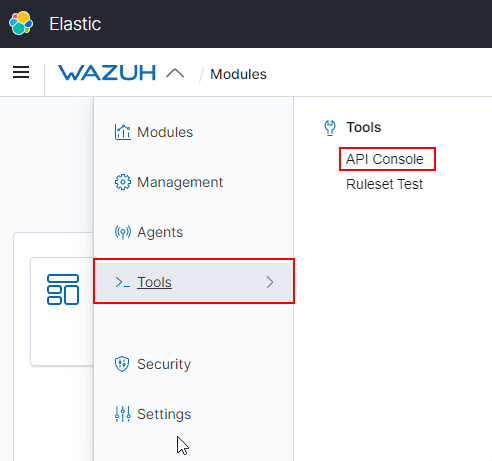
You will be greeted with a few sample queries that you can run. Simply select the line and press the green run arrow to run the query as demonstrated below:
Reminder, the syntax for running queries uses the same web methods (i.e. GET/PUT/POST) and endpoints (i.e. /manager/info) as you would use with curl. You can view some more options about endpoints by following 's detailed documentation here (opens in new tab)
What HTTP method would we use to retrieve information for a Wazuh management server API?
What HTTP method would we use to perform an action on a Wazuh management server API?
Navigate to Wazuh's API console.
Use the API console to find the Wazuh server's version.
Note: You will need to add the "v" prefix to the number for this answer. For example v1.2.3
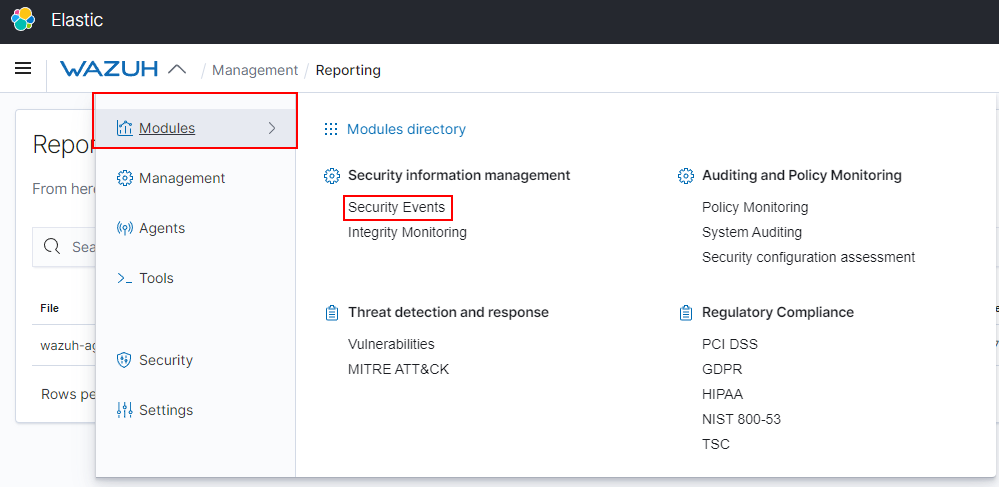
features a reporting module that allows you to view a summarised breakdown of events that have occurred on an agent.
First, we will need to select a view to generate reports from. In this example, I want to generate a report of the security events in the last 24 hours. To do so, I will need to open the view: 1. Modules -> 2. Security Events
Now, if there have been alerts within the last 24 hours, I can generate a report like so:
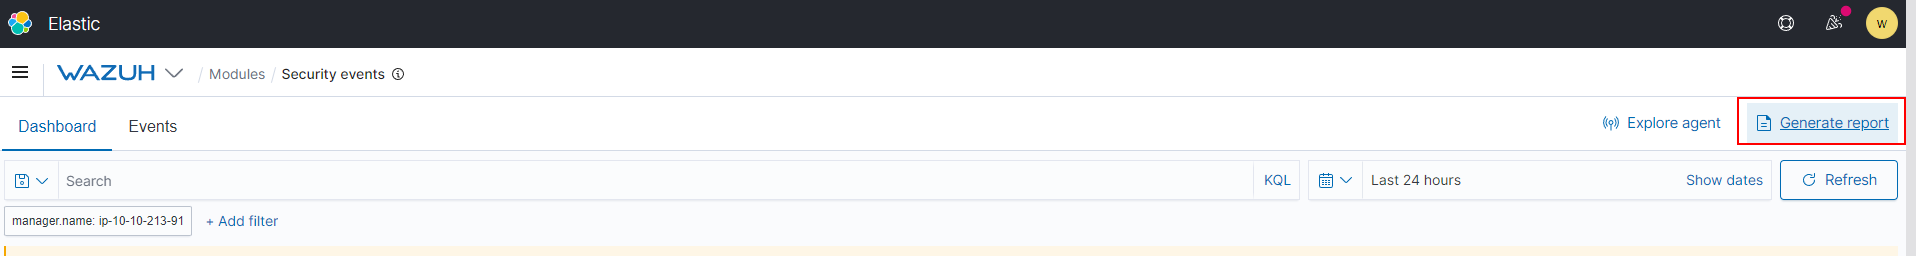
Note: If this button is greyed out, there is no report data, so you will either need to change your query or extend the date range.
The report may take between a couple of seconds to a few minutes to generate (depending on the amount of data needed to be processed). After allowing some time, we will navigate to the report overview dashboard within .
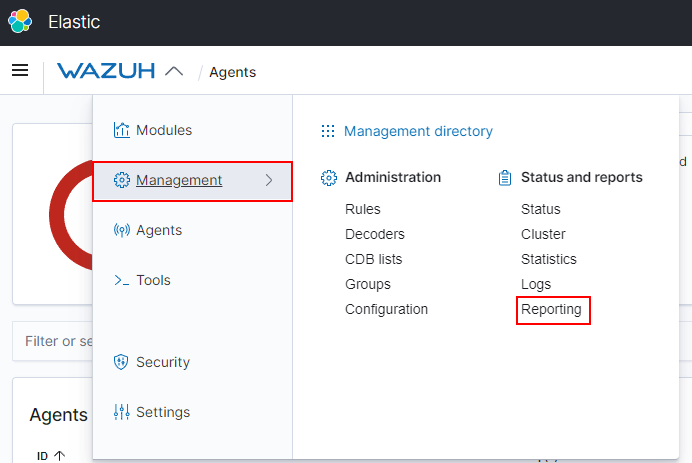
First, press on the "" heading at the top of the screen and select "Management", and then click on the "Reporting" text located under the "Status and Reports" sub-heading:
The report overview dashboard lists all generated reports. To download a report, press the save icon on the right of the report located under the "Actions" heading.
Which will download the report as a PDF to your machine. A generated security events report looks like so: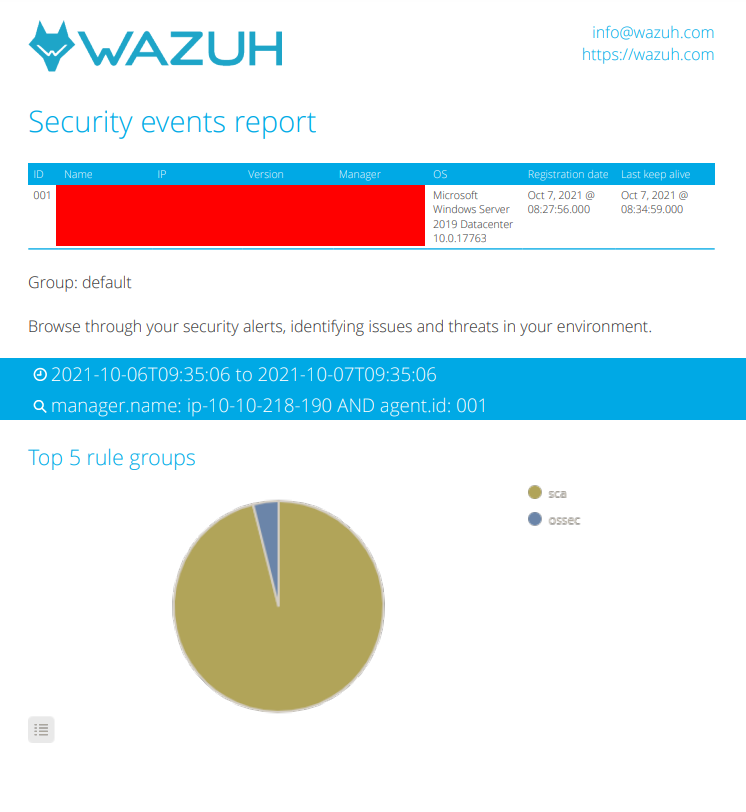
Use Wazuh's "Report" feature to generate a report of an agent.
Navigate to the Wazuh "Report" dashboard (opens in new tab)
Analyse the report. What is the name of the agent that has generated the most alerts?
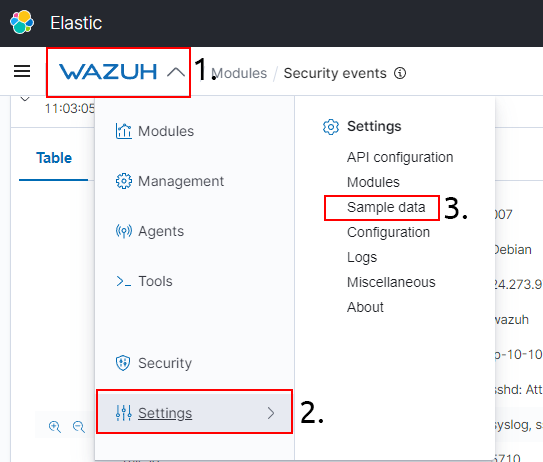
The management server comes with sample data bundled with the installation that can be loaded at your convenience. I have not enabled this by default to improve the performance of the server. However, if you wish to import much more data to showcase the extensibility of further, follow the steps below. Navigate to the module to load the sample data:
- Open the "" tab in the heading.
- Highlight over "Settings".
- Select the "Sample Data" heading.
- Press the "Add Data" button on the respective three cards to import the data.
- Note that this may take up to a minute for each. Refer to this animated picture below for example. The data will have successfully imported when the button on the card says "Remove data"
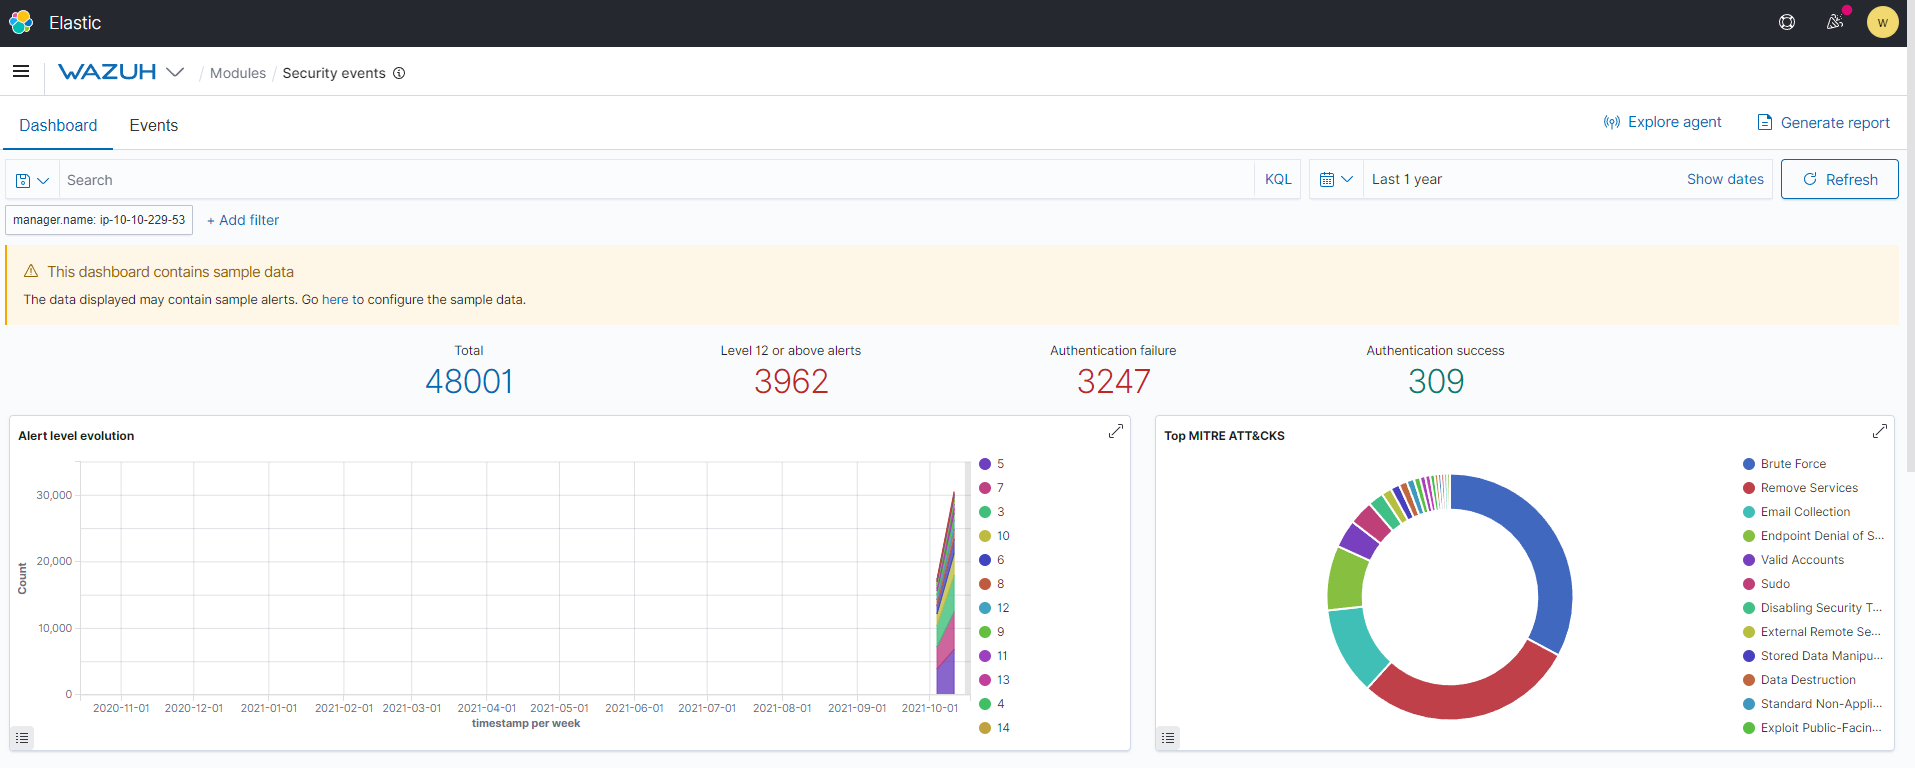
Return to the dashboard to see the newly imported data. For example, we can now see that the "Security Events" module has a tonne more data for us to explore.
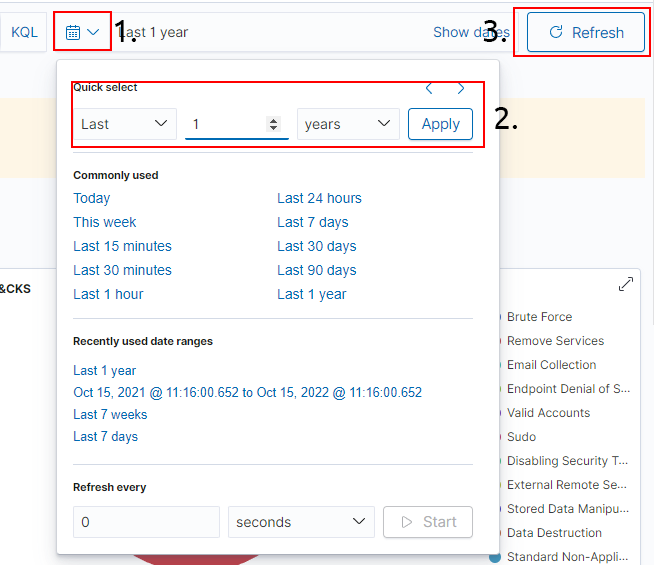
Please note that you will need to play with the date range. The absolute minimum required to show the sample will need to be Last 7 days+
and refresh the dashboard for this to apply.
I have played around with the sample data.
Ready to learn Cyber Security?
TryHackMe provides free online cyber security training to secure jobs & upskill through a fun, interactive learning environment.
Already have an account? Log in