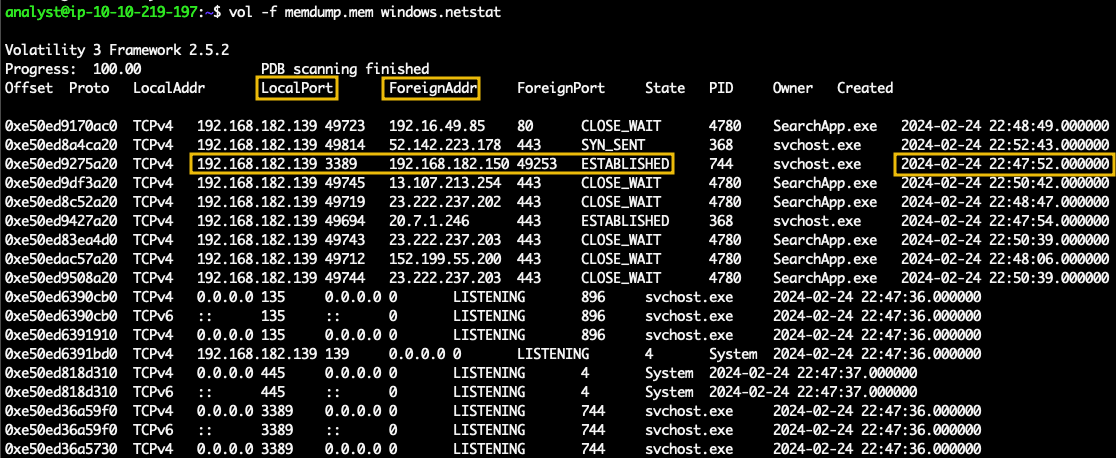
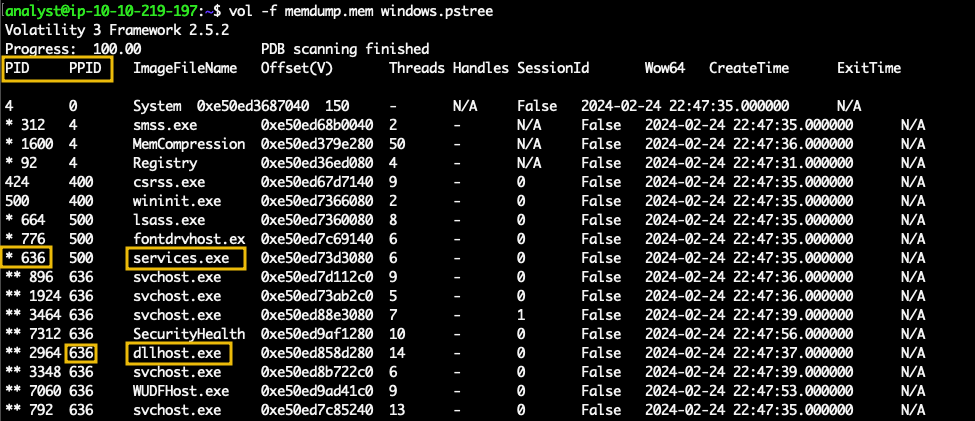
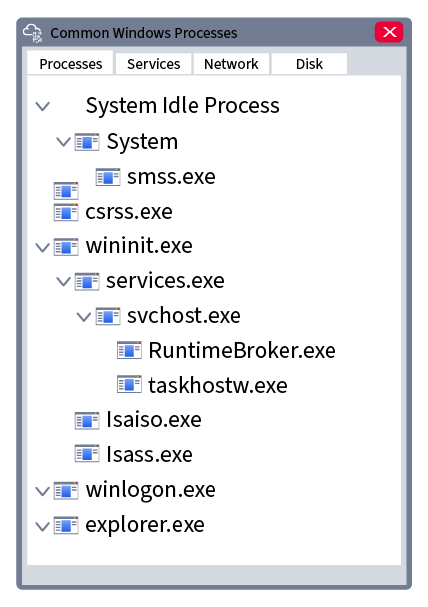
With the information we have collected, we can investigate the process critical_updat that we identified in our previous task, which has a child process called updater. Let's investigate the child process more in-depth. Let's start by looking at where on the disk it was saved; for that, we can use the plugin windows.filescan which will allow us to examine the files accessed that are stored in the memory dump. This output is quite big, so to access the data in a better way, we will use the > character in bash to redirect the output to a file, in this case, filescan_out.
vol -f memdump.mem windows.filescan > filescan_out
After executing the command, we can inspect the data by using cat and filtering using the grep command as shown below.
cat filescan_out |grep updater
Above, we can observe that the files have been stored in the Directory \Users\user01\Documents\updater.exe or C:\Users\user01\Documents\updater.exe
If we want to have more detailed information like when the file was accessed or modified, we can use the plugin windows.mftscan.MFTScan, whose output is also quite big, so we will redirect the output to the file mftscan_out as shown below.
vol -f memdump.mem windows.mftscan.MFTScan > mftscan_out
We can then use the grep command again to parse the file for the appearance of updater.exe.
cat mftscan_out | grep updater
From the output above, we observe the last four timestamps correspond to the Created, Modified, Updated, and Accessed TimeStamps; we can take notes of those.
Getting the Goods
Let's get information on the process. There are several ways to examine memory, but we will continue using volatility. This time, we will dump the memory region corresponding to updater.exe , and examine it.
To accomplish the above, we'll use the plugin windows.memmap. This time, we'll specify the output dir with the -o switch. In this case, we will use the same directory denoted by the character " . "and the option --dump followed by the option --pid and the PID of the process, which in the case of updater.exe is.
vol -f memdump.mem -o . windows.memmap --dump --pid 1612
When the command above is finished, we will have a file with an extension .dmp in our working directory.
Examining the file is difficult since it contains non-printable characters, so we'll use the strings command to analyze the output better. Since we have the file strings available to us now, we could look for key patterns like HTTP or key or any pattern that can lead us quickly to an artefact. Another way to scroll the terminal is by using the strings command piped to less to navigate through the output as shown in the command output below.
strings pid.1612.dmp |less
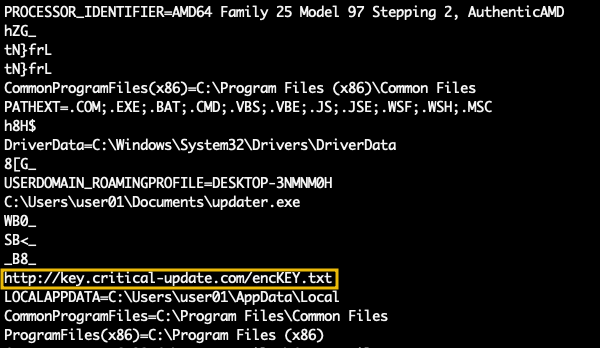
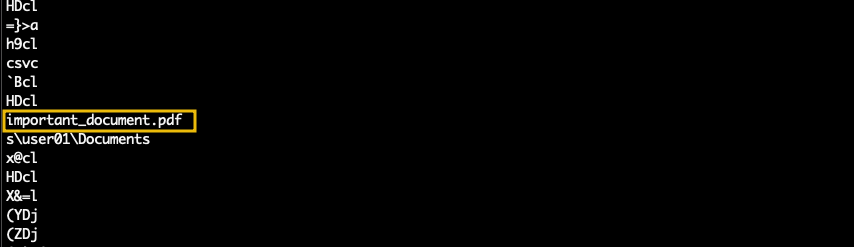
As we can observe, we immediately identified a possible key and a domain from a URL that the process may have accessed. Also, by scrolling down, we found more indications that this is a malicious process since we can find the important_document.pdf filename indicating an interaction with the file.
Great, we can infer that the process updater.exe accessed the document important_document.pdf and accessed a "key" at some point in the URL http://key.critical-update.com/encKEY.txt .
If we use the command grep to look for the HTTP request that may be stored in memory, we can do it using -B and -A to look for 10 lines above and below our match to see if we can spot something else.
strings pid.1612.dmp |grep -B 10 -A 10 "http://key.critical-update.com/encKEY.txt"
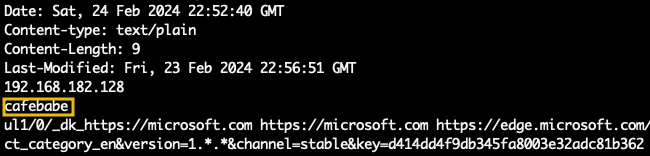
Scrolling up, we can observe the HTTP request, as displayed.
From the above, we can observe at the end of the HTTP request the content of the file encKey.txt, and on the same request, we can observe data with the value cafebabe. This could be the key to encrypting the PDF used by the attacker that was not downloaded to disk.
Excellent. We collected valuable information from the memory dump, including the possible key used to encrypt the documents.