
Intro to Cyber Threat Intel
Introducing cyber threat intelligence and related topics, such as relevant standards and frameworks.
easy

To access material, start machines and answer questions login.
Cyber Threat Intelligence for L1 Analysts
The modern Security Operations Centre () is a noisy place. Dashboards blink, telemetry streams in by the gigabyte, and the clock always ticks toward the subsequent potential breach. At the front of this controlled chaos sits the Level 1 analyst - the first human touchpoint for every suspicious ping, pop‑up, or packet. This room seeks to translate the sometimes abstract discipline of Cyber Threat Intelligence () into everyday tasks: enriching indicators, triaging alerts, and turning raw data into the stories that matter.
The goal is to move learners from "I recognise an IP address" to "I recognise why this IP address spells trouble—and I can prove it" by achieving the following objectives:
- Understand what threat intelligence is and why it matters to analysts.
- Know about the threat intelligence lifecycle and the indicators to look for.
- Familiarise yourself with intelligence sharing using feeds and platforms.
Prerequisites
Before we begin, it is advisable to complete the following path:
A junior analyst logs in for their shift and finds two hundred fresh alerts waiting—everything from benign network scans to a beacon that feels out of place. The ticket queue does not politely pace itself; it demands quick, confident decisions. This is where earns its keep.
Threat intelligence provides the context that helps an analyst decide which of those two hundred alerts represents genuine danger. With reliable context, the spends energy on the right issues and sleeps better when the dashboards are finally calm.
In concrete terms, seeks to answer three essential questions:
- Who, or what, is on the other end of this alert indicator?
- What was their behaviour in the past?
- How does my organisation respond, and what should I do about it right now?
When these questions are addressed early—preferably within minutes—an L1 analyst buys precious time downstream for the incident‑response () team. is therefore not the exclusive domain of intel specialists; it is a front‑line tool that elevates triage from guesswork to calculated action.
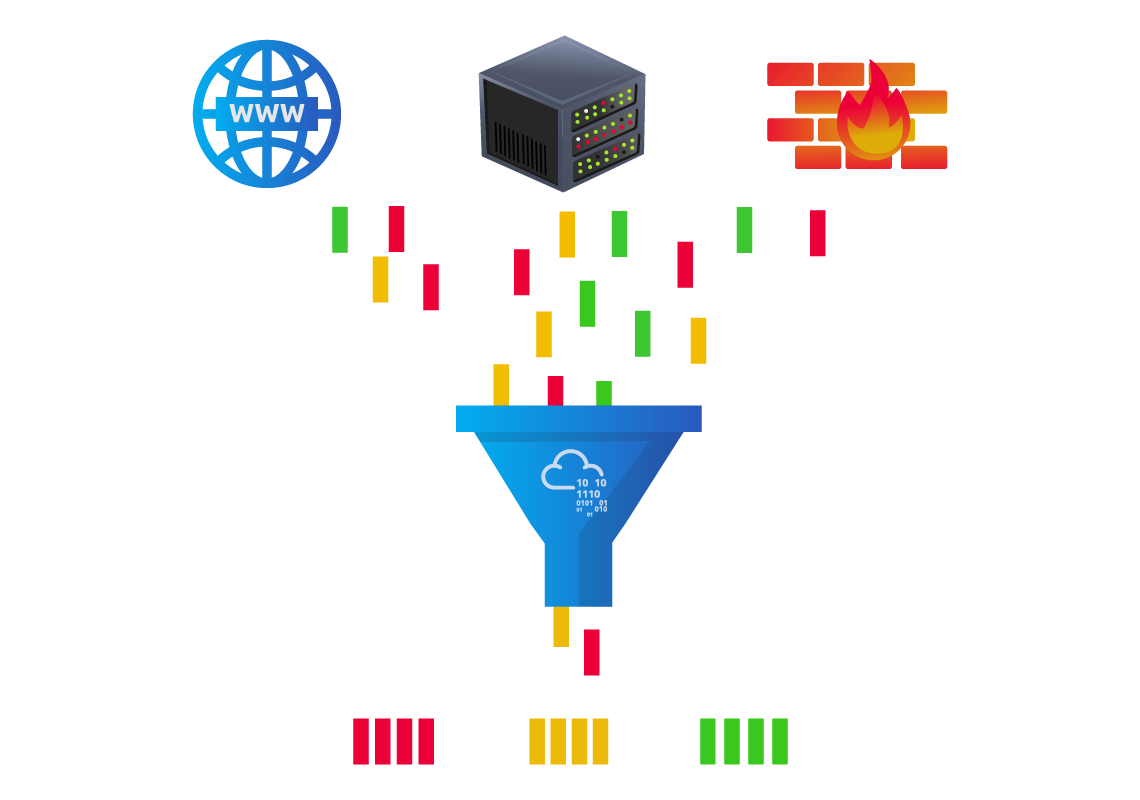
From Raw Data to Usable Intelligence
Information security literature distinguishes data, information, and intelligence, yet the three terms often blur in daily conversation. Making them explicit clarifies an analyst's objective.
| Layer | Definition | Alert-queue example | L1 action |
|---|---|---|---|
| Data | An unprocessed observable | 45.155.205.3 :443 |
Capture the artefact. |
| Information | Data plus factual annotation | IP registered to Hetzner, first seen 2023-07-14 | Record attributes. |
| Intelligence | Analysed information that answers so-what | IP belongs to the current BumbleBee C2; block immediately | Escalate or suppress. |
A Level 1 analyst is responsible for making the artefacts usable and enriching them until they qualify as intelligence, or demonstrating that they never will. That push is enacted through enrichment: rapid, methodical lookups of public, commercial, and internal sources that shed light on origin, behaviour, and relevance.
During the ascent of data to intelligence, three more labels become paramount for analysts to know.
- Indicator of Compromise (IOC): Evidence of a breach, such as a C2 address in the logs.
- Indicator of Attack (IOA): A malicious action, such as PowerShell launching an unknown service, is underway.
- Tactics, Techniques, and Procedures (TTP): An adversary's detailed methodologies expressed in MITRE ATT&CK IDs and descriptions.
Indicator Types Essential to First-Line Triage
Every artefact demands a tailored enrichment path. Memorising tools is less important than recognising what kind of indicator the alert supplies and knowing where to look. Below, we have a table showing the types of indicators we need to be aware of, with examples:
| Indicator | Example | First Resources | Associated IOA or TTP Examples |
|---|---|---|---|
| IPv4 / IPv6 | 45.155.205.3 |
• WHOIS (ASN, allocation date) · VirusTotal Relations· Shodan banner scan | IOA: Repeated SSH failures : T1110.003Password Guessing |
| Domain / FQDN | malicious-updates[.]net |
• WHOIS age · RiskIQ or SecurityTrails passive-DNS · urlscan.io | IOA: surge of DNS queries to a 24-hour-old domain |
| URL | hxxp://malicious-updates[.]net/login |
• URLhaus reputation · urlscan.io behaviour graph · Any.Run dynamic run (network off) | IOA: Browser POST to /gateway.php with payload |
| File hash | e99a18c428cb38d5… |
• VirusTotal static & dynamic · Hybrid-Analysis · MalShare corpus | TTP: T1055 Process Injection into regsvr32.exe |
| E-mail address | billing@evil-corp.com |
• MXToolbox header analysis • Have I Been Pwned | IOA: SPF failure plus recent domain registration |
| Local artefact | HKCU\Software\Run\updater.exe |
• Sigma rules · prevalence query · Vendor knowledge bas | : T1060.001 Registry Run Keys |
Actionable tip. Maintain a browser bookmark folder or a launcher panel that opens your preferred look-ups with the highlighted indicator pre-populated. The thirty seconds saved per alert compound into hours over a month.
Feeds, Platforms, and Why the Distinction Matters
Most SOCs do not build or have intelligence in-house. The insights must be integrated and ingested from reliable sources.
Feed: A scheduled stream of indicators, usually delivered in various formats such as CSV, , STIX, or through TAXII. Over-ingesting feeds without curation drowns analysts in false positives and erodes trust in the programme.
Platform: A structured repository that stores indicators, tracks enrichment, maps relationships, and enforces sharing permissions. and OpenCTI are leading open-source examples.
Sound practice introduces feeds gradually, confirms they align with the organisation's threat model, and promotes them into the platform only after measuring actionability. The platform then becomes the single source of truth—an analyst queries it first, ensuring biographies of indicators evolve rather than fork.
Sources of Cyber Threat Intelligence
Intelligence is only as trustworthy as its source, for it drives credibility and steers legal review if an later triggers business disruption. As an analyst, you must know and note where each indicator originated.
There are four broad sources that you will come across in your practice:
- Internal telemetry: logs, detections, -mailbox submissions provide the highest immediate relevance.
- Commercial services: Vendor premium feeds, paid sandboxes**,** and closed-source analytics. These provide high fidelity, but may have export and sharing limits based on licensing.
- Open-source intelligence (): AbuseIPDB, URLhaus, public blogs with IOCs, and academic research. Before applying, information from these sources will need to be cross-confirmed.
- Communities & ISACs: Sector-specific lists marked with labels and rich context (e.g., FS-ISAC)
Threat Intelligence Classifications

Threat intelligence is geared towards understanding the relationship between your operational environment and your adversary. With this in mind, we can break down threat intel into the following classifications:
-
Strategic intel: High-level intelligence that looks into the organisation's threat landscape and maps out the risk areas based on trends, patterns and emerging threats that may impact business decisions. An example is an annual ransomware trends report predicting a shift to data-wiping extortion in healthcare.
-
Tactical intel: Assessments of adversaries' behaviours through analysis of tactics, techniques, and procedures (TTPs). This can be in the form of Advisory notes, such as detailing new T1059.005 (Visual Basic) abuse in malspam.
-
Operational intel: Campaign-specific details about the motives and intent to perform an attack. This is useful for understanding the critical assets available in the organisation (people, processes, and technologies) that may be targeted.
-
Technical intel: Atomic indicators and artefacts such as and hashes related to an attack.
L1 analysts will escalate many Technical IOCs, observe and document Tactical IOAs, and identify patterns that feed Operational reporting.
IP addresses, Hashes and other threat artefacts would be found under which Threat Intelligence classification?
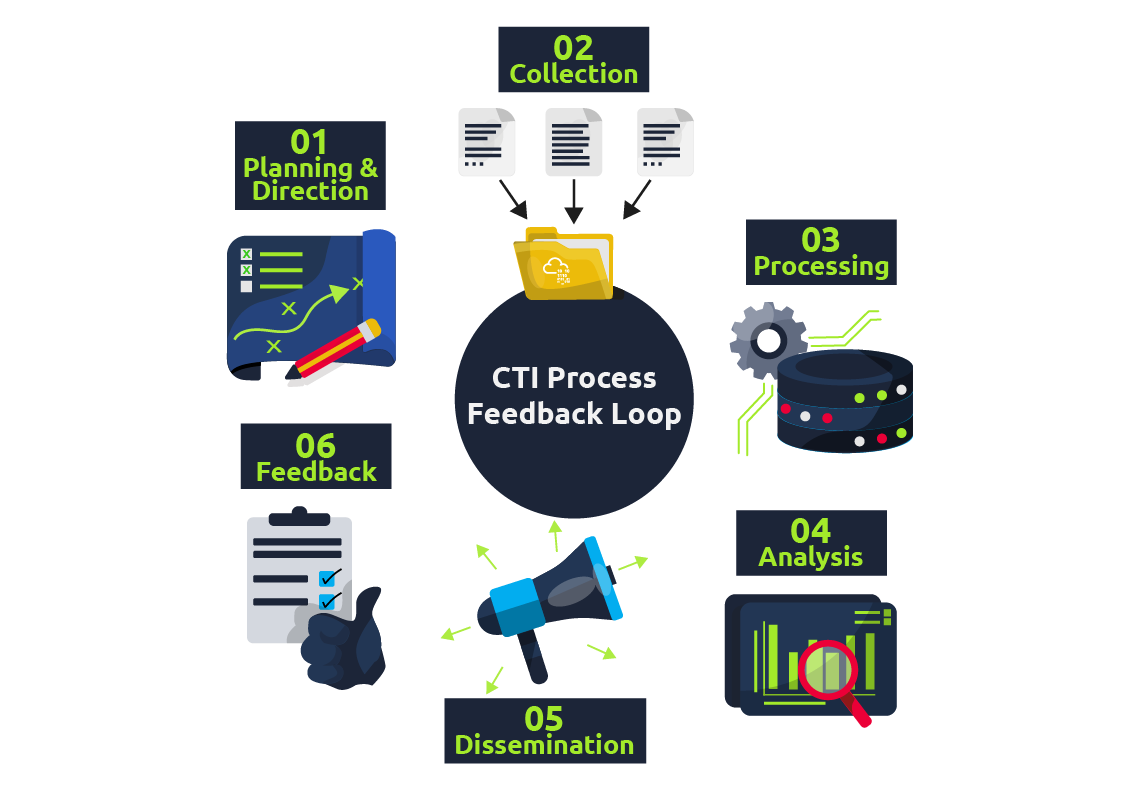
Cyber Threat Intelligence follows a six-phase intelligence lifecycle that transforms raw data into contextualised and action-oriented insights geared towards triaging security incidents. We shall look at this lifecycle as a narrative that follows a single Level 1 analyst, Alex, as they weave into a routine defence objective: protecting TryHatMe's production database.
Before we look into the lifecycle, various concepts are helpful to understand when working with threat intelligence.
Traffic Light Protocol (TLP)—A Primer for Proper Sharing
The Traffic Light Protocol is a four-colour labelling scheme defined by FIRST.org that governs how widely intel may be shared. These labels can be summarised in the following table:
| TLP label | Sharing boundary | Typical L1 behaviour |
|---|---|---|
| TLP: CLEAR | No restriction | Post to the internal wiki or platform. |
| TLP: GREEN | Share with peer community but not publicly | Upload to /Slack workspace restricted to partner SOCs. |
| TLP: AMBER | Organisation-wide, external sharing only with need-to-know clients | Keep within the company platform; reference, do not copy, in tickets. |
| TLP: RED | Named recipients only | Store in an encrypted note; do not post to the ticketing system without clearance. |
While investigating breaches, a Level 1 analyst ensures that an 's TLP label—if provided—travels with the indicator into any platform or triage note. Violating the label can breach contractual obligations and erode trust with intelligence partners.
Intel Formats
Analysts encounter intelligence in various formats or protocols. Once they have gathered intel, they are responsible for sharing and updating other analysts on new findings about attack techniques. One format in which threat intel can be found is Structured Threat Information Expression (STIX). This schema was developed to describe and specify threat indicators, relationships, and context in a machine-readable form.
We can now look into the lifecycle with a real-world scenario.
Scenario Premise
TryHatMe Corp holds sensitive customer data in a PostgreSQL server in a segmented subnet. The server is fronted by a next-generation (NGFW) and monitored on-host by an Endpoint Detection and Response () agent. Senior management has asked the to "bring in cyber-threat intelligence" so that the controls react rapidly to emerging threats. The morning-shift L1 analyst, Alex, is assigned to build and exercise that workflow.
Step 1: Direction – Defining the Mission
Alex begins in a brief planning meeting with the lead and the database administrator. Together, they translate the broad mandate into an intelligence requirement:
-
Primary asset. The PostgreSQL production database.
-
Business risk. Data breach fines under and loss of customer trust.
-
Available controls. NGFW is capable of IP- and domain-based blocking; can quarantine files by hash.
-
Initial goal. Use threat-feed indicators to:
- Block or alert on suspicious IP addresses at the , and
- Detect known malicious file hashes at the layer.
Alex constructs two measurable questions that will steer subsequent collection and analysis:
Q1 Which external IP addresses and domains are currently used to exploit PostgreSQL services or exfiltrate database records?
Q2 Which malware families targeting PostgreSQL drivers or credentials are active this week, and what are their file hashes?
The answers to Q1 and Q2 will become success criteria in later feedback.
Step 2: Collection – Assembling the Raw Material
Guided by the questions, Alex gathers intelligence from four sources:
| Source | Rationale | Example artefacts collected |
|---|---|---|
| Commercial feed from the NGFW vendor | Tailored to the same models, high-fidelity | 37 IPv4 addresses flagged as database-exfil in the last 24 h |
| Open-source project AbuseIPDB filtered by tag PostgreSQL-brute-force | Rapid, community-driven updates | 15 IP addresses, four domains |
| The Malware Information Sharing Platform () is internal to the company | Historical view of incidents | 2 hashes of PgSQL credential stealers |
| Vendor threat report released this week | Strategic insight distilled into technical IOCs | 1 new malware hash, 3 domains |
Alex exports each feed in STIX or CSV, then stores a dated copy in the 's "raw-intel" bucket, ensuring reproducibility.
Step 3: Processing – Normalising and Correlating the Data
Raw feeds never align perfectly, and artefacts may arrive in mixed formats. To correct this, threat intel will need to be normalised and correlated. Normalising ensures threat data from various sources is standardised into a standard format for consistent analysis. Correlation involves identifying connections and links between data from different sources and threats. It can also help identify contradictions, such as having a benign tag in one's history versus a malicious label in new data today.
For Alex, processing threat intel will involve executing scheduled Python scripts that:
-
Normalises indicator syntax such as having IPv6 addresses compressed, domains in lowercase or stripping off IP subnet masks.
-
Correlates and deduplicates against the platform's existing indicator table.
-
Tag each entry with source, date, and TLP label.
-
Converts the final set of intel into two action files, such as:
- firewall_blocklist.csv, a -ready CSV that covers the indicator, action, and comments
- edr_hash_rules.yar, an YARA-rule file for hash blocking.
During processing, Alex spots a collision: one IP address appears in the NGFW feed labelled as TLP: AMBER and AbuseIPDB labels it as TLP: CLEAR. Because the stricter TLP prevails, the combined record inherits TLP: AMBER. This prevents inadvertent disclosure if the list is later shared.
Step 4: Analysis – Turning Information Into Judgement
Blocking every indicator or artefact suspected of being malicious may create room for false positives. Alex would need to evaluate the relevance and matching between the intel gathered and the current status of the investigation. This results in providing answers to the questions in Phase 1:
- indicators (Q1).
Cross-check: A query over the previous 30 days shows one of the NGFW attempting but failing to open 5432 against the production subnet. That event validates the indicator's applicability. - Hash indicators (Q2).
Reverse-search: OpenCTI links the new hash to the PgSteal malware family; Any.Run analysis demonstrates credential-dump behaviour. Because the organisation uses exactly the named ODBC driver, the hash is marked as high priority, and relevance is confirmed.
Alex grades each indicator:
| Confidence | Source agreement | Local sightings | Action |
|---|---|---|---|
| High | Same in ≥2 sources | ≥1 local attempt | Immediate block |
| Medium | Single trusted source | No local hits | Alert-only |
| Low | only | No context | Monitor for 14 days |
Seven IP addresses and one hash meet the high bar; the are queued as medium and set for monitoring.
Step 5: Dissemination – Getting Intelligence to the Right Consumers
Unused threat intelligence becomes shelfware. Alex delivers tailored output:
| Stakeholder | Format | Why do they need it |
|---|---|---|
| team | CSV upload + change-ticket | They own the block rules; the ticket is to document risk and indicator TLP |
| Endpoint team | YARA rule set in the console | To load rules into the policy |
| platform | Indicator objects with full tags | Keeps history of artefacts, supports future correlations, and honours TLP |
| Management | 200-word summary in weekly cyber-risk memo | The report shows the return on investment for the process |
By tailoring depth to the audience, Alex ensures that each consumer receives only the detail required to act, nothing more and nothing less.
Step 6: Feedback – Measuring and Refining the Cycle
Two weeks later, metrics and reports from the and reports show the progress of establishing an effective threat intelligence workflow:
| KPI | Baseline | After the first cycle |
|---|---|---|
| Median dwell time of PgSQL brute-force | 48 h | 0 h (pre-emptive block) |
| False-positive rate on new blocks | — | 0 % (none revoked) |
Because the outcome meets the initial direction objectives, management approves expansion: the next will add other threat parameters, such as tunnelling IOCs for the same asset group. Alex updates the direction document, closes the feedback loop, and schedules the second iteration.
During which phase do security analysts get the chance to define the questions to investigate incidents?
Standards and frameworks provide structures to rationalise the distribution and use of threat intel across industries. They also allow for common terminology, which helps in collaboration and communication. Here, we briefly look at some essential standards and frameworks commonly used.
ATT&CK
A malicious command may look obvious, but your ticket needs a label everyone else recognises. 's ATT&CK framework supplies that label. Each technique—T1059.001 , T1048.003 tunnel, and so on—acts as a Rosetta Stone between vendors, teammates, and auditors, providing knowledge about adversarial behaviour.
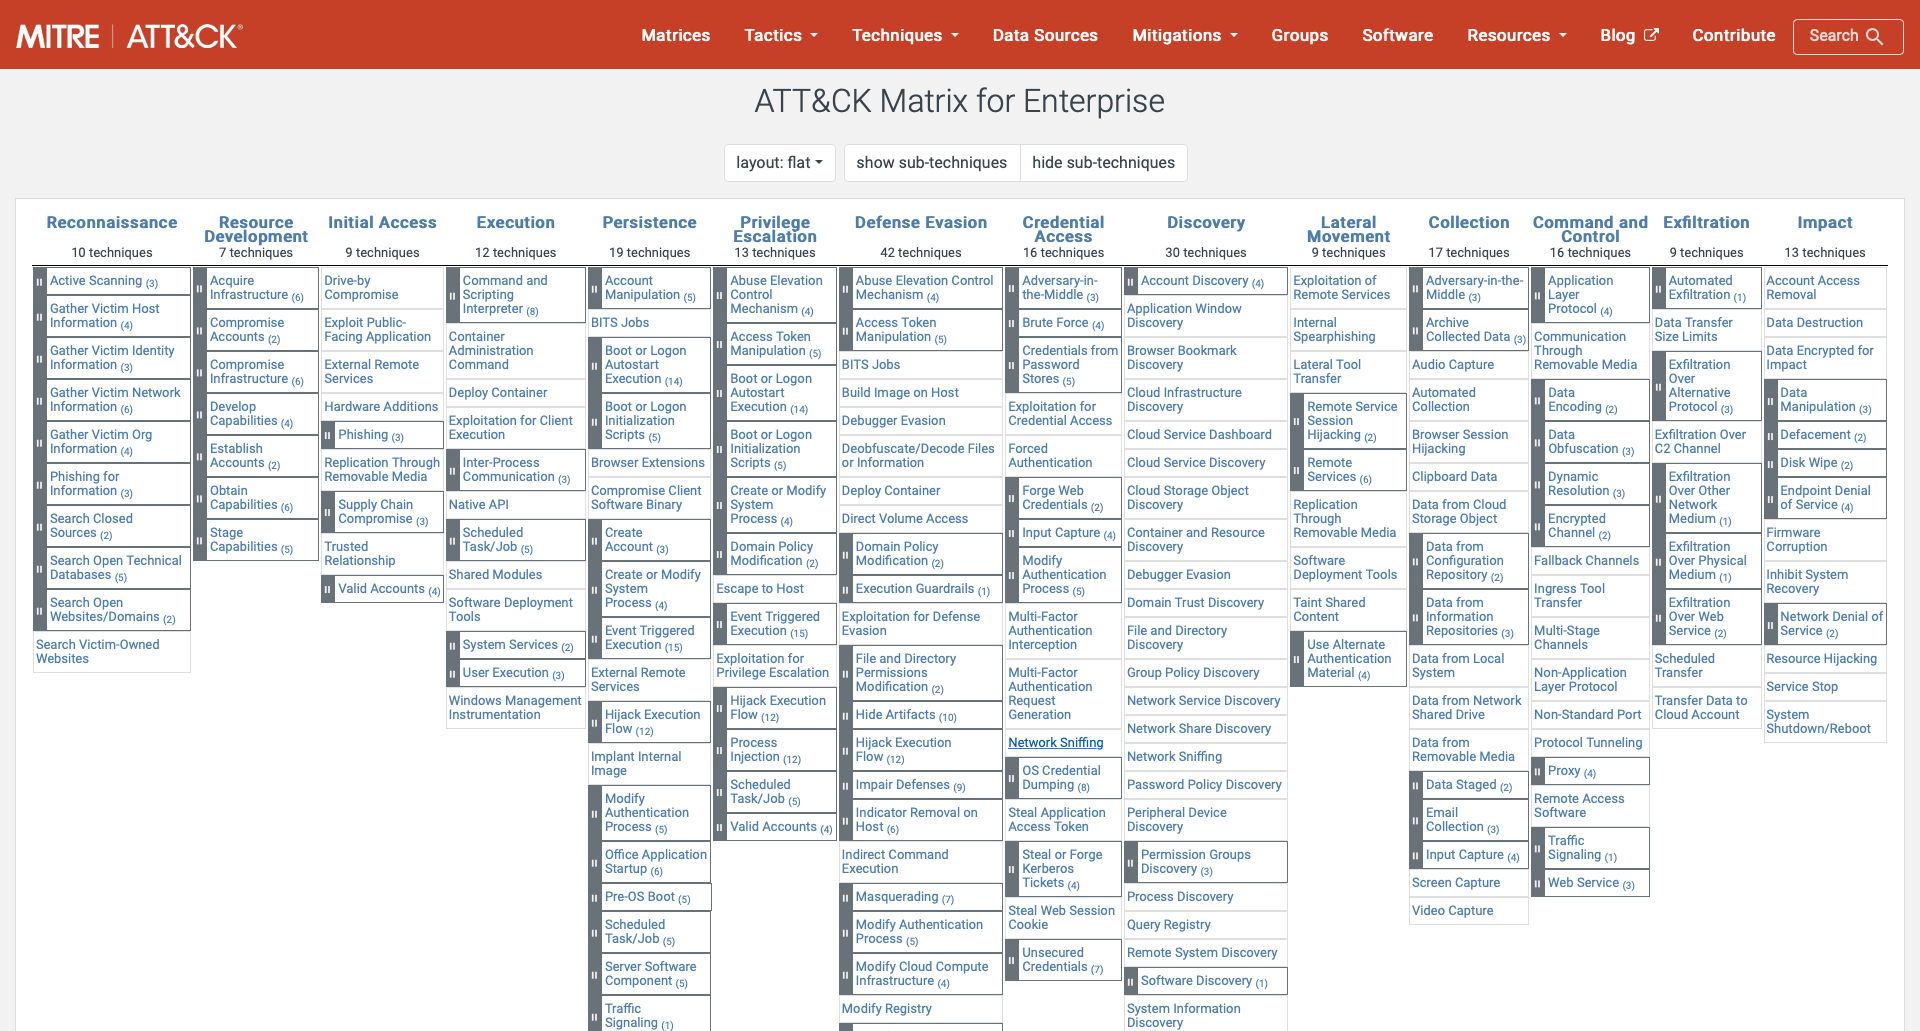
As an L1 analyst, you can use the matrix during an investigation in the following way:
- Match the behaviour in the alert to a tactic/technique pair.
- Write the ID in your triage note: "Observed T1071.001 (web-based ) against FINANCE-TRYHATME-00".
- Hand the note to Level 2 or Incident Response; they instantly know which mitigations and threat-actor profiles apply.
D3FEND
If ATT&CK catalogues how adversaries attack, D3FEND catalogues how defenders respond. Each entry maps to defensive tactics such as Credential Hardening or Data Obfuscation_._
A case for this would look similar to this:
- Your raises a T1048.003 tunnel alert.
- Search D3FEND for the matching defensive technique: D3—NTDN —request analysis. The page lists practical controls: block extensive TXT records and alert on uncommon query .
- Add the most feasible control to your "next actions" field; you have just supplied a mitigation, not only a diagnosis.
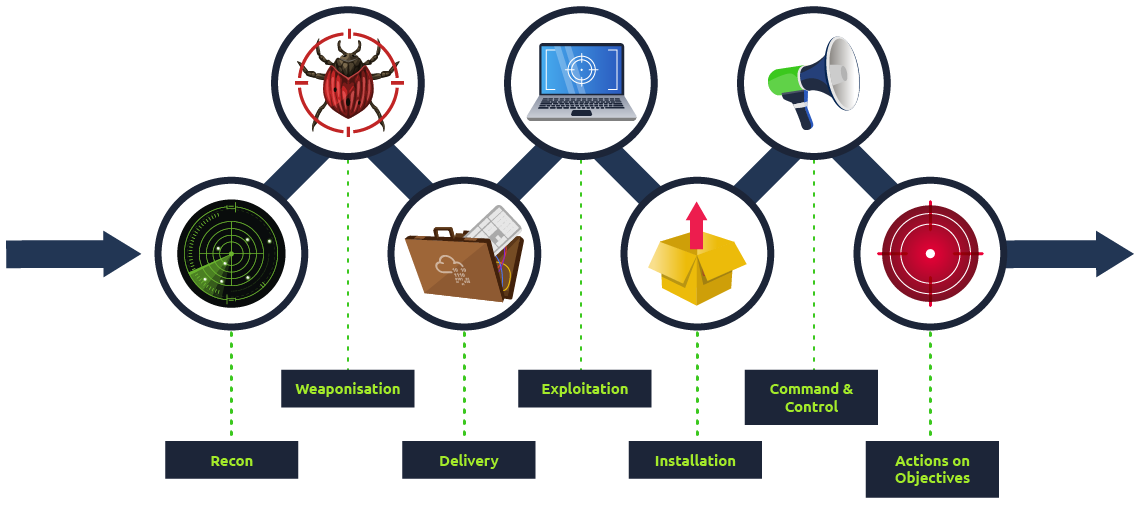
Cyber Kill Chain
The Cyber Kill Chain, developed by Lockheed Martin, breaks down adversary actions into steps. This breakdown helps analysts and defenders identify which stage-specific activities occurred when investigating an attack. The phases defined are shown in the image below.
| Technique | Purpose | Examples |
|---|---|---|
| Reconnaissance | Obtain information about the victim and the tactics used for the attack. | Harvesting emails, , and social media, network scans |
| Weaponisation | Malware is engineered based on the needs and intentions of the attack. | Exploit with a backdoor, a malicious Office document |
| Delivery | Covers how the malware would be delivered to the victim's system. | Email, weblinks, USB |
| Exploitation | Breach the victim's system vulnerabilities to execute code and create scheduled jobs to establish . | EternalBlue, Zero-Logon, etc. |
| Installation | Install malware and other tools to gain access to the victim's system. | Password dumping, backdoors, and remote access trojans |
| Command & Control | Remotely control the compromised system, deliver additional malware, move across valuable assets and elevate privileges. | Empire, Cobalt Strike, etc. |
| Actions on Objectives | Fulfil the intended goals for the attack: financial gain, corporate espionage, and data exfiltration. | Data encryption, ransomware, and public defacement |
Over time, the kill chain has been expanded using other frameworks, such as ATT&CK, and a new Unified Kill Chain has been formulated.
CVEs, , and the NVD
A queue contains almost as many vulnerability notifications as malware alerts. As an L1 analyst, you must understand how to identify and organise vulnerability notifications.
- (Common Vulnerabilities and Exposures) — provides a catalogue number for discovered vulnerabilities, e.g., -2023-4863.
- (Common Vulnerability Scoring System) — a 0–10 severity scale with temporal and environmental modifiers for vulnerabilities.
- NVD (National Vulnerability Database) — the canonical repository that links numbers to scores, exploits, and affected products.
Sharing and Processing Intel
We previously discussed platforms and feeds from which threat intelligence can be retrieved. When organisations publish fresh indicators, every peer that consumes and validates them strengthens the collective defence and feeds back improvements. This information looks to hinge on two standards: STIX and TAXII.
- STIX: We mentioned STIX previously as the structured schema for describing threat information.
- TAXII: The Trusted Automated eXchange of Indicator Information is a set of secure APIs used to exchange threat intelligence in near real-time for detection, prevention, and mitigation of threats.
It supports two sharing models: Collection, which ensures threat intel is collected and hosted by a producer, and Channel, which publishes threat intel to users from a central server.
Sharing threat intelligence has its benefits, with near-real-time feeds shortening the gap between another organisation's incident and one's preventive procedures. Additionally, community contributions earn organisations reciprocal trust as valuable intelligence sources.
That said, not every indicator should be shared. Privacy laws, customer NDAs or internal competitive information may forbid disclosure, and sharing specific IOCs early can tip off adversaries that their campaign has been detected.
When an adversary has obtained access to a network and is extracting data, what phase of the kill chain are they on?
As part of the dissemination phase of the lifecycle, is also distributed to organisations using published threat reports. These reports come from technology and security companies researching emerging and actively used threat vectors. They are valuable for consolidating information presented to all suitable stakeholders. Some notable threat reports come from Mandiant (opens in new tab) and Palo Alto Unit42 (opens in new tab).
All the things we have discussed come together when mapping out an adversary based on threat intel. To better understand this, we will analyse a simplified engagement example. Click on the green "View Site" button in this task to open the Static Site Lab and navigate through the security monitoring tool on the right panel, and fill in the threat details.
What was the name of the file downloaded?
After building the threat profile, what message do you receive?
Ready to learn Cyber Security?
TryHackMe provides free online cyber security training to secure jobs & upskill through a fun, interactive learning environment.
Already have an account? Log in