
Hosted Hypervisors
Learn about Hosted Hypervisors, how to investigate them, and more.
easy

To access material, start machines and answer questions login.
Introduction
Hosted Hypervisors, also known as Type 2 Hypervisors, are a form of virtualization technology that operates on top of an existing operating system rather than directly interfacing with the underlying hardware. This setup allows them to manage lab machines within the context of the host .
While Hosted Hypervisors are not as common an area for investigations as their server counterparts, there are situations where investigations are required on either the host containing the Hypervisor or a running on the target computer.
In this room, we'll learn the foundations of identifying Hypervisors on a system, and where to find evidence of malicious behavior or any investigation we are required to perform. This room uses the Windows as the base system, but some examples and use cases described may apply to other .
Learning Objectives
- Detect the presence of a Hypervisor on a Host
- Analyze a VirtualBox-hosted Hypervisor
- Analyze a VMware-hosted Hypervisor
Caveats
- The Hyper-V Hypervisor is intentionally left out of this room since it will be covered separately
- This room focuses on Hypervisor investigation, not investigation, which is covered separately
Prerequisites
Click to complete the task.
Set up your virtual environment

For the following learning tasks in this room, we will use a to aid in your learning. Start the attached machine in this task by clicking the Start Lab Machine button. A split-screen view of the will appear. In case the is not visible, use the blue Show Split View button at the top of the page.
Alternatively, you can use to access the for this room with the following credentials:

| Username | Administrator |
| Password | Hypervisors123 |
| IP | MACHINE_IP |
Click the Complete button when the VM is visible and you are ready to continue.
Hypervisors and Network Components
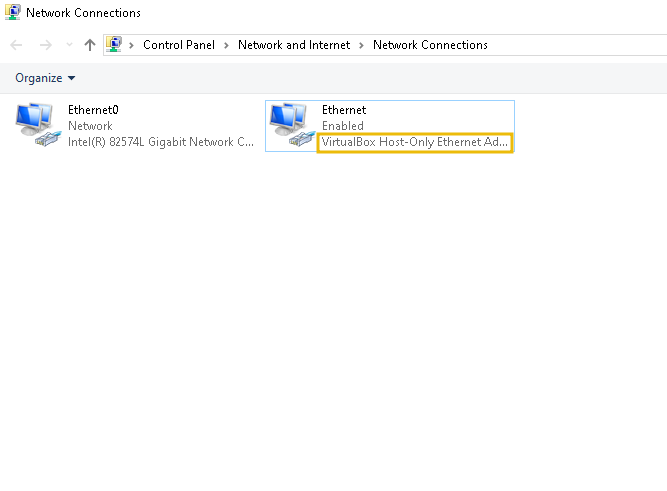
If we have local access to the target we are investigating, we can detect the presence of Hypervisors like VMware Workstation or VirtualBox by looking for signs that these programs are currently installed. Additionally, we can search for traces or remnants left behind from previous installations, even if the Hypervisors have been deleted or removed from the system.
Let's explore how to identify a Hypervisor installation by examining the network interfaces. This approach can be effective not only when you have direct access to the lab machine but also when you are working with a memory dump of the host system.
Sometimes, VMs can be used to hide suspicious activities or exploited by threat actors to target specific subjects who will use a to run malicious code.
The same applies to VMware workstations; we can observe interfaces present on a host, as displayed below.
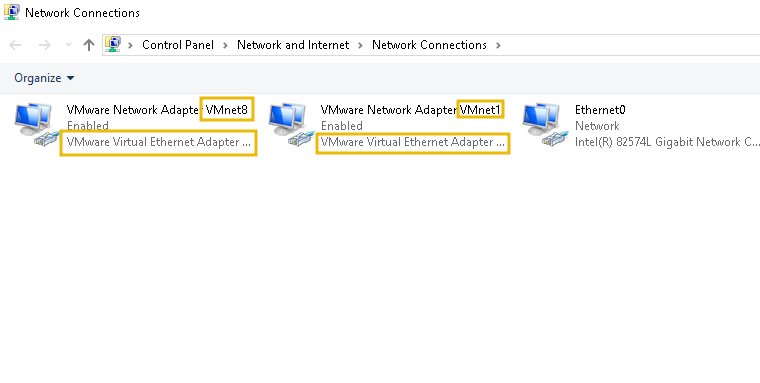
If we prefer the command line, or we don't have access to the Graphical Interface, we can use CMD and the command ipconfig or we can use PowerShell to get a list of the interfaces using the command:
Get-NetAdapter
, as the output below displays.
												user@tryhackme$ get-netadapter

Ethernet 4                VirtualBox Host-Only Ethernet Adapter        10 Up           0A-00-27-00-00-0A         1 Gbps
Ethernet                  AWS PV Network Device #0                      7 Up           02-11-B6-D2-7E-B3         1 Gbps
VMware Network Adapte...8 VMware Virtual Ethernet Adapter for ...       6 Up           00-50-56-C0-00-08       100 Mbps
VMware Network Adapte...1 VMware Virtual Ethernet Adapter for ...       2 Up           00-50-56-C0-00-01       100 Mbps
ifconfig or ip addr.
- NAT: Traffic will use NAT to translate traffic from the VM going to the network before using the host interface
- Host-only: Traffic will only be routed internally on the Hypervisor
- Bridged: Traffic will be routed with no translation to the host interface
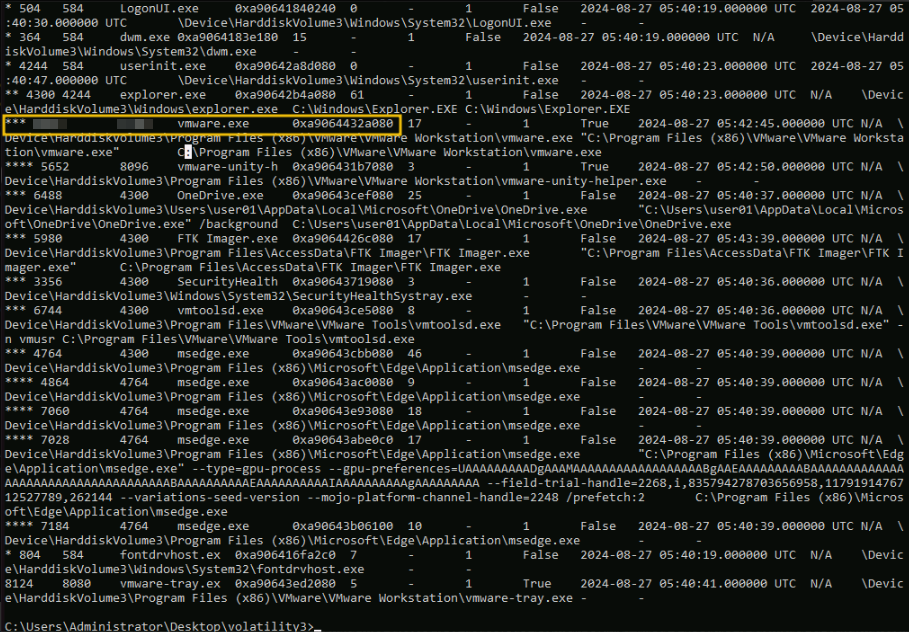
08:00:27 and 0A-00-27 , while VMware addresses start with 00:50:56. windows.pstree, a plugin for listing processes in a tree based on their parent process ID, can reveal its presence. vmware.exe is present, indicating that VMware was running when the memory dump was taken (in the case of VirtualBox, the process name will be VBoxSVC.exe). This does not reveal if a VM was active at that moment but can tell us about the presence of a Hypervisor, as shown in the screenshot below, by navigating to the C:\Users\Administrator\Desktop\Volatility3 directory and executing the command: python vol.py -f ..\memdump.mem windows.pstree
Note: Since the output can be difficult to read, you can use the > switch to redirect the output to a file we can later open in something handy like a text editor. Running volatility for the first time may take about 5 minutes to finish executing.
vmnat.exe
(In VirtualBox, this is handled by the process
VirtualBoxVM.exe
). Using the volatility plugin
windows.netstat
will allow us to verify that, as shown below, using the command:python vol.py -f ../memdump.mem windows.netstat
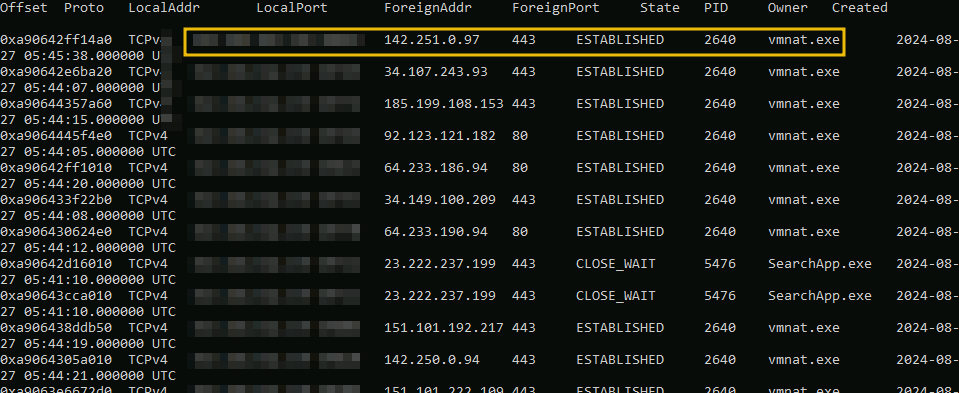
vmnat.exe, indicating that traffic is being routed out of the network.What is the PID of the process vmware.exe on the memory dump: memdump.mem?
What is the name of VirtualBox service process in Windows?
Now, we'll discuss how to investigate a specific Hypervisor: The
VirtualBox Hypervisor.
VirtualBox is an open-source software that enables us to create and manage multiple lab machines (VMs) on a
single physical computer. This is particularly useful for testing, development, and running applications that require
different environments. VirtualBox provides the flexibility to allocate resources like , memory, and storage to
each lab machine, ensuring that they operate independently and efficiently.
When trying to understand how a Hypervisor works, VirtualBox has the advantage of being open-source, so if we want to understand better how a Hypervisor works, we can take a look at the actual source code and build it. While this is out of the scope of this room, you can find instructions and the code here (opens in new tab).
When it comes to VirtualBox, one of the best ways to handle
logging and managing the is through the command-line interface provided by VirtualBox.
One of the tools is VBoxManage. We can find it in the default location
C:\Program Files\Oracle\VirtualBox, and from there, we can find an executable called VBoxManage.exe.
There are several uses for this tool; for example, we could start a VM from the command line with a command similar
to the one below.
Vboxmanage.exe startvm {name of the vm}
We could also enable debug logs if we want more verbosity with the
following command.
VBoxManage.exe debugvm {name of the vm} log --all
We can find more information about VboxManage here (opens in new tab).
VirtualBox Logs
We'll find logs and information about VirtualBox in two main
places. The locations provided in this room are the locations used by VirtualBox by default. Still, they can be
different if another path is chosen during installation, so we should always check for logs in other directories if
we are unable to find them in their default location.
First, we can find general information about the Hypervisor in
C:\Users\{username}\.VirtualBox. This folder
contains logs related to the Hypervisor itself and not to a specific VM, as well as some other basic
information. Let's review some of the files we can find in this
folder:
| VirtualBox.xml |
While this is not strictly a log file but rather a configuration file used by
VirtualBox, we can get good information from it, like the interface IP used by the Hypervisor, the virtual
interfaces used by a VM, uid, log locations, VM files location, etc. We need to be careful not to edit this
file since the Hypervisors use it, and it could lead to failure if settings are not properly set. |
| selectorwindow.log |
contains information about the VirtualBox process (usually the details used to
install/start). |
| VboxSVC |
saves information regarding the start/stop use of VirtualBox and also
saves/deletes components. |
| Vbox.log |
This file contains information such as the OS, with details about their
architecture and installation dates (timestamps). It also contains information about the VM plugins and
drivers that were implemented (audio, USB, etc.). |
| VBoxHardening.log |
This file will provide us with information about the hardening performed on
VirtualBox; this is focused on the memory management of the Hypervisor. While this information can be hard to
read and is not well documented, if we were looking for some memory manipulation (like an escapeVM
attack), we could detect it here. Also, some security-related crashes will be visible in this file. |
VirtualBox Memory Dump
Finally, we'll maybe want to create a memory dump of a VM in
VirtualBox; for that, we can use VBoxManage to create the image. We can do it by using cmd.exe and navigate
to C:\Program Files\Oracle\VirtualBox, and execute the VBoxManage tool using the following syntax.
Note: Volatility2 is not installed on the VM. The below is just an example.
VBoxManage.exe debugvm {name of the vm} dumpvmcore --filename={output file name}
After that, we need to use Volatility2; since this feature is not supported on Volatility3, the command to convert the core dump into a memory dump is the following:
python vol.py -f {output file name} imagecopy -O {new output file name}
This will create a memory dump of the machine for us to
investigate the internal memory of it.
Note: It's also worth mentioning that you can inspect snapshots on the default
directory. C:\Users\user01\VirtualBox VMs\secretvm\Snapshots. Also, the Virtual disk used by the can be found in the
directory, and while it is not strictly a Hypervisor investigation, it can be helpful.
Where is the VboxManage tool typically located?
Now, let's take a look at how we can investigate when dealing with a VMware workstation Hypervisor.
VMware Workstation is also a Hypervisor, similar to VirtualBox. We can use it to create and manage lab machines, each operating as a separate computer with its own operating system and applications.
We can retrieve settings and configuration information in C:\ProgramData\VMware\VMware Workstation. We'll usually find 3 files:
| settings.ini | This file contains configuration settings, such as printers and disks, which are applied globally across different VMs. |
| config.ini | Contains specific configurations like Auto-Update, access ports, and others. |
| vmautostart. | Contains configuration information on how Lab Machines are supposed to start. |
Note: The directory C:\ProgramData is hidden by default in Windows OS.
Let's explore the content of vmautostart.xml, which is displayed below.
<!--
 This is a sample configuration file for the Lab Machine Autostart
 functionality. You may uncomment the below section and specify the path to
 the vmx files of those Lab Machine which you want to automatically
 power-on when the host machine starts or whenever the "VMware Autostart
 Service" is started.
 -->
<ConfigRoot>
    <AutoStartOrder>
    <!-- e id="0">
          <vmxpath>C:\Users\Administrator\Documents\Lab Machines\Windows10x64\Windows10x64.vmx</vmxpath>
          <startOrder>0</startOrder>
        </e>
        <e id="1">
          <vmxpath>C:\Users\Administrator\Documents\Lab Machines\VM2\VM2.vmx</vmxpath>
          <startOrder>0</startOrder>
    </e -->
    </AutoStartOrder>
</ConfigRoot>
In the above output, we can observe and reveal relevant information, such as the vmxpath filesystem path, where a VMware Workstation lab machine's files, including .vmx and .vmdk files, are stored. Specific logs for each VM can be found in the path of the lab machine location, in this case: C:\Users\Administrator\Documents\Lab Machines\{name of the vm}
VMware Workstation Logs
We can find the Hypervisor logs in Windows in the following location: C:\ProgramData\VMware\logs; the name of the log usually starts with the name of the logging process vmmsi.log, followed by the date and time information, for example, vmmsi.log_20240822_234016. Below, we can find an example of the log file.
								=== Verbose logging started: 8/22/2024  23:38:24  Build type: SHIP UNICODE 5.00.10011.00  Calling process: C:\Users\Administrator\Downloads\VMware-workstation-17.5.2-23775571.exe ===
MSI (c) (CC:40) [23:38:24:407]: Font created.  Charset: Req=0, Ret=0, Font: Req=MS Shell Dlg, Ret=MS Shell Dlg

MSI (c) (CC:40) [23:38:24:407]: Font created.  Charset: Req=0, Ret=0, Font: Req=MS Shell Dlg, Ret=MS Shell Dlg

MSI (c) (CC:B0) [23:38:24:423]: Resetting cached policy values
MSI (c) (CC:B0) [23:38:24:423]: Machine policy value 'Debug' is 0
MSI (c) (CC:B0) [23:38:24:423]: ******* RunEngine:
           ******* Product: C:\Program Files (x86)\Common Files\VMware\InstallerCache\{CA8F10D6-31EC-42F4-A94E-0061A5D183D1}.msi
           ******* Action:
           ******* CommandLine: **********
MSI (c) (CC:B0) [23:38:24:423]: Machine policy value 'DisableUserInstalls' is 0
MSI (c) (CC:B0) [23:38:24:423]: Note: 1: 1402 2: HKEY_CURRENT_USER\Software\Microsoft\Windows\CurrentVersion\Policies\Explorer 3: 2
MSI (c) (CC:B0) [23:38:24:423]: SOFTWARE RESTRICTION POLICY: Verifying package --> 'C:\Program Files (x86)\Common Files\VMware\InstallerCache\{CA8F10D6-31EC-42F4-A94E-0061A5D183D1}.msi' against software restriction policy
MSI (c) (CC:B0) [23:38:24:423]: SOFTWARE RESTRICTION POLICY: C:\Program Files (x86)\Common Files\VMware\InstallerCache\{CA8F10D6-31EC-42F4-A94E-0061A5D183D1}.msi has a digital signature
MSI (c) (CC:B0) [23:38:25:095]: SOFTWARE RESTRICTION POLICY: C:\Program Files (x86)\Common Files\VMware\InstallerCache\{CA8F10D6-31EC-42F4-A94E-0061A5D183D1}.msi is permitted to run at the 'unrestricted' authorization level.
MSI (c) (CC:B0) [23:38:25:095]: Cloaking enabled.
MSI (c) (CC:B0) [23:38:25:095]: Attempting to enable all disabled privileges before calling Install on Server
MSI (c) (CC:B0) [23:38:25:095]: End dialog not enabled
MSI (c) (CC:B0) [23:38:25:095]: Original package ==> C:\Program Files (x86)\Common Files\VMware\InstallerCache\{CA8F10D6-31EC-42F4-A94E-0061A5D183D1}.msi
MSI (c) (CC:B0) [23:38:25:095]: Package we're running from ==> C:\Program Files (x86)\Common Files\VMware\InstallerCache\{CA8F10D6-31EC-42F4-A94E-0061A5D183D1}.msi
MSI (c) (CC:B0) [23:38:25:142]: APPCOMPAT: Compatibility mode property overrides found.
MSI (c) (CC:B0) [23:38:25:158]: APPCOMPAT: looking for appcompat database entry with ProductCode '{CA8F10D6-31EC-42F4-A94E-0061A5D183D1}'.
MSI (c) (CC:B0) [23:38:25:158]: APPCOMPAT: no matching ProductCode found in database.
MSI (c) (CC:B0) [23:38:25:173]: MSCOREE not loaded loading copy from system32
Above, we can observe the logs from the Hypervisor; if we want to spot an attacker's exploit causing crashes or strange behavior, this would be one of the key places to look.
VMware VM Memory Dump
Finally, If we want to create a memory dump of a VM on a VMware workstation, we need to use or take a screenshot of the VM we want to dump the memory on, and then we need to use a tool to convert it to a memory dump. A commonly used tool for this is "vmss2core." The following command will allow us to dump the memory of a VM.
vmss2core -W {snampshot.vmss} {new name of dump.vmem}
What file should you look at to determine which VMs have an autostart functionality?
Where are the Hypervisor logs typically located?
Use what we learned in the previous tasks and answer the question by accessing the for this room. There's a memory dump exercise.mem alongside the necessary files in C:\Users\Administrator\Desktop
Investigate the VMware logs. Can you find the flag that starts with THM{}?
Analyze the processes on the memory dump C:\Users\Administrator\Desktop\exercise.mem on the room VM. What is the PID of the VBoxSVC.exe process?
Analyze the processes on the memory dump C:\Users\Administrator\Desktop\exercise.mem on the room VM. What is the IP of the Virtual Network Adapter?
In this room, we learned the basics of Hypervisor investigation. We identified how to spot traffic on the host and extract valuable information from logs. We also practice our learning in a practical scenario that allows us to navigate through the host machine and the Hypervisor to be able to answer the questions.
Click to complete the room.
Ready to learn Cyber Security?
TryHackMe provides free online cyber security training to secure jobs & upskill through a fun, interactive learning environment.
Already have an account? Log in