
KQL (Kusto): Basic Queries
This room is designed to work you through basic KQL queries for analyzing security logs.
easy

To access material, start machines and answer questions login.
Let's delve into security log analysis with some basic queries. These queries target logs of different types, and with little practice, you will be able to use like a professional, analyzing logs and performing threat hunting activities to keep your organization safe.

Learning Objectives
- Understanding the difference between and
- How to use the where operator to find suspicious events
- How to use the search and summarize operators
- Using the let statement to declare variables
Learning Prerequisites
- It is strongly recommended to have completed the MS Sentinel module
- Having completed the (Kusto): Introduction room
If you are familiar with , there are some similarities to . However, is designed to manage structured data in relational databases. , on the other hand, is designed to query extensive amounts of structured, unstructured, and semi-structured data, such as logs and telemetry data, in real-time analytics situations.
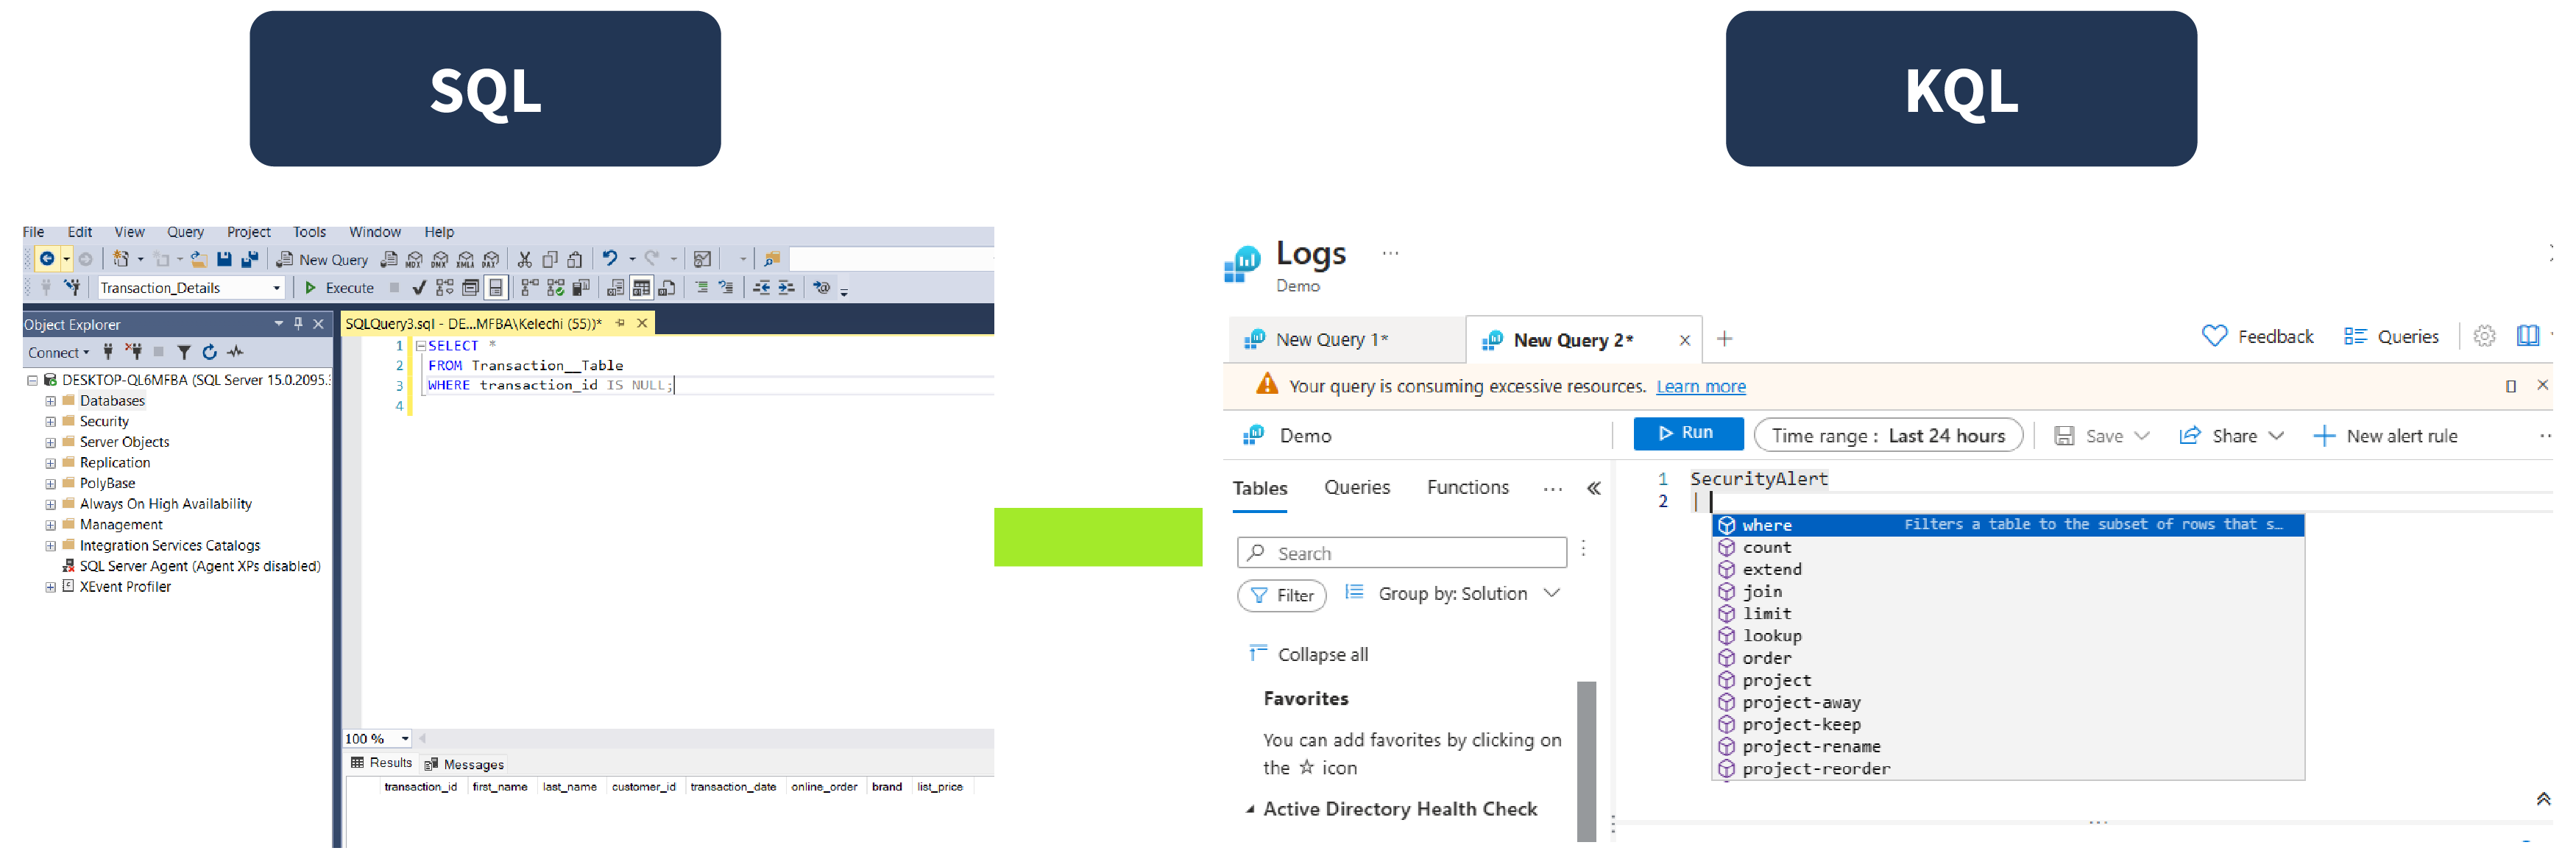
to Comparison Sheet
Below is a cheat sheet that includes some common queries and their equivalents to help you transition to .
| Category | ||
| Select data from a table | SELECT * FROM table_name | table_name |
| Select data from a table | SELECT column1, column2 FROM table_name | table_name | project column1, column2 |
| Aggregation/ Grouping | SELECT DISTINCT column FROM table_name | table_name | summarize by column |
| Aggregation/ Grouping | SELECT AVG(column1), SUM(column2) FROM table_name | table_name | summarize AvgColumn1=avg(column1), SumColumn2=sum(column2) |
| Aggregation/ Grouping | SELECT COUNT(\*) FROM dependencies GROUP BY name HAVING COUNT(\*) > 3 | table_name | summarize Count = count() by name | where Count > 3 |
| Select data from a table | SELECT TOP 10 * FROM table_name | table_name | take 10 |
| Filtering data | SELECT * FROM table_name WHERE condition |
table_name | where condition |
| Top n by measure | SELECT * FROM table_name ORDER BY column | table_name | order by column asc |
| Top n by measure | SELECT TOP 10 * FROM table_name | table_name | top 10 by * |
| Join | SELECT * FROM table1 INNER JOIN table2 ON table1.column = table2.column | table_name | join kind=inner table2 on $left.column == $right.column |
| Select data from a table | SELECT name, resultCode FROM dependencies | table_name | project name, resultCode |
| Subquery | SELECT column1 FROM (SELECT * FROM table_name) AS subquery | let subquery = table_name; subquery | project column1; |
| Comparison operator (date) | SELECT * FROM dependencies WHERE timestamp > getdate()-1 | table_name | where timegenerated > ago(1d) |
It is worth noting that is primarily used within Microsoft services such as Azure Data Explorer, Microsoft Defender, and Microsoft Sentinel for log analytics and telemetry data. It is designed to perform fast and efficient data exploration and analysis, especially with time-series data. While the cheat sheet above covers some basic operations, don't forget that has a wide range of functions and capabilities for more advanced scenarios.
What is the purpose of the query "table_name | where condition"?
All the queries discussed in this room can be practiced by clicking Demo Log Analytics (opens in new tab) to launch a free demo workspace. However, the logs are dynamic, so you will likely not get the same results. Adjust to a custom starting time frame of January 30, 2025, if no results are found. If you are required to log in, click the Cloud Details button below, then Join Lab to find your login information in the Credentials tab. With the new Microsoft multifactor authentication enforcement, you will also be required to set up to sign in.
Operators
As a security analyst or engineer, understanding different operators is essential. It would enable you to seamlessly filter, manipulate, and analyze large amounts of logs quickly and efficiently. Different operators perform different functions. Some are comparison operators that help you pinpoint specific events, and some are aggregation operators that allow you to summarise events. Whether monitoring system performance or hunting for threats, mastering is critical to fully utilizing ingested logs in Microsoft Sentinel.
Okay, let us take a closer look at some of these key operators. In the upcoming tasks, including this one, we will focus primarily on various operators and how they are used in queries.
Where Operator
The where operator filters logs based on specific conditions. It allows you to selectively retrieve rows from a table that meet certain criteria, making it an essential tool for narrowing down the scope of your analysis.
Conditions with the where operator can include comparison operators (e.g., equals, not equals, greater than, less than), logical operators (e.g., AND, OR), and even functions (e.g., startswith(), contains()).
Examples
Finding All the Security Events in the Past 3 Hours
This query will give an output of all the security events in the past 3 hours.
SecurityEvent
| where TimeGenerated > ago(3h)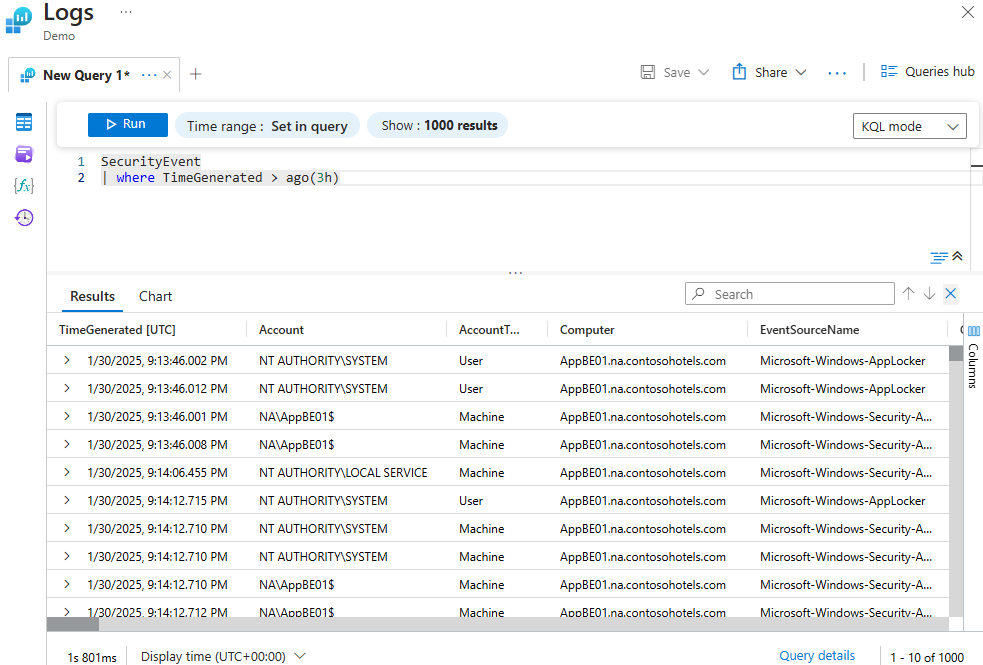
Finding All Security Events for a Particular Computer
The query below returns all the security events associated with the computer defined. Since no duration is determined, it uses the time range value at the top of the query editor (24 hours).
SecurityEvent
| where Computer == "DC11.na.contosohotels.com"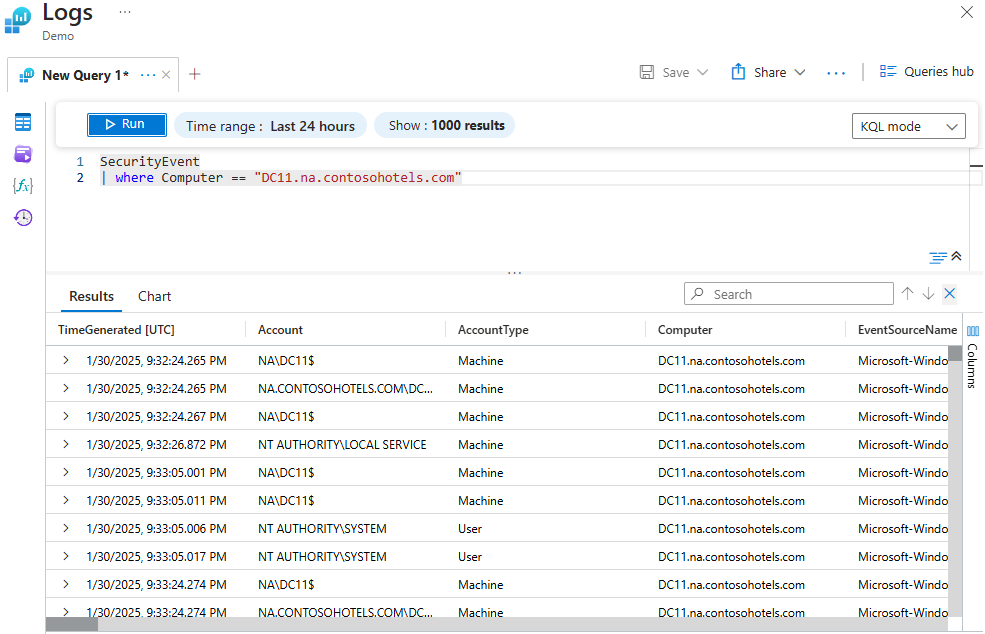
Finding All Lab Machine Connections From a Particular Location
The below query returns all lab machine connections from Ireland in the past 48 hours from the VMConnection table. Scroll to the right to see more columns.
VMConnection
| where RemoteCountry == "Ireland"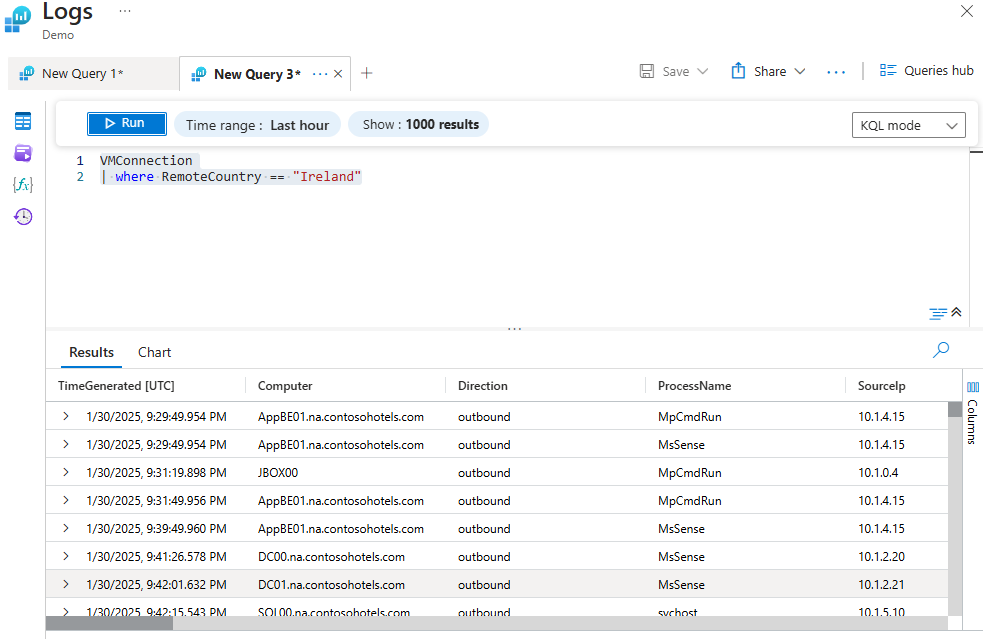
Sort Operator
The sort operator arranges the rows of the output table in a specific order based on one or more columns, either ascending or descending. A similar operator is the order by operator, which is essentially an alias for the sort by operator and is used for the same purpose.
Examples
Arrange an Output by a Specific Column in Ascending Order
The query below retrieves failed logon attempts from the SecurityEvent table, filters them by event ID, and sorts the output by the account column in ascending order.
SecurityEvent
| where EventID == 4625
| sort by Account asc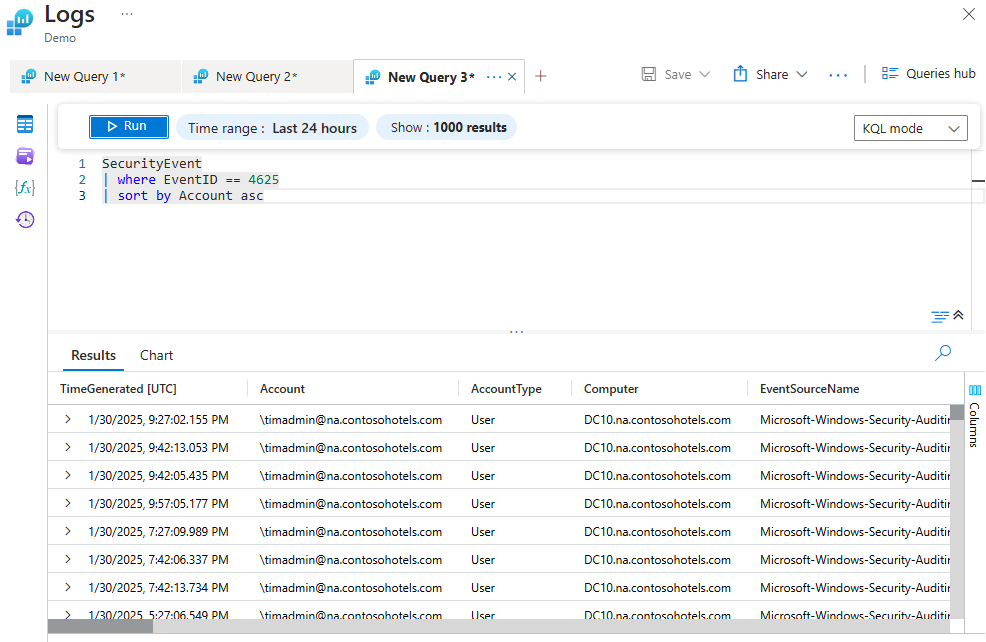
Arrange an Output by a Specific Column in Descending Order
The query below retrieves machines with potential malware detected from the ProtectionStatus table and sorts them by computer in descending order. The first where filters the logs by the TimeGenerated column, in this case, 1 hour ago, while the second where filters the ThreatStatus column with the entry "No threats detected". Scroll to the side for more column details.
ProtectionStatus
| where TimeGenerated > ago(1h)
| where ThreatStatus != "No threats detected"
| sort by Computer desc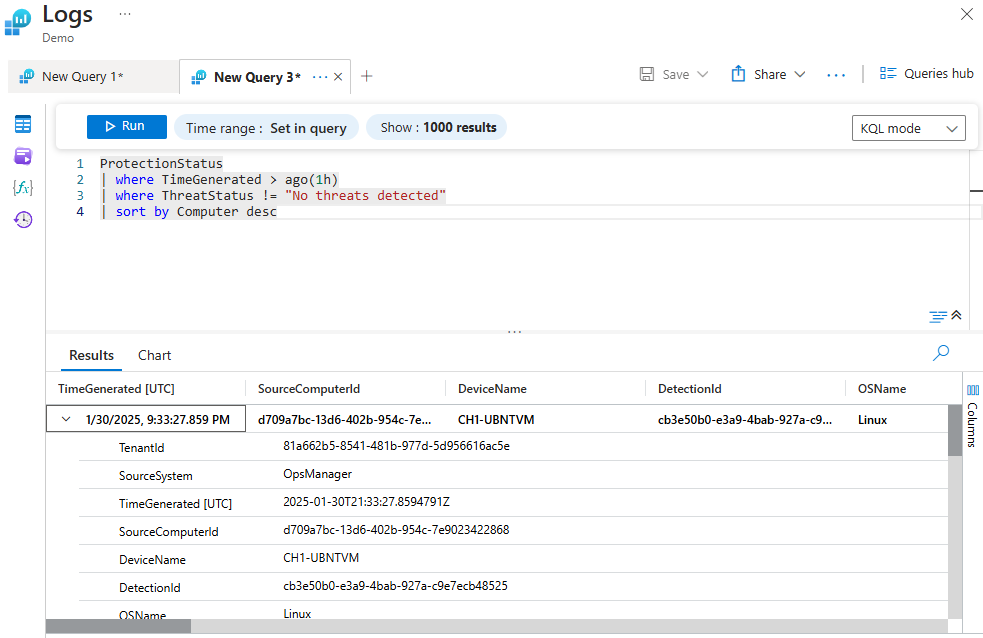
Using the "Order By" Operator to Sort a Query Output
The query filters the VMConnection table for entries where the Computer column is "DC11.na.contosohotels.com" and the RemoteCountry column is "France," then sorts the results in ascending order by the ProcessName column.
VMConnection
| where Computer == "DC11.na.contosohotels.com"
| where RemoteCountry == "France"
| order by ProcessName asc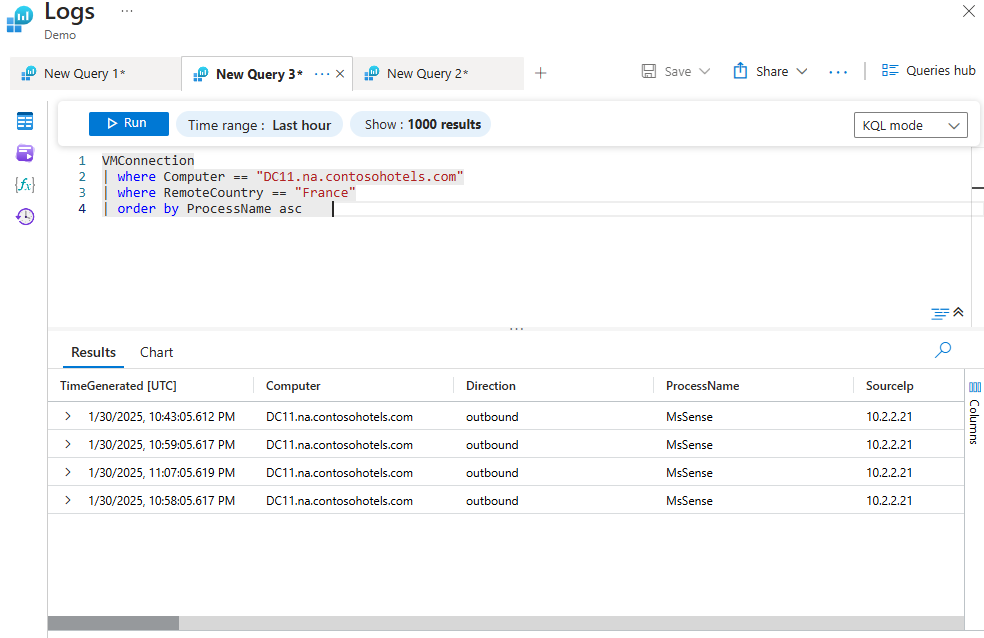
Note: To answer the questions, adjust to a custom starting time frame of January 30, 2025.
What default time range value is used if no duration is defined within a query?
On the "Using the "Order By" Operator to Sort a Query Output" query, what column is the output arranged by?
Search Operator
The search operator allows you to search for data across multiple tables and/or columns. However, it is less efficient when compared to the where operator. Despite its inefficiency, the search operator is useful when you are unsure of which table or column to filter for granular search.
Examples
Searching Across Multiple Tables
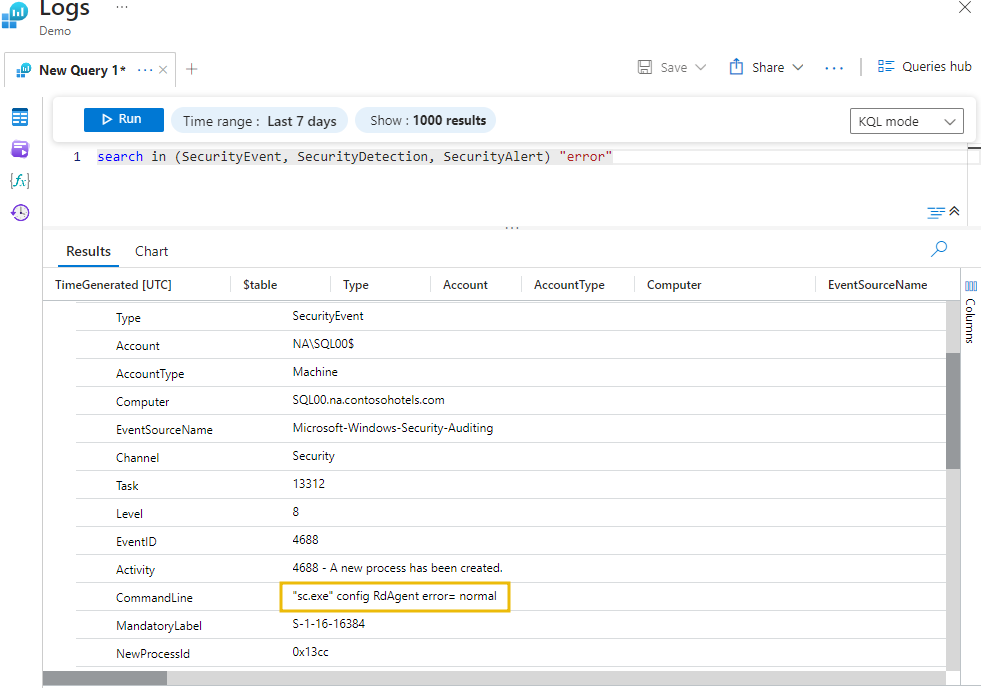
The below query will search for the word "error" within the SecurityEvent , SecurityDetection , and SecurityAlert tables for the last 7 days.
search in (SecurityEvent, SecurityDetection, SecurityAlert) "error"
Searching Across All the Logs
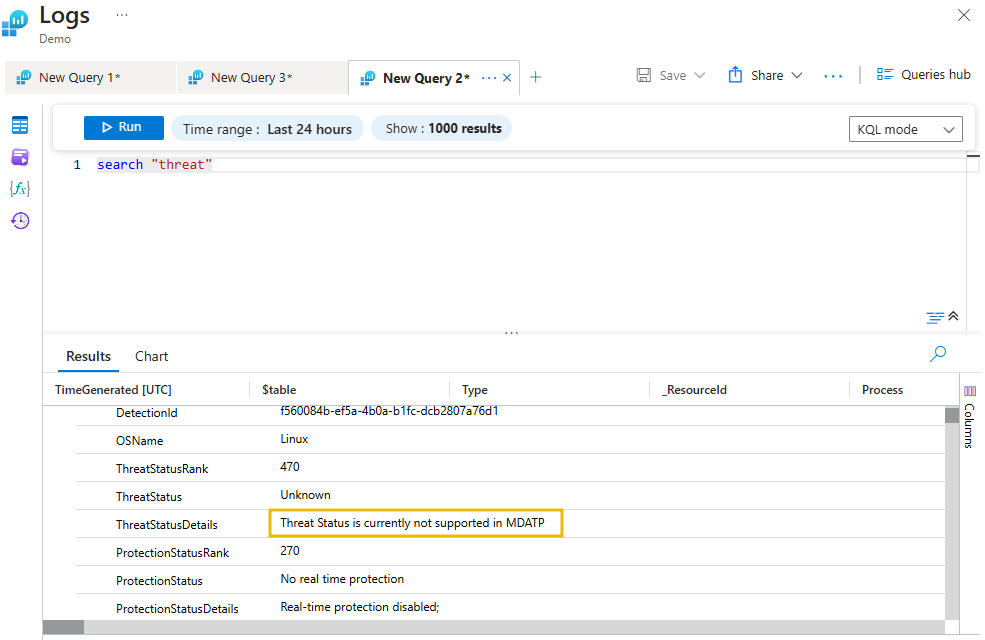
The query below will search for "threat" across all tables. This could be used to search across all tables for malicious activities. Click the drop-down from any of the entries to see more details.
search "threat"
Searching for a Specific Item From a Particular Table
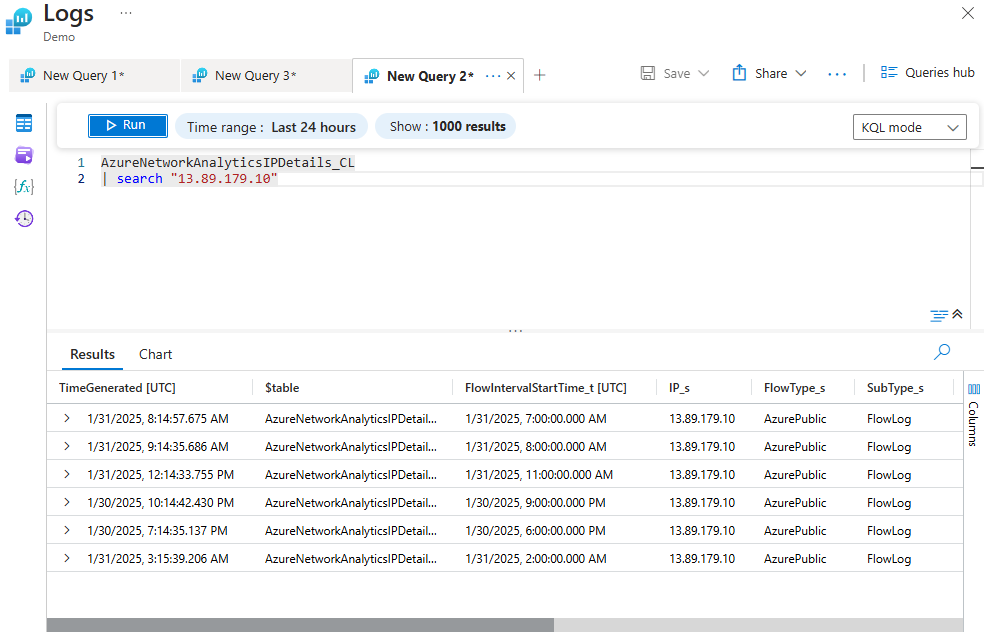
The below query will search for every event relating to the address "13.89.179.10" in the AzureNetworkAnalyticsIPDetails_CL table.
AzureNetworkAnalyticsIPDetails_CL
| search "13.89.179.10"
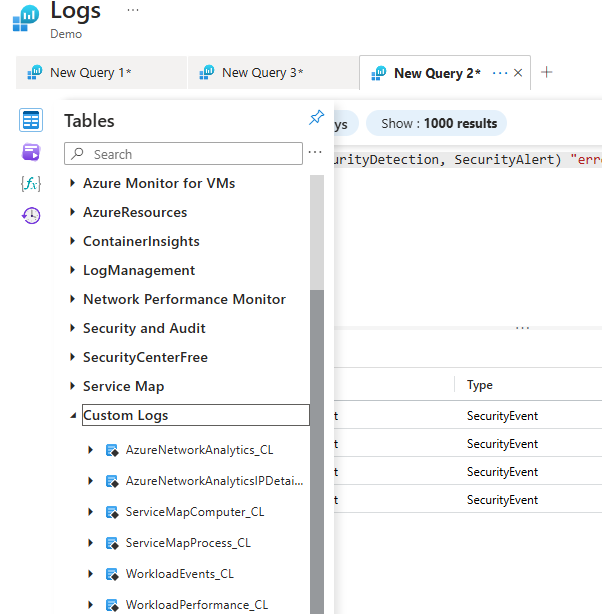
Note: CL means Custom Log; it implies any imported table. It also differentiates the built-in tables from the custom tables because most logs have the same table names.
What operator can you use if you're unsure which table or column to filter?
What suffix do custom logs have?
Let Statement
The let statement is a utility query used to declare variables based on expressions or functions. It can be used for further analysis since the variables can be reused. It enables you to break up a complex expression into multiple parts. By using the let statement, security administrators can create a temporary variable within a query to store the output of an expression.
let VariableName = Expression;
- let: The keyword indicating the start of the let statement.
- VariableName: Name of the variable defined.
- Expression: The expression used to define the variable’s value.
Examples
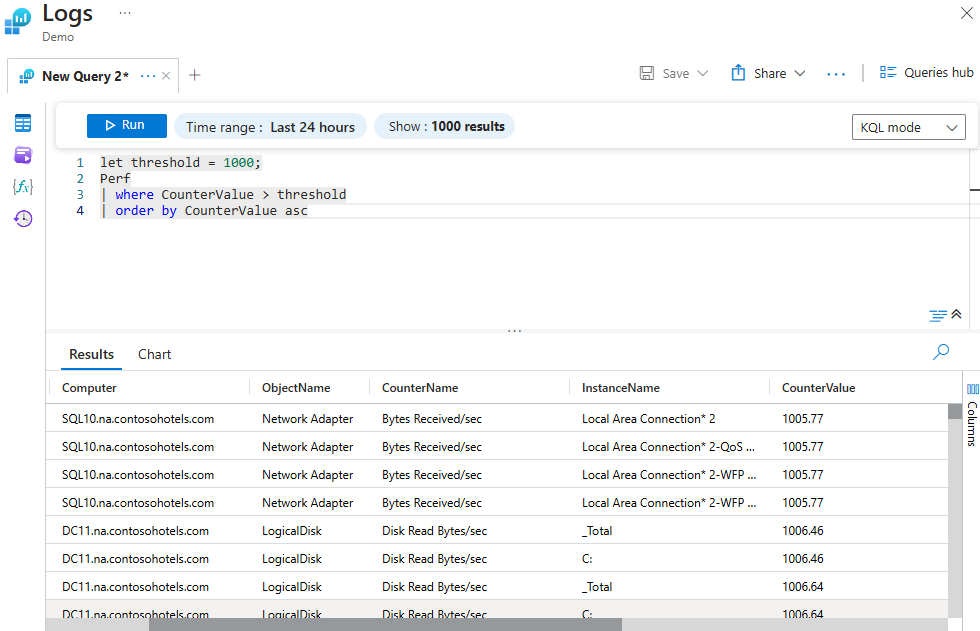
Defining a Threshold
The below query sets a threshold value of 1000. It then selects the performance table where the CounterValue is greater than this threshold and returns the result in ascending order.
let threshold = 1000;
Perf
| where CounterValue > threshold
| order by CounterValue asc
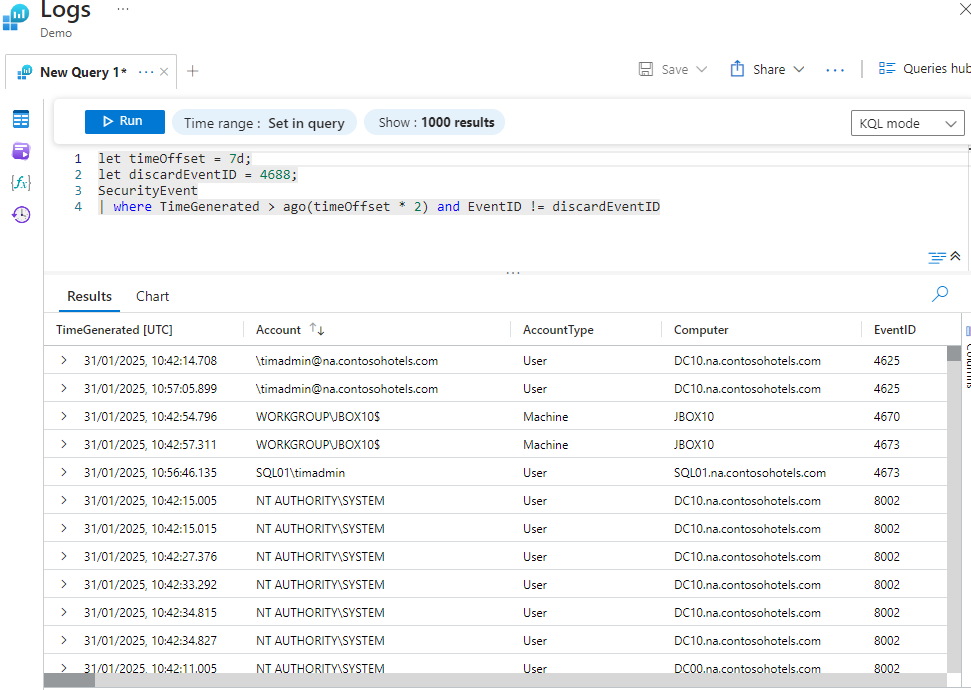
Declaring Multiple Variables
Here, we query the SecurityEvent table based on the time offset in this example, finding the security events for the past 14 days and exempting event ID 4688.
let timeOffset = 7d;
let discardEventID = 4688;
SecurityEvent
| where TimeGenerated > ago(timeOffset * 2) and EventID != discardEventID
Declaring a Variable With Dynamic Values
This example query creates a dynamic array called EventIDs containing specific event IDs 4624 and 4625. It then filters the SecurityEvent table only to include those with an Event ID that matches one of the values in the EventIDs array and sorts the output by the time generated.
let eventIDs = dynamic([4624, 4625]);
SecurityEvent
| where EventID in (eventIDs)
| sort by TimeGenerated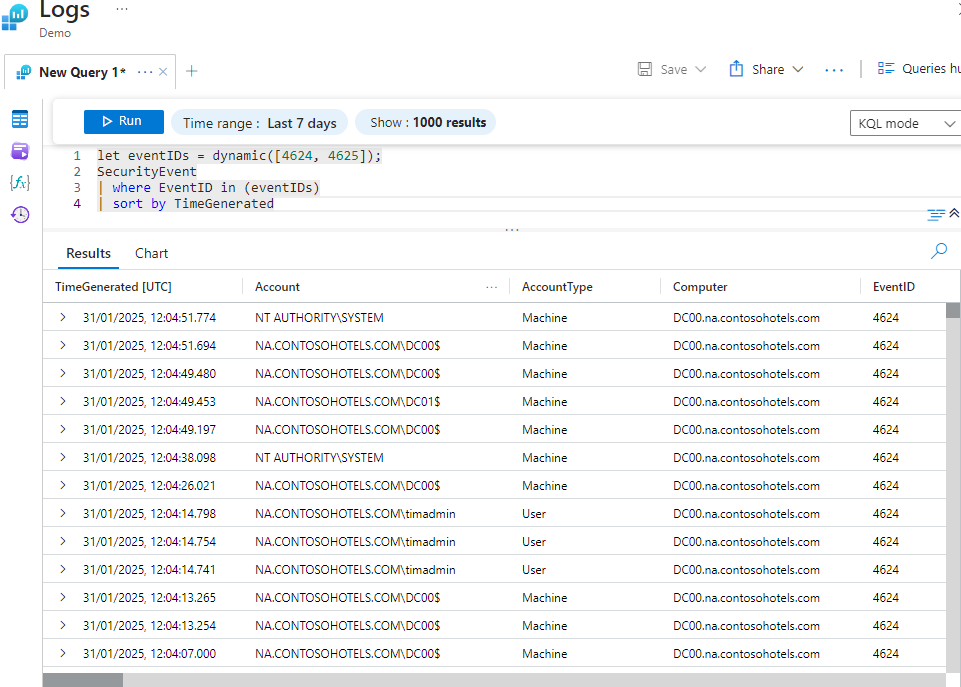
Which operator can you use to declare variables?
Time functions are crucial for digging through security logs to focus on a specific time range. As a security analyst, these functions allow you to perform time-based queries. Time functions are typically used in combination with other operators to filter, summarize, and manipulate logs based on time.
provides various time functions that can be very useful when creating custom analytics rules or during investigations.
Here are some commonly used time functions:
now(): This function returns the current UTC date and time when the query is executed.ago(): This function is used to specify a time frame relative to the current time.startofday(): This function returns the start of the day (00:00:00) for a given timestamp. For instance,startofday(ago(1d))returns the start of the day one day ago.endofday(): This function is similar tostartofday(), but it returns the end of the day (just before midnight) for the specified datetime value.datetime(): This function is used to represent a point in time, typically expressed as a date and time of day. For instance,datetime(2020-12-31 23:59:59)represents the specified date and time.startofmonth(): This function returns the start of the month (00:00:00) for a given timestamp. For example,startofmonth(datetime("2023-11-15T12:00:00"))returns the start of the month for November 2023.
Examples
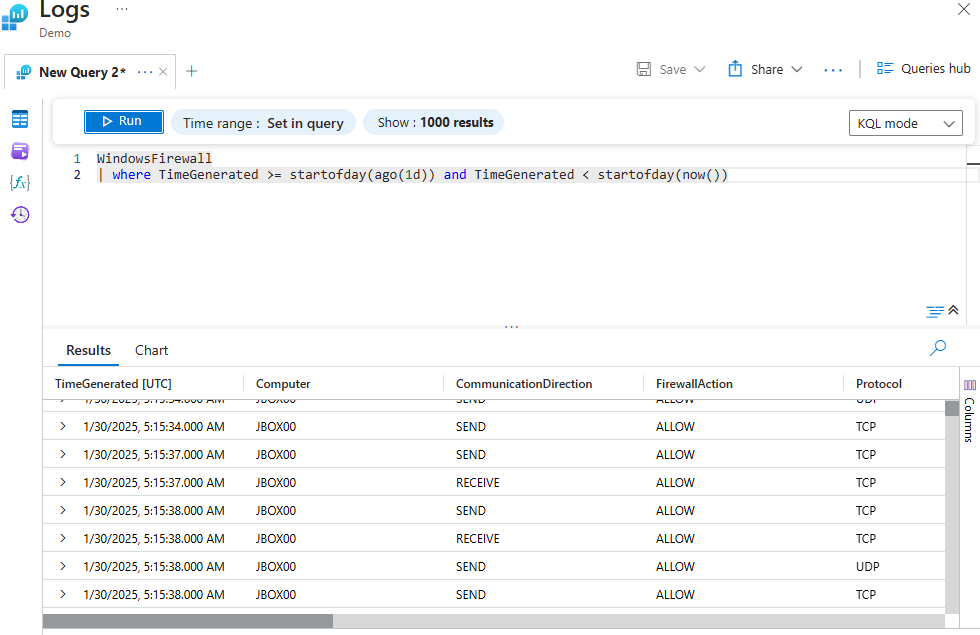
Using Time Functions To Determine the Start Time
The below query filters the WindowsFirewall table to return only the records generated within the last 24 hours, but only up to the start of the current day. Essentially, it retrieves firewall events that occurred during the previous day.
WindowsFirewall
| where TimeGenerated >= startofday(ago(1d)) and TimeGenerated < startofday(now())
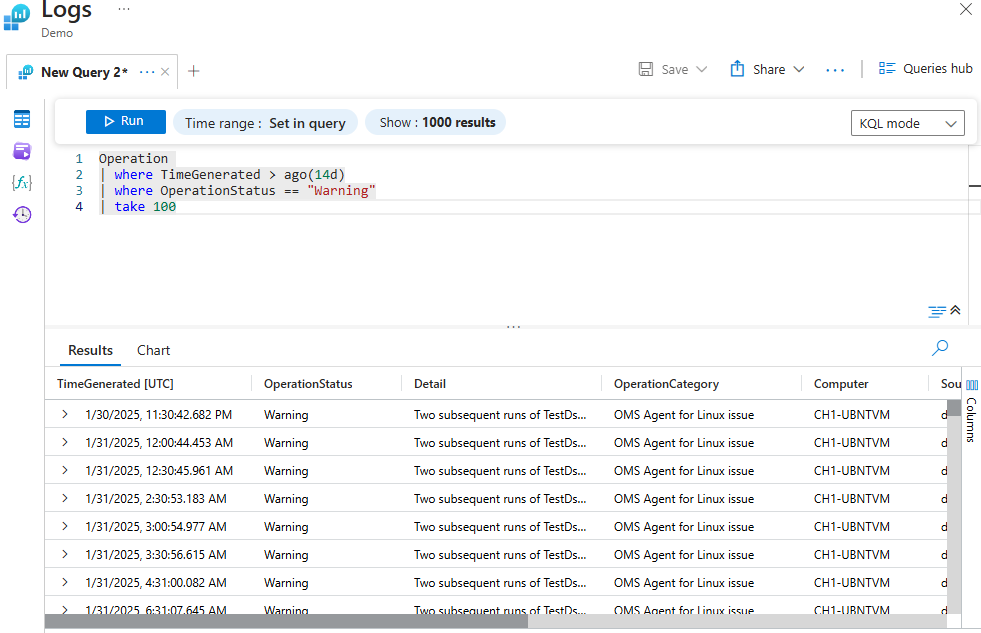
Determining the Time Range Within a Query
The query below retrieves up to 100 records from the Operation table, where the operation status is "Warning" within the last 14 days.
Operation
| where TimeGenerated > ago(14d)
| where OperationStatus == "Warning"
| take 100
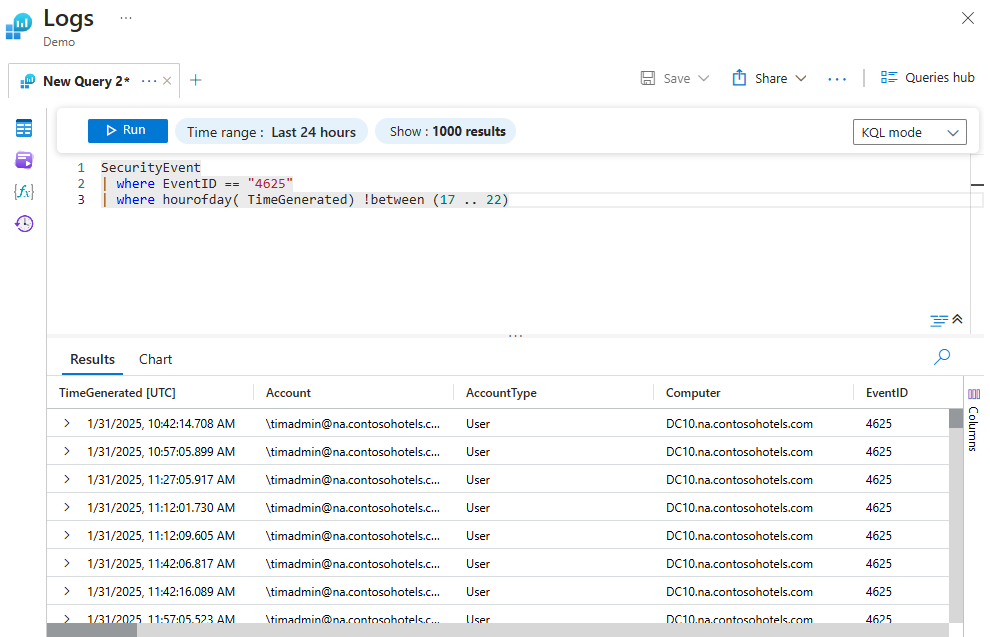
Defining a Specific Time Range Within a Query
This query fetches security events with the ID "4625", which identifies an account with a failed log-on that occurred outside the hours 17:00 to 22:00 in the past 24 hours.
SecurityEvent
| where EventID == "4625"
| where hourofday( TimeGenerated) !between (17 .. 22)
Take your time. Run these queries independently using the Demo Analytics Workspace (opens in new tab). Please feel free to switch things up however you like. It helps!
Note: To answer the questions, adjust to a custom starting time frame of January 30, 2025.
On the "Defining a Specific Time Range Within a Query" query, what event ID are we looking for?
Which time function returns the current UTC date and time when the query is executed?
Summarize Operator
The summarize operator is used to aggregate security logs. As its name implies, it helps security analysts determine how the results are shown when identifying patterns, trends, and anomalies, which in turn helps generate actionable insights. The summarize operator organizes rows with similar values in the columns specified and calculates the aggregate for each of those columns.
The summarize operator is often combined with filter, sort, or visualization functions to provide meaningful insight into security events, alerts, telemetry data, and more.
Examples
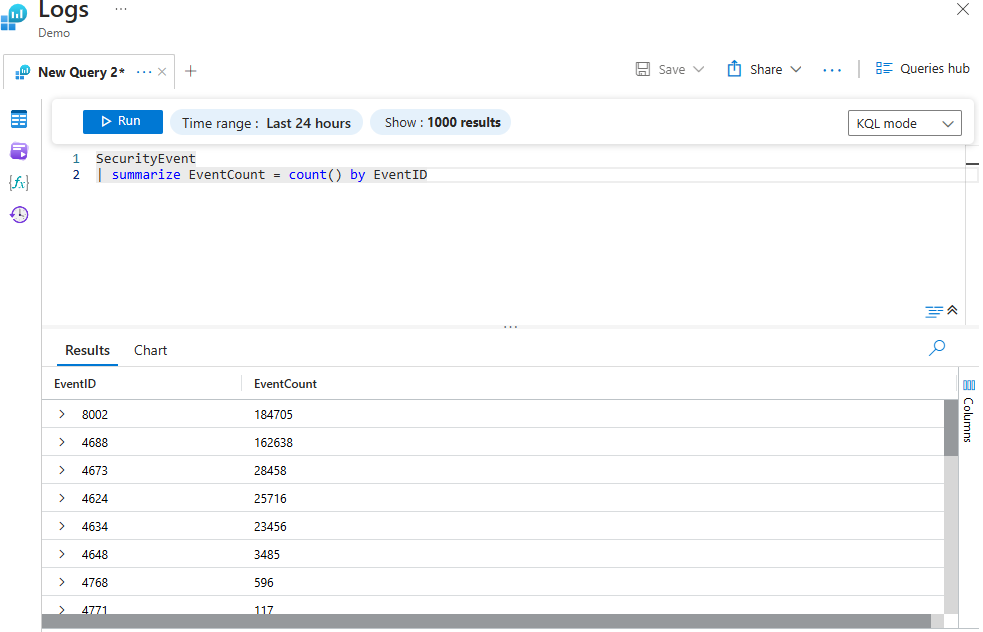
Using Summarize To Output the Count of EventID
The query below counts the number of security events by their respective EventIDs.
SecurityEvent
| summarize EventCount = count() by EventID
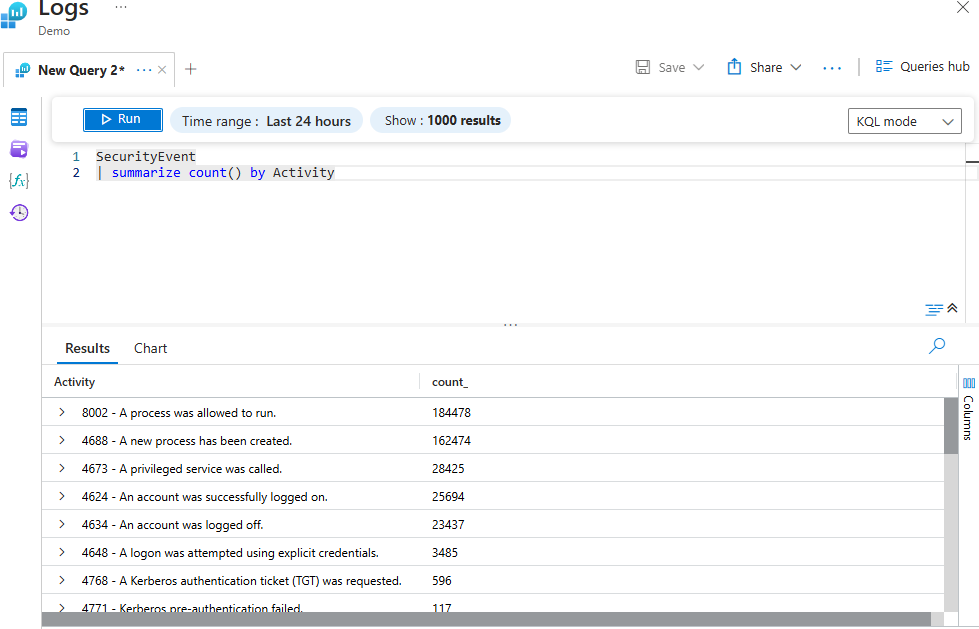
Using Summarize To Output the Count of Different Activities
The query below calculates the count of different security activities and groups them by their activity type.
SecurityEvent
| summarize count() by Activity
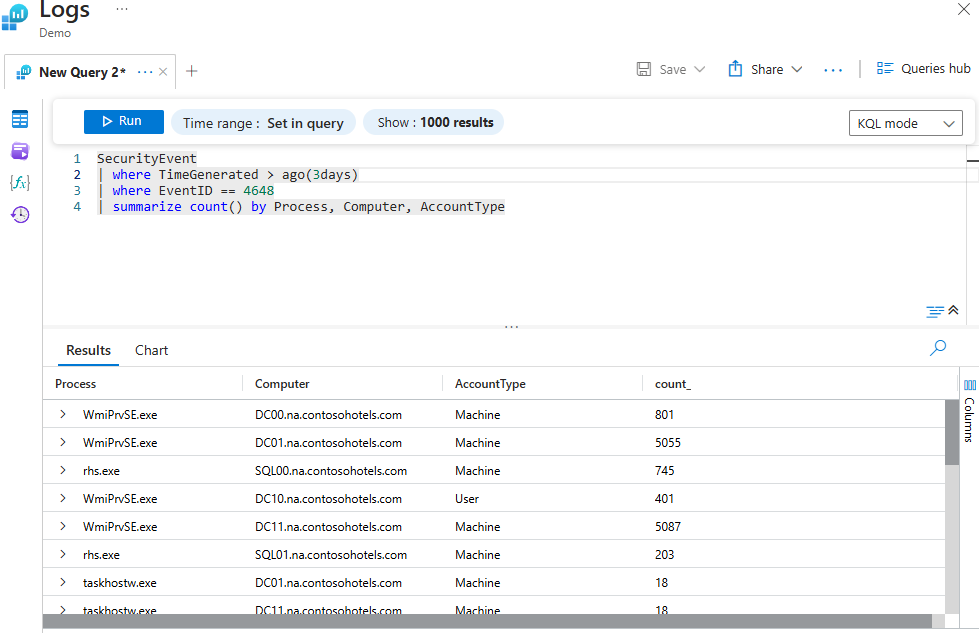
Using Summarize To Output the Count of Different Columns
This query searches the security event table for the past three days, where the event with ID 4648 occurred: "A login was attempted using explicit credentials." It returns the count, Process, Computer, and Account type.
SecurityEvent
| where TimeGenerated > ago(3days)
| where EventID == 4648
| summarize count() by Process, Computer, AccountType
Render Operator
The render operator is mainly used to visualize query results. It doesn't alter the output but instead creates a visual representation of the result within the query output.
A few important things to keep in mind about the render operator are:
- It must be the last operator in your KQL query.
- The query results should be in a single tabular data stream format.
- Supports various chart types:
- Bar chart
- Column chart
- Pie chart
- Area chart
- Scatter chart
- Time chart
Examples
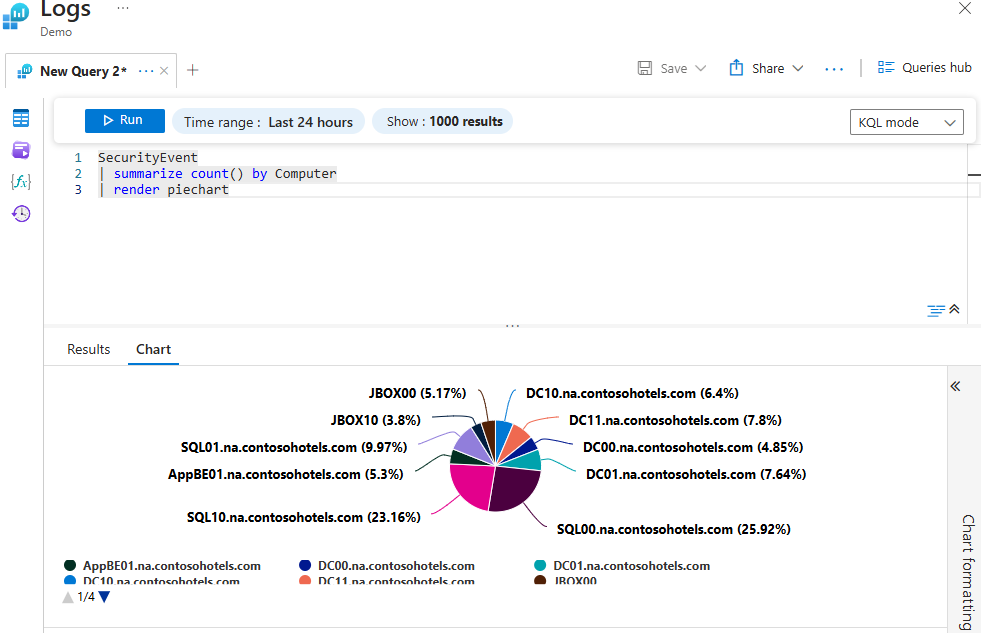
Using Render To Return a Query Result in a Pie Chart
The query uses the summarize operator to count the number of security events logged by the computer using the SecurityEvent table and the render operator to visualize the query results as a pie chart.
SecurityEvent
| summarize count() by Computer
| render piechart
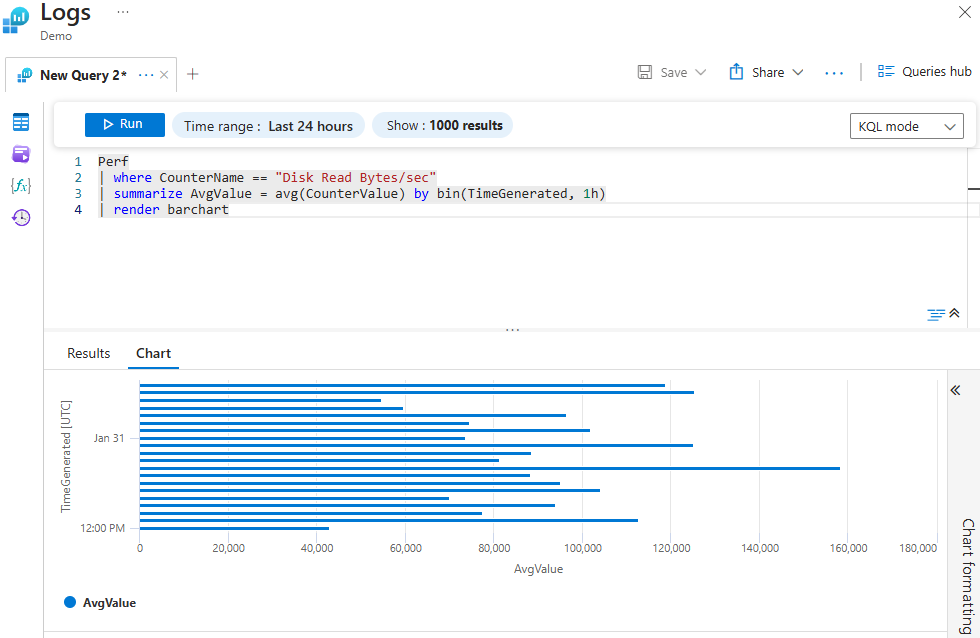
Using Render To Return a Query Result in a Bar Chart
This query uses a bar chart to visualize the average disk read bytes per second, aggregated by 1 hour.
Perf
| where CounterName == "Disk Read Bytes/sec"
| summarize AvgValue = avg(CounterValue) by bin(TimeGenerated, 1h)
| render barchart
Does the render operator have to be the last operator in your KQL query? (Yea/Nay)
On the "Using Summarize To Output the Count of Different Columns" query, which columns are summarized?
Kindly follow the instructions below to access your labs on the next tasks.
On your lab task (Lab-01: Task 9), click the Cloud Details button.
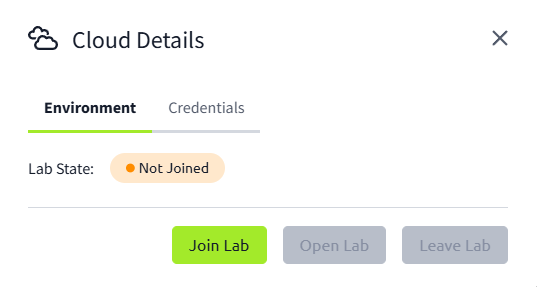
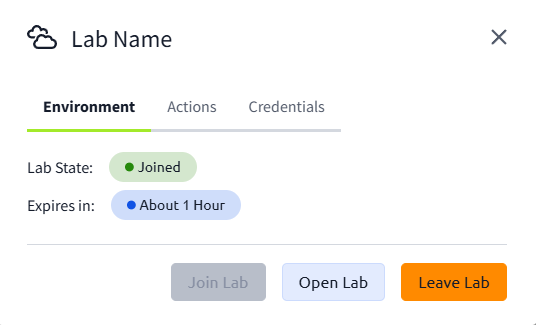
On the Environment tab, click the Join Lab button to deploy your lab environment.
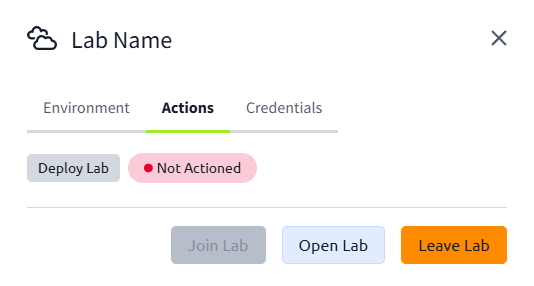
On the Actions tab click the Deploy Lab button to provision all lab resources required.
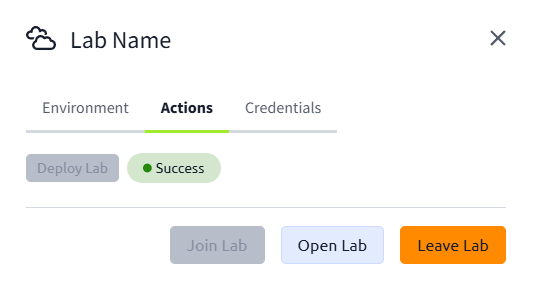
Click the Open Lab button to launch a new tab. This will direct you to the Microsoft Azure portal.
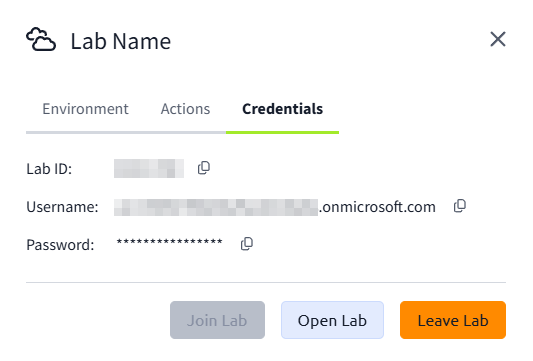
Select the Credentials tab to view your login credentials required to access the Microsoft Azure portal.
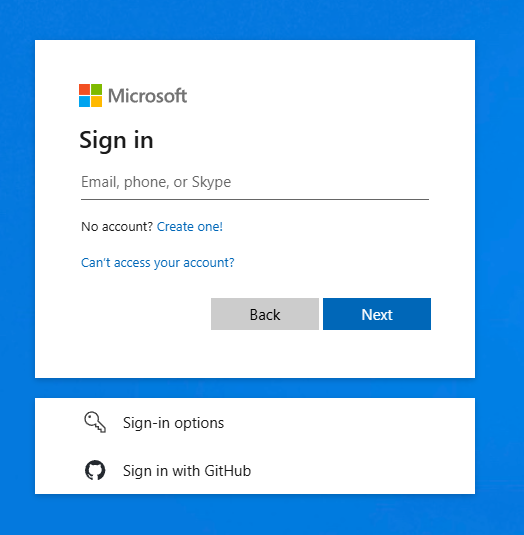
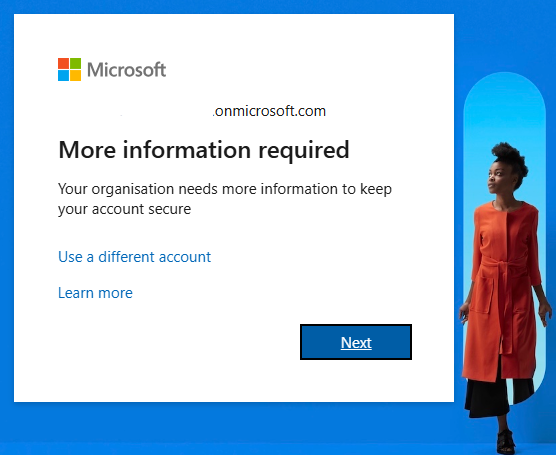
Sign in using your Username and Password from the Credential tab. Then click Next to continue.
With the new Microsoft multifactor authentication enforcement, you will be required to set up to sign in to the Microsoft Azure portal. Click Next to configure using your preferred method.
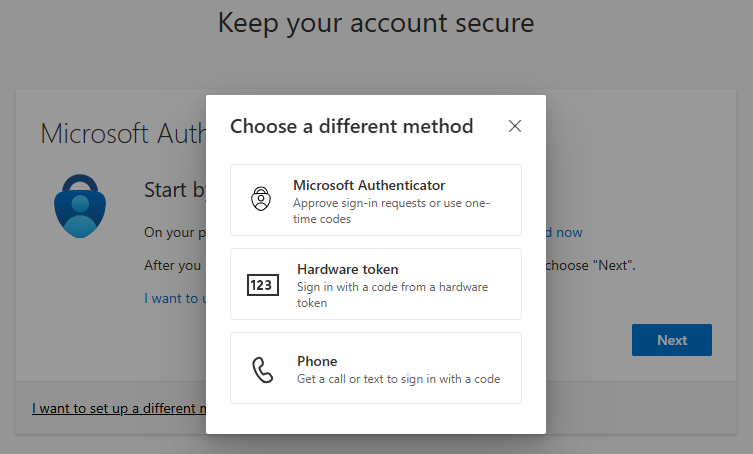
By clicking on I want to set up a different method you can see all available options.
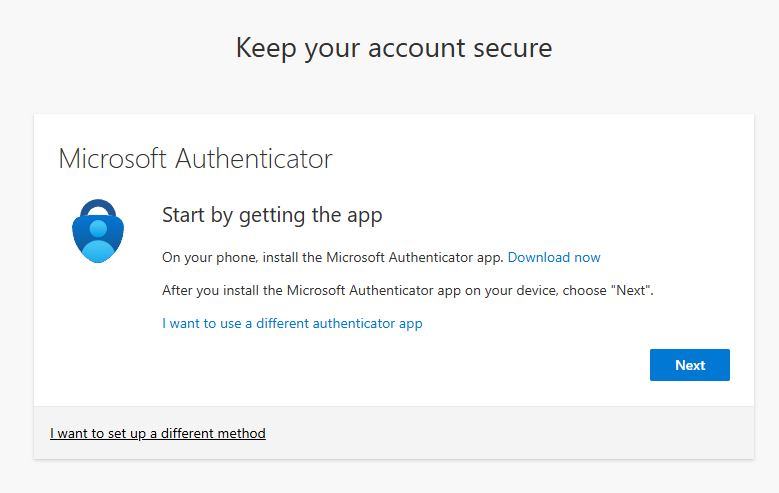
The default authentication method is to use the free Microsoft Authenticator app. If it is installed on your mobile device, select Next and follow the prompts to add this account. If you don't have it installed, a link is provided to download it.
Complete the authentication process to sign in to the Microsoft Azure portal.
Note: Lab access will expire after 1 hour.
Context: Your security team received an alert stating an unauthorized access attempts from an account named "timadmin". The team suspects that the user account may have been compromised and wants to conduct further investigation to ascertain the extent of the breach and identify any additional suspicious activity.
Role: You are logged in as:
Lab scenario: Your initial assignment is to investigate any suspicious activity.
- First, identify the user account
- Then, review authentication events
- Finally, recommend remediations
First, leave the lab we started in Task 3 by pressing the Leave Lab button on the Cloud Details pop-up from Task 3. Then, access your new lab by clicking the Cloud Details button below in conjunction with the lab instructions from Task 8. Lab deployment may take about 4 minutes. You can check the deployment status via Resource groups -> Select the available resource group -> Settings -> Deployments.
Please make sure to have performed these actions on the Cloud Details pop-up:
| Environment Tab | Click Join Lab |
| Actions Tab | Click Deploy Lab |
Step 1: Run a KQL Query to Search for Security Events Related to the User Account
Walkthrough (Click to see)
- Log in to the Azure portal (opens in new tab)using your lab credentials (make sure you first logged out of any previous lab account).
- Search for Log Analytics workspaces in the top search bar.
- Select the available Log Analytics workspace.
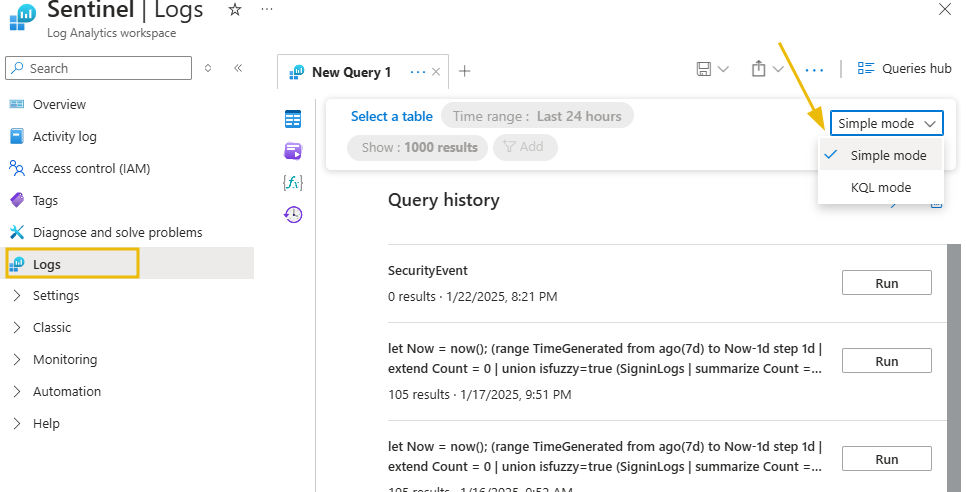
- Click on Logs on the left side menu.
- Close the pop-up box to see the query editor.
- If it is available to you, change the mode to KQL on the far right. Otherwise, you can skip this step.
- Type in the following query.
SecurityEvent_CL
| where Account_s contains_cs "timadmin"
- Review the output to see all events by the "timadmin" account. Scroll to the Activity_s column and review the different activities on the account for suspicious events.
Step 2: Examine the User Account’s Authentication Events to Pinpoint Any Suspicious Login Attempts
Walkthrough (Click to see)
Continue with the queries.
- In the query editor, run the following query to see only the authenticator events.
SecurityEvent_CL
| where Account_s contains_cs "timadmin"
| where Activity_s contains "logged on" or Activity_s contains_cs "logged off"- Click the Time range tab to add a custom time frame for broader coverage.
- Click on the expandable icon on any event to see more details about it.
- Additionally, run the query with the summarize and order by operator to see the log-on and log-off counts by machine, helping to identify which machine may have been compromised.
SecurityEvent_CL
| where Account_s contains_cs "timadmin"
| where Activity_s contains_cs "logged on" or Activity_s contains_cs "logged off"
| summarize count() by Computer
| order by Computer
Finally, you can generate an incident report based on your findings and recommend remediation based on the investigation.
In this case, you can verify if the machines are the ones Tim should have access to. Also, if the event activities correlate with Tim's daily tasks.
Recommendations
- Requesting Tim to reset his admin credentials and ensure a complex password is used.
- Review Tim's access to critical workloads.
- Scan the workloads for malware.
- If in doubt, Tim's account should be disabled to ensure no access to critical workloads.
What is the count of log on and log off events for DC10 by timadmin in the last 7 days?
What is the authentication package name for timadmin's successful login?
Summary
After completing this room, you should understand better how to use basic queries to filter through large amounts of security logs for better insights. Now, you should be able to:
- Know the key difference between and
- Understand how to use the Where, Sort, Summarize and Render operators
- Understand how to use the Search operator to find specific terms
- Understand how to use Time functions for wider coverage
- Understand how to use the Let statement when there is a need to declare variables
Understanding these operators is essential for effectively querying and analyzing the logs ingested into the Log Analytics workspace. In the next room, we will continue with more queries. Join me!
Let's check out the KQL (Kusto): Advanced Queries room.
Ready to learn Cyber Security?
TryHackMe provides free online cyber security training to secure jobs & upskill through a fun, interactive learning environment.
Already have an account? Log in