Monitoring Active Directory
Learn to monitor Active Directory and find anomalies in high-volume logs.
medium

To access material, start machines and answer questions login.
Every ransomware incident, every data breach, every domain compromise has one thing in common: interaction with Active Directory. is the identity backbone of most enterprise networks, making it a primary target for attackers.
generates thousands of events per hour, including authentication requests, group changes, service tickets, and failed logins. Most of this activity is completely normal. So how do we find the malicious activity buried in all that noise?
This room answers that question by teaching us to monitor from a defender's perspective. We'll learn what traffic looks like, what events get logged, how to configure logging for visibility, and how to find anomalies hiding in massive datasets.
Learning Objectives
By the end of this room, we'll be able to:
- Identify the protocols that generate traffic and differentiate between domain and local user authentication
- Interpret core Event across authentication, account lifecycle, groups, and directory services
- Establish baseline activity patterns and spot anomalies using stack counting
- Configure audit policies to capture critical events
- Query logs in to investigate user activity
Prerequisites
This room assumes foundational knowledge in:
- Active Directory Basics: Core concepts like domains, users, groups, OUs, and how / authentication works (Active Directory Basics room)
- Windows Event Logs: Event like 4624, 4625, and how to read Security logs (Windows Event Logs room)
- Querying: How to write search queries in (: Exploring room)
Machine Access
Start the machine by clicking the Start Machine button below. Give the instance about 4-5 minutes to launch, then access it here:
Set up your virtual environment

Read the above and click Check.
In May 2024, Black Basta ransomware operators attacked Ascension Healthcare (opens in new tab), exposing 5.6 million patient records. The attackers exploited weak service account passwords using Kerberoasting (opens in new tab) to gain privileged domain credentials.
Black Basta has compromised over 500 organizations globally (opens in new tab) by moving from initial access to network-wide deployment in hours (opens in new tab). These incidents show why monitoring isn't optional for security teams.
Before we look at any logs, we need to understand what generates those logs. relies on several protocols for authentication and resource access. Each protocol serves a specific purpose, and understanding them helps us interpret what we see in the logs later.
Protocol Summary
| Protocol | Ports | What It Does | Normal Usage |
|---|---|---|---|
| 88 | Default authentication in | User logins, service access, ticket requests | |
| 389, 636, 3268, 3269 | Directory queries and modifications | User lookups, group membership checks, and address book queries | |
| 445 (139 for legacy sessions) | File sharing, remote administration | Accessing shared folders, printers, and administrative tools | |
| 3389 | Interactive remote desktop | Help desk support, server administration | |
| Name Resolution (Legacy) | 137, 138, 5355 | (/ - 137/138) and (5355) | Fallback when fails, for older applications |
You don't need to memorize all of these right now. The important thing is that activity flows through these protocols, and each one generates log entries that we'll examine in later tasks.
Read the above and click Check.
Whenever a user needs access to domain resources, they must authenticate. The same applies to attackers. These authentication events tell us:
- Who requested access,
- When,
- From where,
- And whether they succeeded.
In this room, we focus on domain authentication using two protocols: modern and legacy .
Domain Users vs Local Users
But before we dive into authentication events, there's an important distinction that impacts where we'll find authentication logs: not all accounts are domain accounts.
- Domain users authenticate against the Domain Controller. Their credentials are stored in the database (
NTDS.dit). When they log in, the DC is involved, so events appear on the DC. - Local users authenticate against the local Security Account Manager (
SAM) database on each machine. The isn't involved, so events only appear on that specific machine.
| User Type | Credentials Stored | Where Authentication Events Appear |
|---|---|---|
| Domain user | NTDS.dit (on ) | Domain Controller |
| Local user | SAM (on local machine) | Local machine only |
Why Does This Matter for Monitoring?
When a domain user (like luke.sullivan) logs into multiple workstations, and all authentication events appear on the Domain Controller. This gives us a centralized view of their activity across the entire domain.
When a local administrator (such as Administrator) logs in to a single workstation, those events appear only in that workstation's Security log. If we're investigating cross-system activity (or lateral movement), DC logs are where we'll find the complete picture.
Kerberos Authentication
Kerberos is a ticket-based authentication protocol used by Active Directory to verify user identity without sending passwords over the network.
When a user authenticates, they first request a Ticket Granting Ticket (TGT) from the Domain Controller. This TGT is then used to request service tickets (TGS) for specific resources. Each step generates a particular event:

| Step | What Happens | Event ID | Where Logged |
|---|---|---|---|
| 1 | User requests a TGT | 4768 | Domain Controller |
| 2 | User requests a TGS | 4769 | Domain Controller |
| 3 | User creates a session on the target | 4624 | Target server |
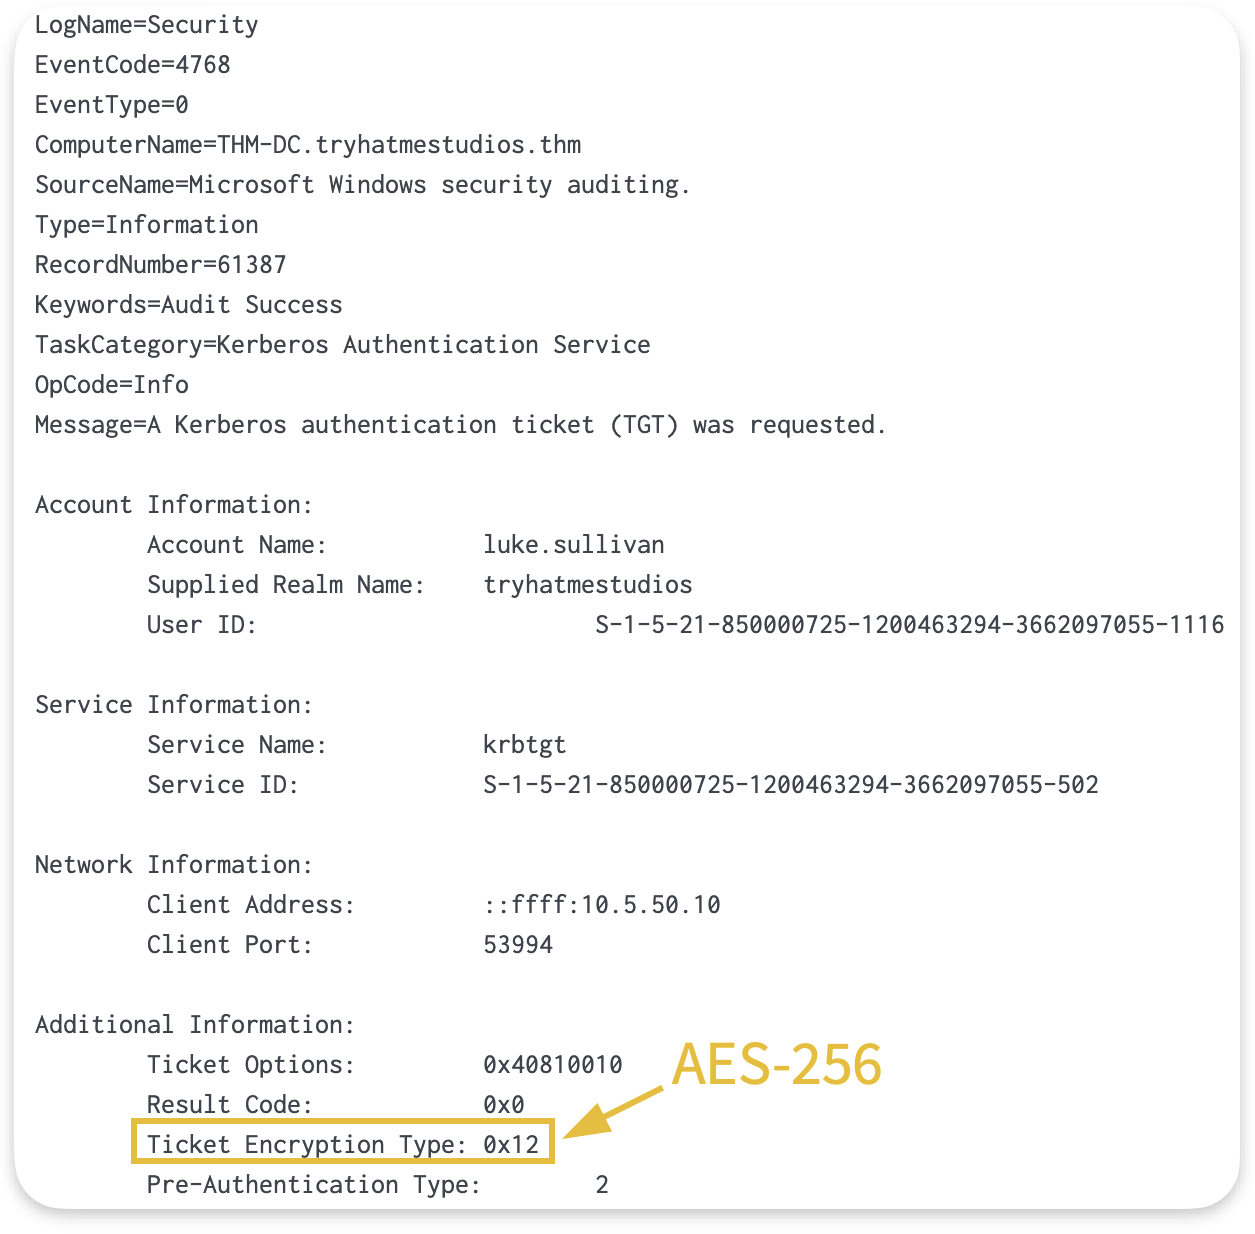
This is how it appears in logs:

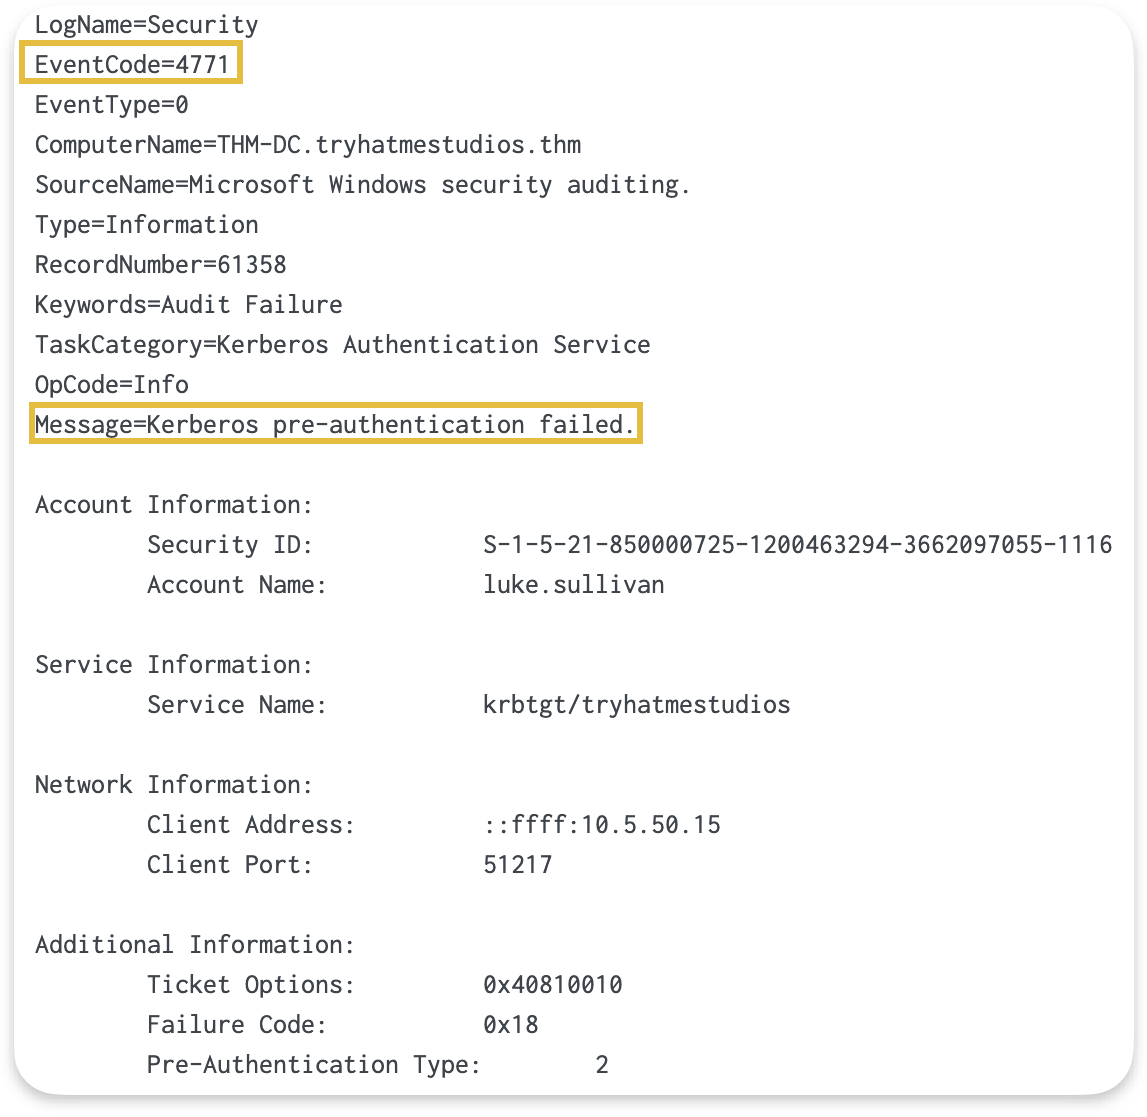
What if the user enters the wrong password or the authentication fails for any other reason?
The pre-authentication step fails, generating Event 4771 on the Domain Controller. We'll see 4771 events regularly in environments where users sometimes forget or mistype their passwords.
Encryption Types in 4768/4769
Tickets usually are encrypted, and AD uses two encryption types for this:
- RC4 encryption appears in environments with older systems or applications that don't support AES.
- And AES-256 encryption, which modern systems use.
Understanding what should usually appear in our environment helps us determine which encryption types to expect and where they come from.
| Value | Algorithm | When You See It |
|---|---|---|
| 0x12 | AES-256 | Modern systems, Windows 2008+ domain functional level |
| 0x17 | RC4-HMAC | Legacy systems, older applications, cross-forest trusts |
Let's say we want to filter for TGT requests in Splunk. We can use the following query:
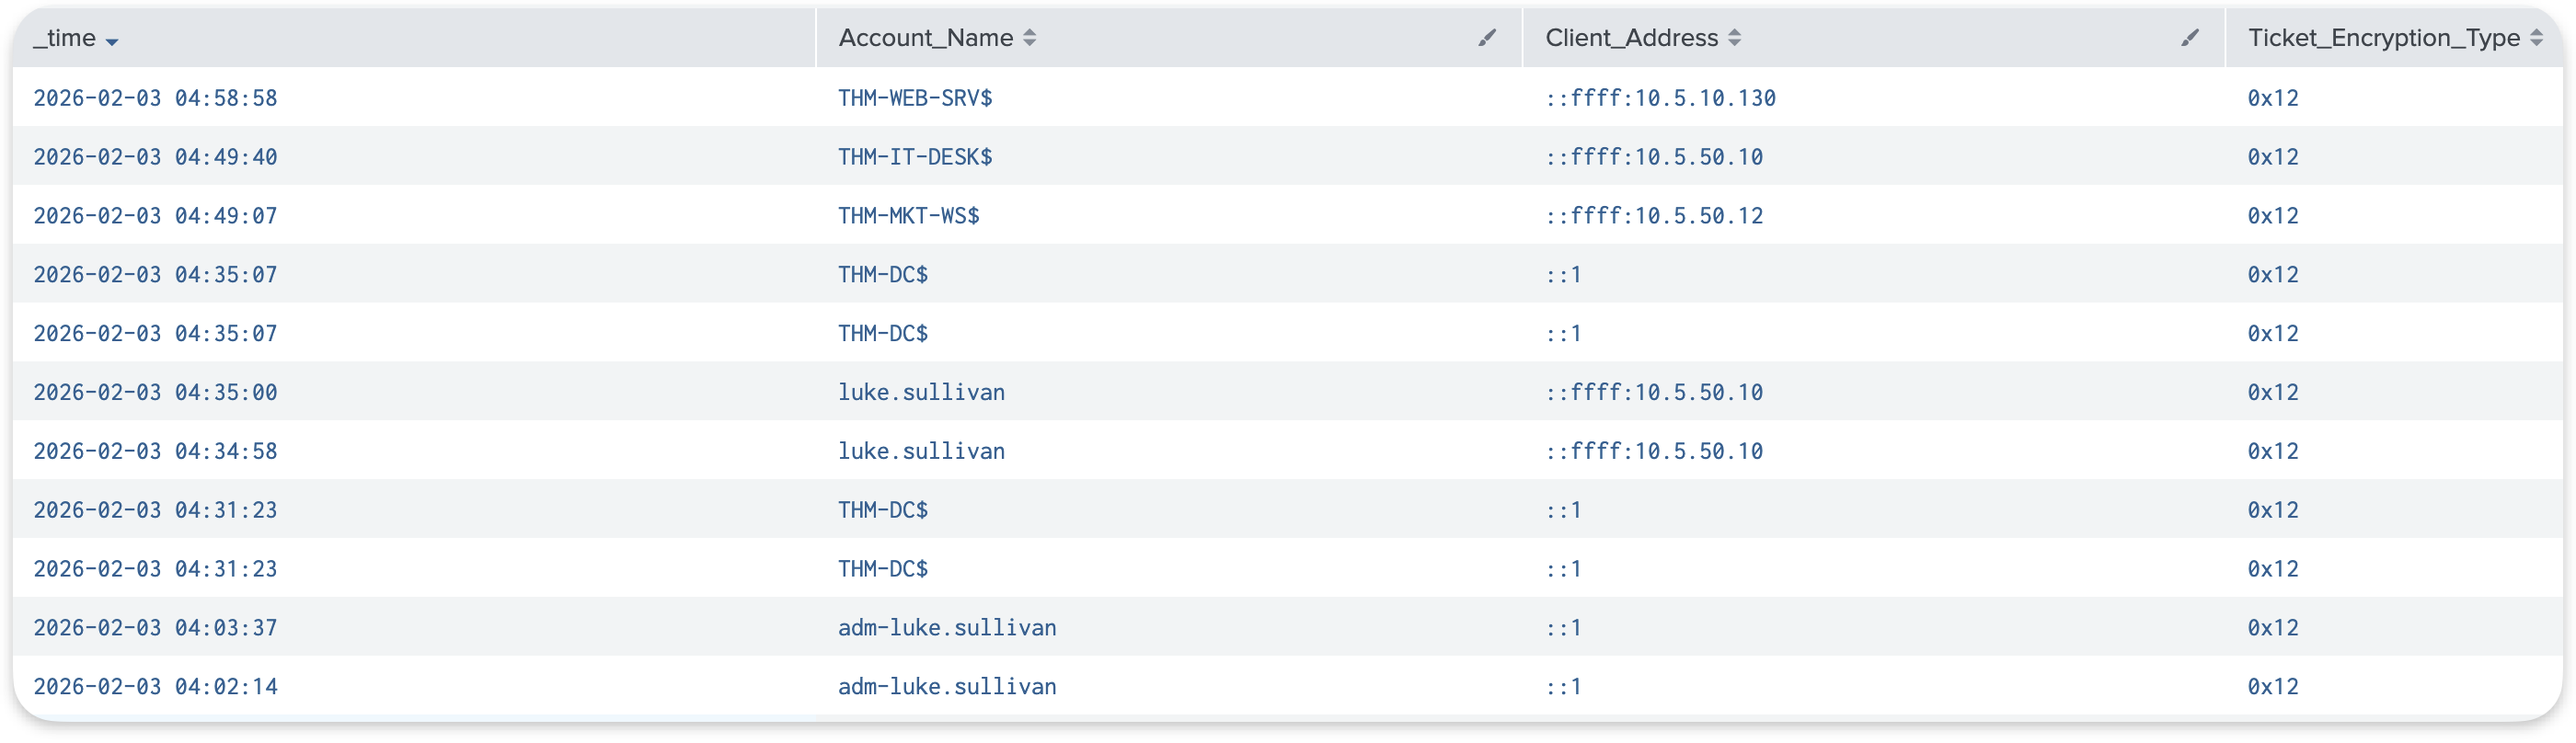
This shows us:
- Who tried to authenticate (
Account_Name), - When (
_time), - From which machine (
Client_Address), - And the encryption type for the ticket requested (
Ticket_Encryption_Type).
NTLM Authentication
NTLM is a legacy authentication protocol used when Kerberos is unavailable. This happens when accessing resources by IP address, when the target system cannot be found in DNS, or during authentication to non-domain systems.
| Step | What Happens | Event ID | Where Logged |
|---|---|---|---|
| 1 | The target server asks the DC to validate credentials | 4776 | Domain Controller |
| 2 | Session created on target | 4624 | Target server |

Event 4776 appears on the Domain Controller when NTLM credentials are validated. Common scenarios include:
- Accessing file shares by IP address (
\\10.0.1.50\Shared) - Legacy applications that don't support
- Authentication across untrusted domains
To view authentication attempts on the in Splunk:

This shows us:
- Which account was authenticated (
Logon_Account), - From which machine (
Source_Workstation).
Meanwhile, on the target host, it appears as follows:

authentication is less common than in modern environments. If we see high volumes of Event 4776, this may indicate misconfigured systems, legacy applications, or services accessing resources by IP instead of hostname.
Which file stores domain user credentials on the domain controller?
A local user authenticates to a workstation. Will this generate any events on the Domain Controller? (Answer Format: Yea or Nay)
What Event ID is generated when a user requests a TGT?
In win index in Splunk, how many unique accounts requested TGTs in the dataset across all time?
Authentication events tell us who connected. But what about changes to accounts and groups, or the resources users access once they are in? These events capture the administrative actions and resource access patterns that round out the monitoring picture.
Account Lifecycle Events
Every user account in Active Directory goes through a lifecycle:
- Account creation,
- Password resets,
- Occasional lockouts,
- And eventually, deactivation when someone leaves.
These routine administrative actions generate specific Event that create a baseline of normal activity.
| Event ID | What Happened |
|---|---|
| 4720 | Account created |
| 4722 | Account enabled |
| 4724 | Password reset attempted |
| 4725 | Account disabled |
| 4740 | Account locked out |
In a typical environment, account lifecycle events follow predictable patterns:
- When HR onboards a new employee, IT creates their account (4720) and enables it (4722).
- When the employee forgets their password, the help desk resets it (4724).
- When they eventually leave the company, IT deactivates the account (4725).
Let's take an example. To see what accounts were created in our environment, when, and by whom, we can use this query:

The The SAM_Account_Name field shows the account that was created, whileSubject_Account_Name shows which admin account created it.
If we see accounts being created by an unexpected admin account, suspicious names, or at unusual times, that's worth investigating.
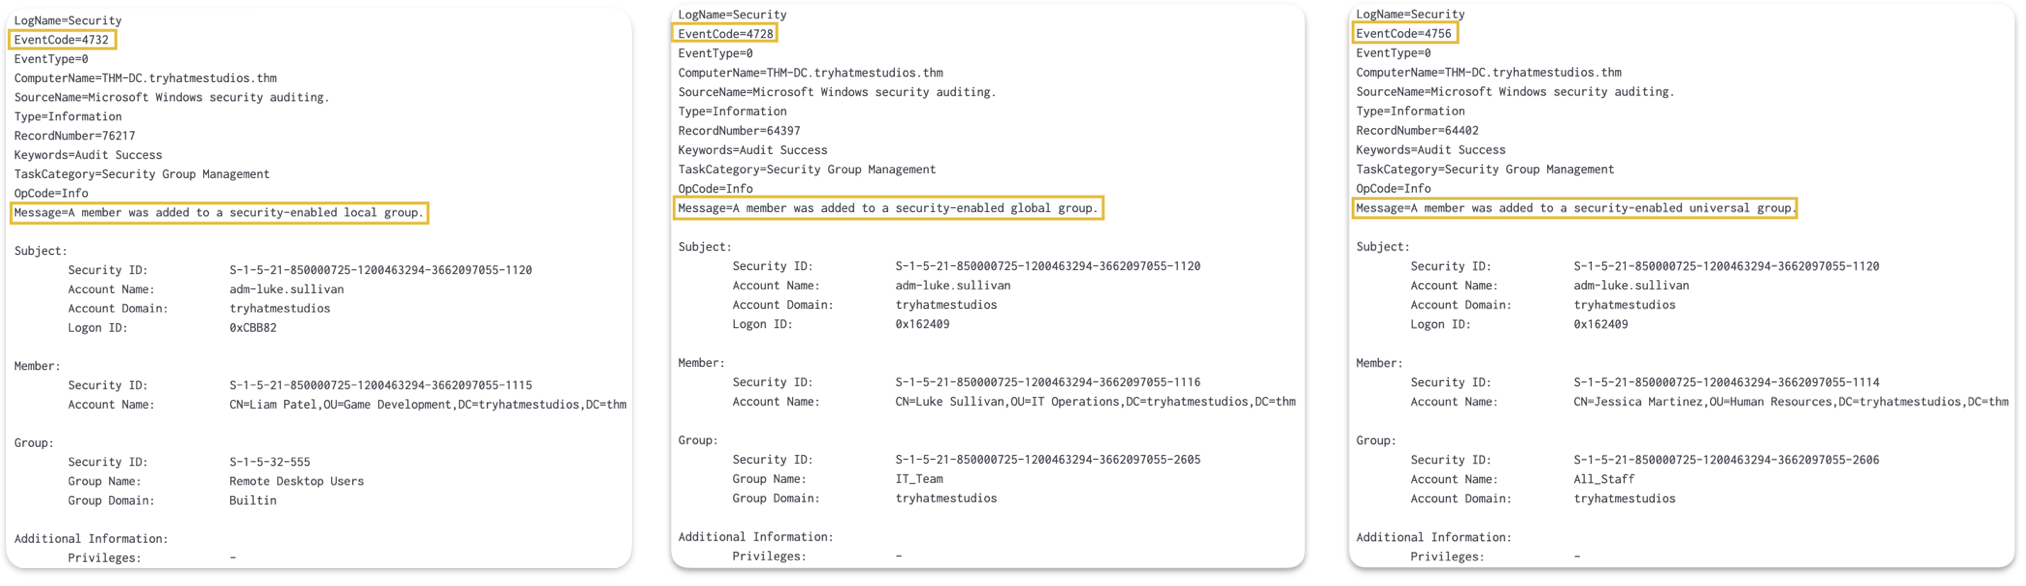
Group Membership Events
Adding someone to a privileged group is one of the fastest ways an attacker can escalate from an initial foothold to domain-wide control and establish persistence. Fortunately, Windows logs every security group membership change with dedicated Event IDs.
| Event ID | What Happened | Group Scope |
|---|---|---|
| 4728 | Member added to the global security group | Domain-wide |
| 4732 | Member added to local security group | Machine-level (domain local on DCs) |
| 4756 | Member added to universal security group | Entire forest |
Active Directory uses different group scopes (global, domain local, and universal) to organize users and control access. The naming can be confusing (e.g., global groups are actually scoped to a single domain, not globally). If you want to understand the architectural differences, Microsoft's official documentation on group scopes (opens in new tab) explains this in detail.
For monitoring purposes, what matters is that all three Event IDs indicate someone was added to a security group. Watch all of them, especially for privileged groups like Domain Admins, Enterprise Admins, and local Administrators.
On domain controllers, we can see these groups when right-clicking on a specific OU → New→ Group:

To see group membership changes for any of these groups, we can run the following Splunk query:

This shows us:
- Who was added (
Member_Account_Name), - Which group they were added to (
Group_Name), - And who made the change (
Subject_Account_Name).
Directory Service Events
Event 5136 logs attribute-level modifications to Active Directory objects. Unlike Event 4728, which only indicates that someone was added to a group, Event 5136 shows the specific LDAP attribute that changed and its new value.
These are the attributes we'll see most often:
userAccountControl- Account status changes (disabled, password never expires, etc.)servicePrincipalName- SPN modificationsscriptPath- Logon script path (scripts that run when users log in)member- Group membership modifications at the attribute leveldisplayName,description,title- User information fields
For example, when an IT administrator configures a logon script for a user, Event 5136 captures the exact path:
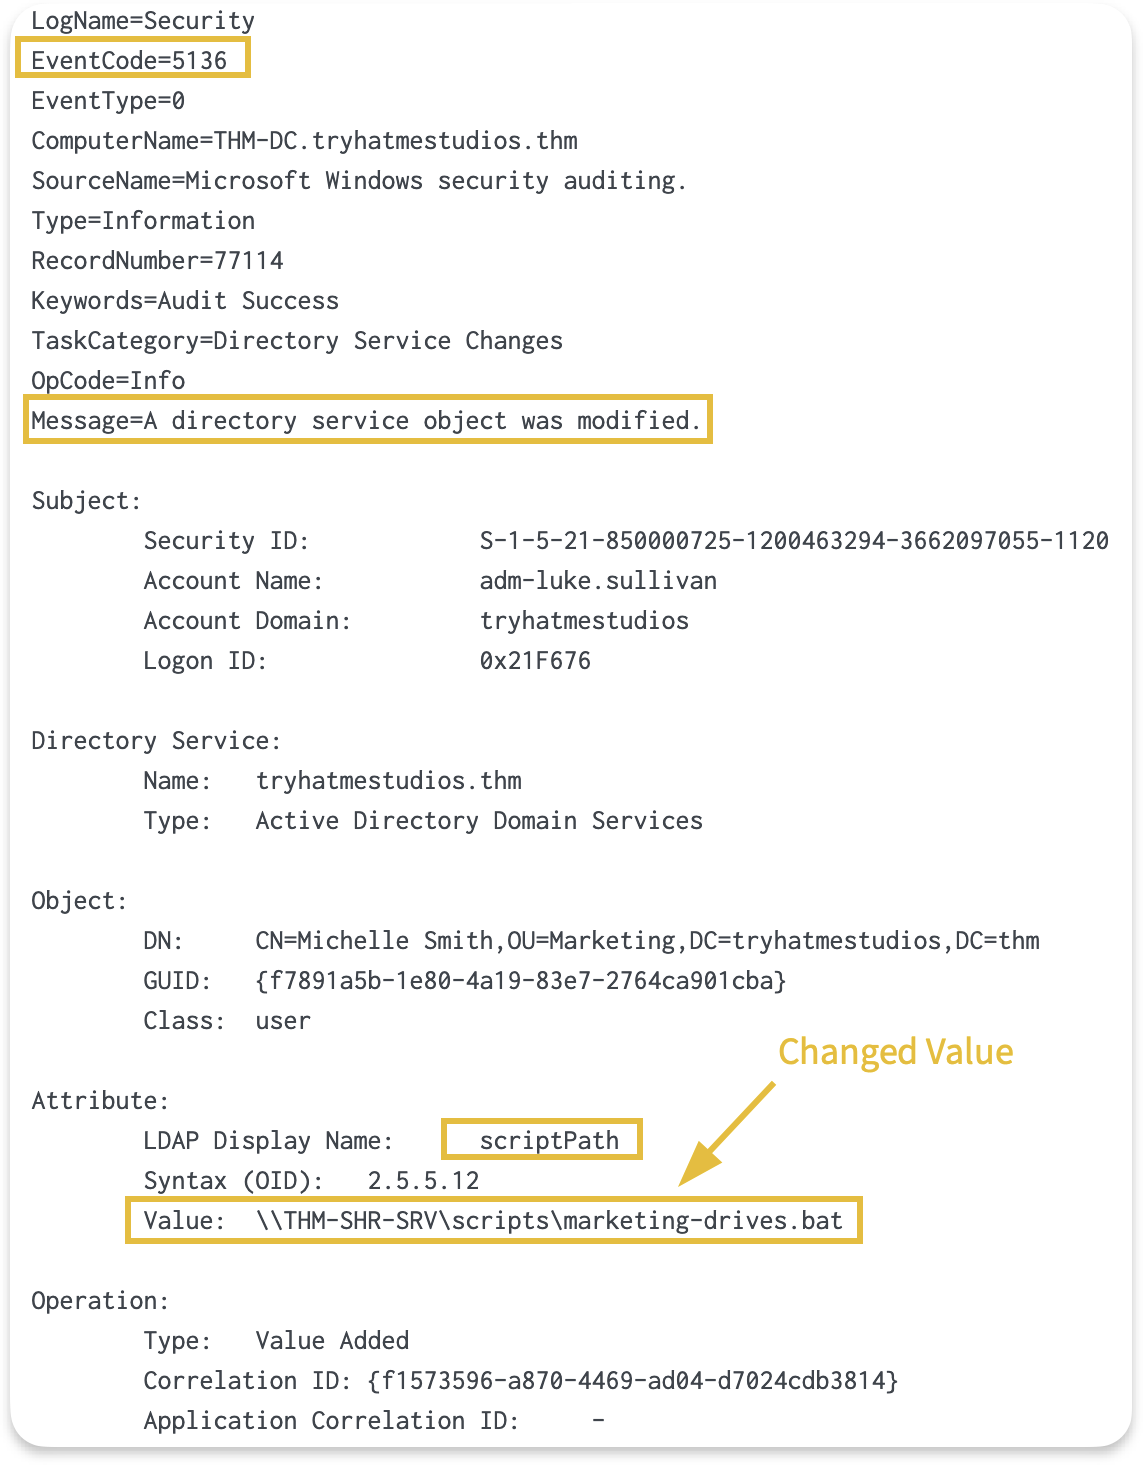
In this case, we can see that a logon script was configured for a user who made the change (Subject_Account_Name: adm-luke.sullivan), and the script path.
Monitoring these changes helps verify that configuration modifications are made by authorized administrators and align with our change management process.
Tracking GPO Modifications
One important use case for Event 5136 is monitoring changes to Group Policy Objects. GPOs allow administrators to manage configuration across the domain centrally. A single GPO can deploy software, configure security settings, or change audit policies on thousands of machines at once.
This is exactly why attackers target them. Modifying a single GPO allows an attacker to deploy ransomware, turn off security controls, or establish persistence across an entire domain in a single action.
Let's say an administrator (or attacker) modifies a GPO. To view GPO modifications in Splunk:
Note: This query won't return results on the attached VM since no modifications occurred during the captured time window. The screenshot below shows what the output looks like in an environment where GPOs were modified.
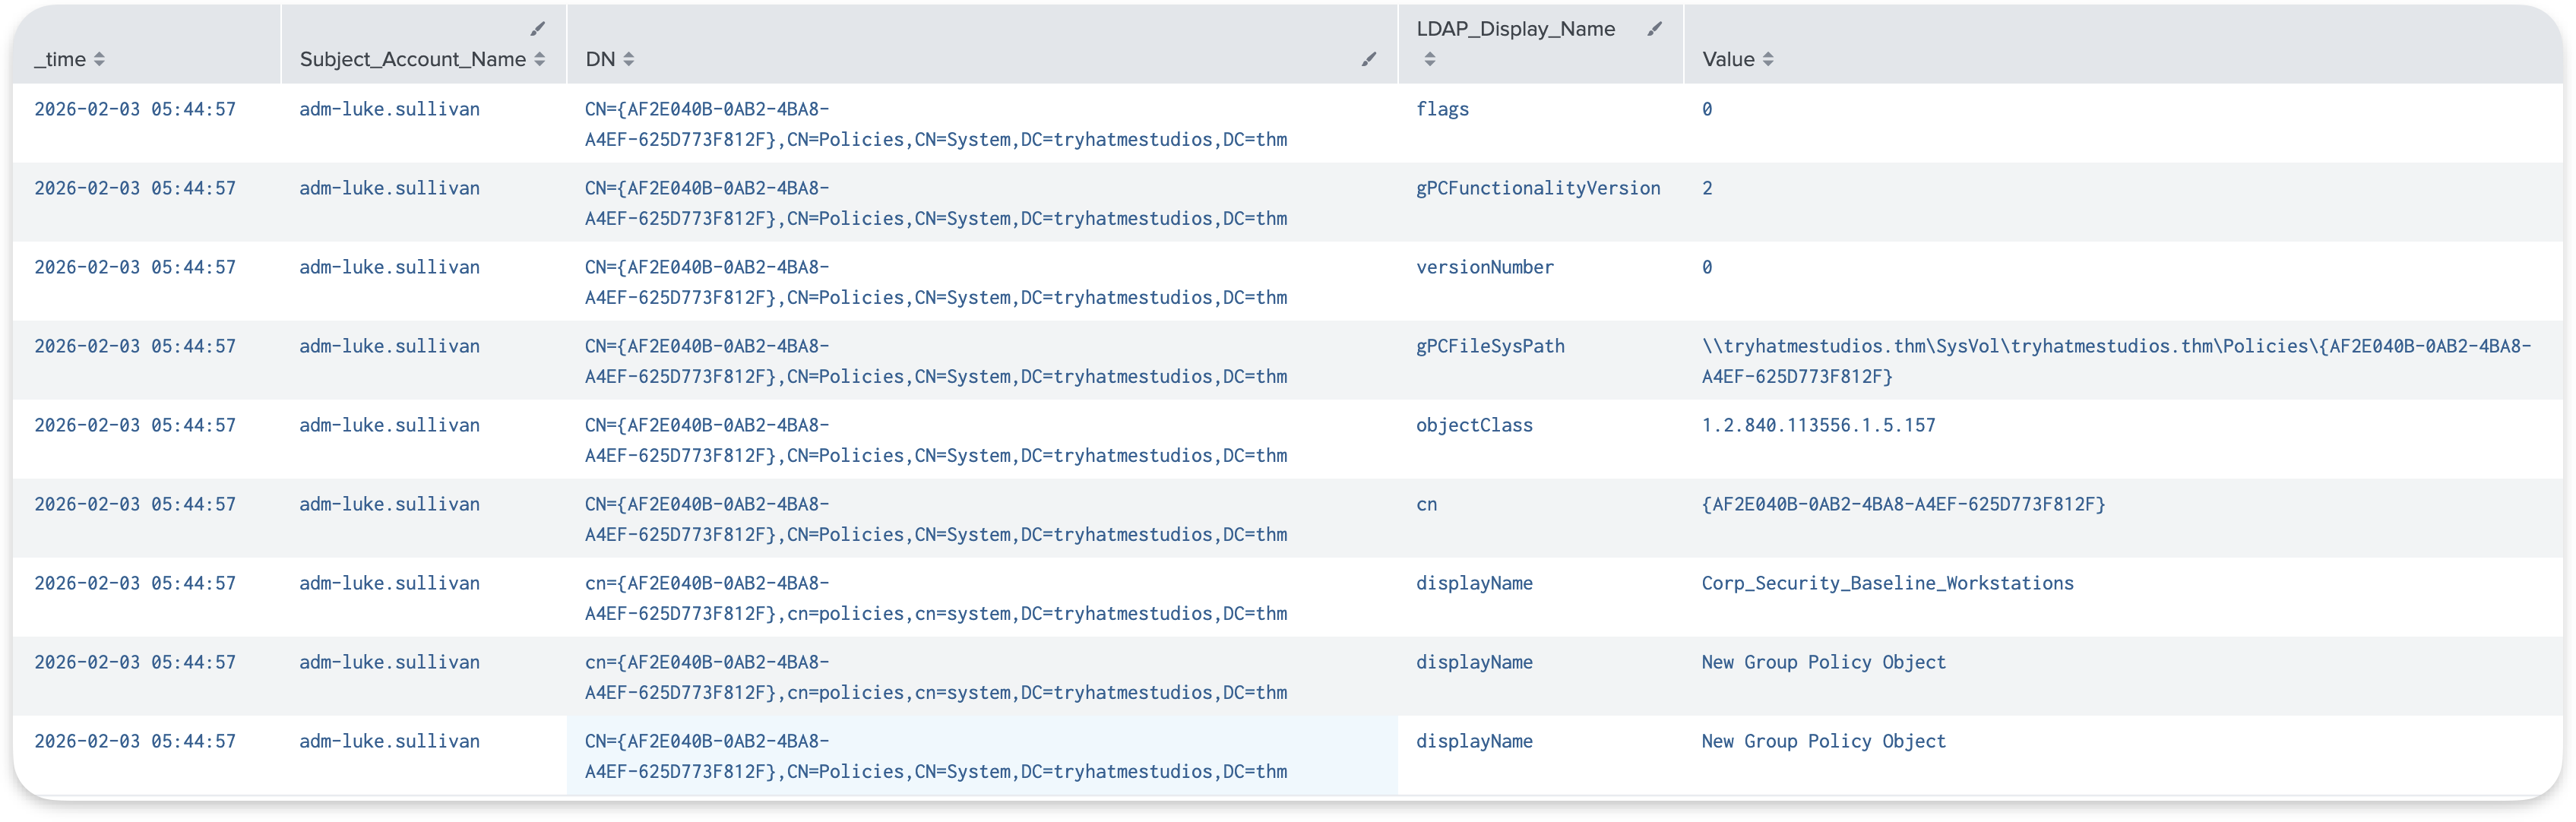
This query returns all changes, showing us:
- Who modified (
Subject_Account_Name), - Which GPO was affected (
DN), - And what changed (
LDAP_Display_NameandValue).gPCFileSysPath, which shows theSYSVOLfor the group policy being configured.versionNumberattribute (indicates modification count)
This visibility tells us when GPO objects are created, renamed, or modified. The displayName and DN fields help us identify which GPO was touched, and Subject_Account_Name shows who made the change.
Note: While Event 5136 captures changes to metadata stored in Active Directory (such as the 's name, version number, or SYSVOL path), it doesn't capture changes to the policy settings configured within the GPO. For example, if an administrator changes a password policy from 10 characters to 14 characters, Event 5136 will show the GPO's versionNumber incrementing, but not what specific setting changed. The actual policy configurations are stored in SYSVOL files, which require separate monitoring.
Logon Events
Every time someone authenticates to a system, Windows records whether the authentication succeeded or failed. These events capture interactive logins at a workstation, network connections to file shares, RDP sessions, and service accounts starting background processes.
Understanding logon events helps us answer fundamental questions during investigations:
- Who accessed this system?
- When?
- From where?
- And did they succeed?
| Event ID | What Happened |
|---|---|
| 4624 | Successful logon |
| 4625 | Failed logon |
Understanding Logon Types
The The LogonType field tells us what kind of activity generated the logon event. For example:
- A Type 2 means someone sat down at a keyboard.
- A Type 3 means they accessed a file share remotely.
Knowing the difference helps us interpret whether the activity makes sense for that account and context.
| Type | Meaning | Example |
|---|---|---|
| 2 | Interactive | User at keyboard, physical console |
| 3 | Network | File share access, WMI queries, remote administration |
| 4 | Batch | Scheduled tasks running under a user account |
| 5 | Service | Windows services starting under a service account |
| 7 | Unlock | User unlocking a previously locked workstation |
| 10 | RemoteInteractive | session |
To see the distribution of logon types in our environment, we run:
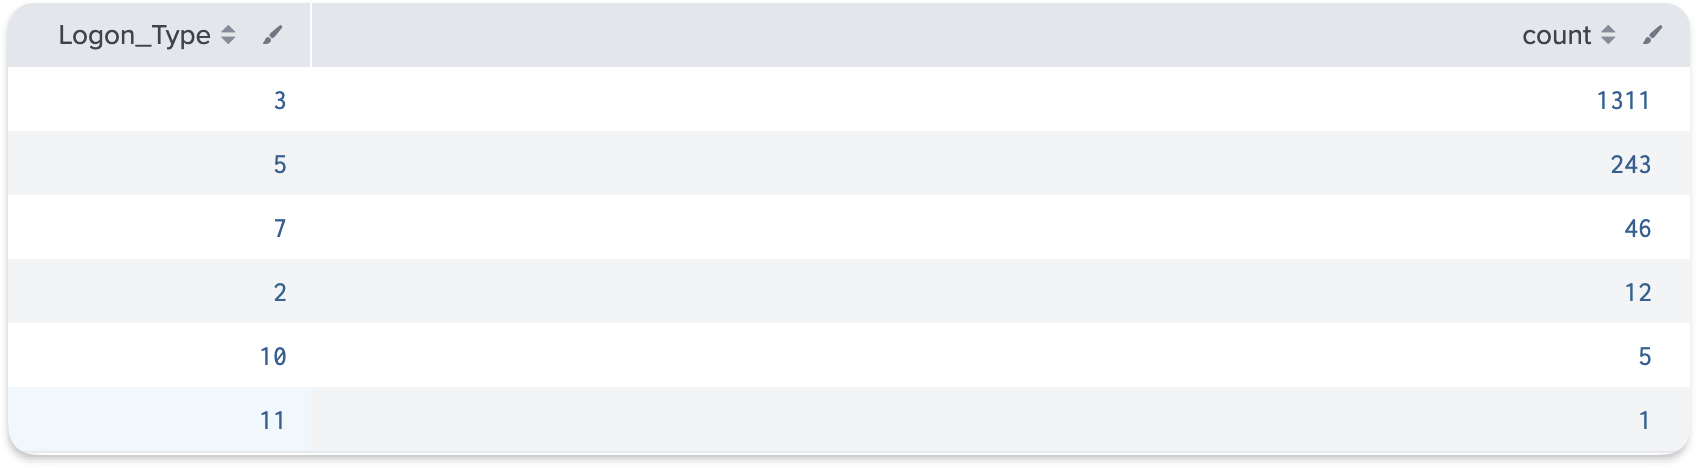
The results show us which logon types are most common.
Tip: In most environments, Type 3 (network) will dominate because file share access and remote administration generate large volumes. Type 2 and Type 10 represent actual user sessions and should be of lower volume.
In Splunk, what field contains the group name?
In Splunk, what is the MOST common logon type in the dataset?
Now that we know what events to look for and what they mean, the next question is, how do we find the unusual activity among thousands of normal events?
The answer starts with understanding what normal looks like. This is a principle I keep coming back to: we need to know normal to detect abnormal.
Volume is Normal
Looking at logs might seem overwhelming. A single user accessing a file share generates multiple events. Multiply that by hundreds or thousands of users, and we're looking at massive event counts.
Some rough numbers for a 500-user environment:
| Event | Typical Daily Volume |
|---|---|
| 4769 ( requests) | 50,000 to 100,000+ |
| 4768 ( requests) | 5,000 to 10,000+ |
| 4624 (logons) | Varies widely by server role |
This volume isn't a problem because it's completely normal. Our job isn't to review every event, but to find the anomalies hiding in the noise.
Computer Accounts ($)
In production environments, a huge portion of traffic comes from computer accounts, not users. Computer accounts in end with a $ character (e.g., THM-DC$, THM-IT-DESK$). These accounts authenticate constantly for machine-to-machine communication, system updates, and automated processes.
Computer accounts can generate 70-80% of all Kerberos traffic in busy environments. When investigating user activity, we typically want to filter out non-human activity to focus on human behavior.
To see the difference, we can compare the total count of authentication events for computer accounts vs user accounts using the following Splunk query:
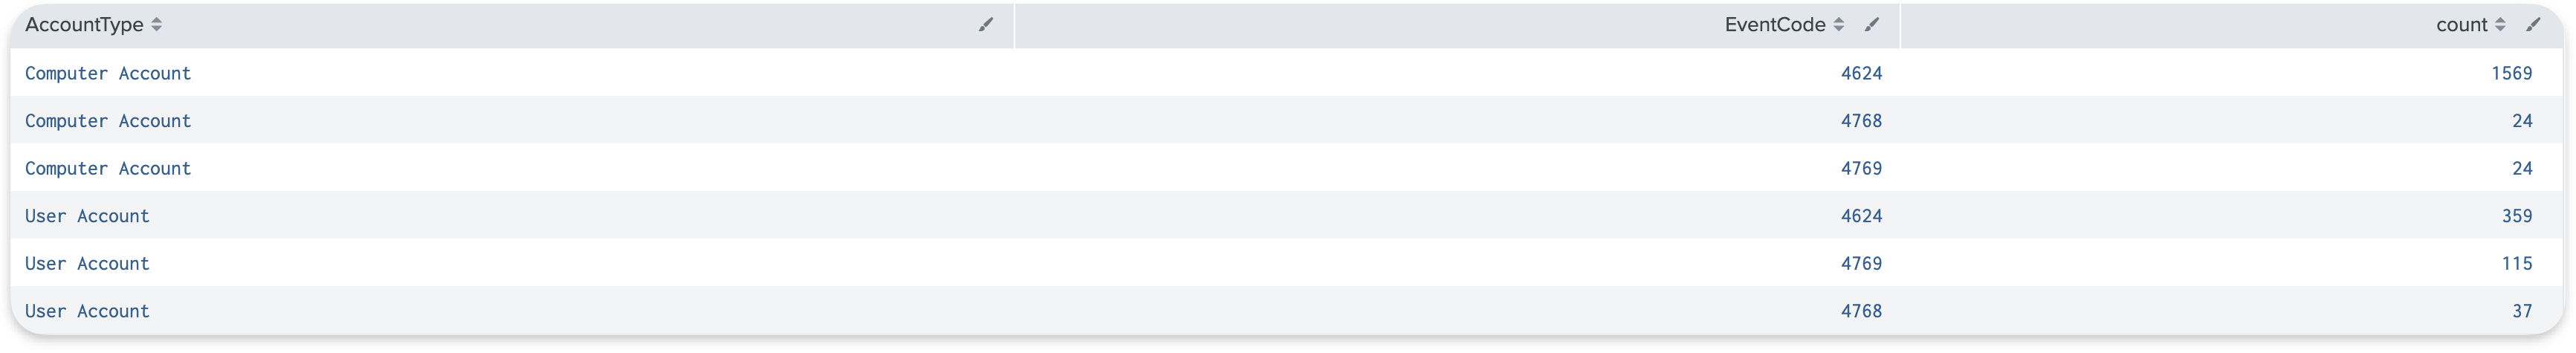
We can see that computer accounts have 1500+ successful login events, while user accounts have 350+ login events. This shows that filtering out these computer accounts can make a huge difference during investigations.
Common Service Name Patterns
When we look at 4769 events, the Service_Name field tells us what resource was accessed:
| ServiceName Pattern | What It Represents |
|---|---|
| krbtgt | TGT renewal requests |
| cifs/THM-SHR-SRV | File share access |
| ldap/THM-DC | Directory queries |
| http/THM-WEB-SRV | Web application access |
| MSSQLSvc/THM-SQL-SRV | SQL Server access |
| HOST/THM-IT-DESK | General host services |
These patterns represent our baseline of normal activity. When we see a service name that doesn't fit these patterns, that's something worth investigating more closely.
Service Account Patterns
Service accounts follow predictable patterns. Same sources, same destinations, same times. Understanding these patterns helps us recognize what's normal for our environment:
| Account Type | Expected Pattern |
|---|---|
| SQL service accounts | Access database servers from application servers |
| Backup service accounts | Access file shares from backup servers, typically overnight |
| Monitoring accounts | Query multiple systems at regular intervals |
| Admin accounts | Access from designated admin workstations during business hours |
Stack Counting Technique
Stack counting (also known as long-tail analysis) is one of the most useful techniques for detecting anomalies. It's simply counting how many times each value appears, sorting the results by frequency, and then focusing your attention on the rare events at the bottom of the list.
We demonstrate this technique using Event 4769 because it shows service ticket requests, which reveal what resources users accessed and how frequently. High-volume activity is normal, but rare activity often indicates anomalies worth investigating.
For example, to find suspicious accounts using stack counting:
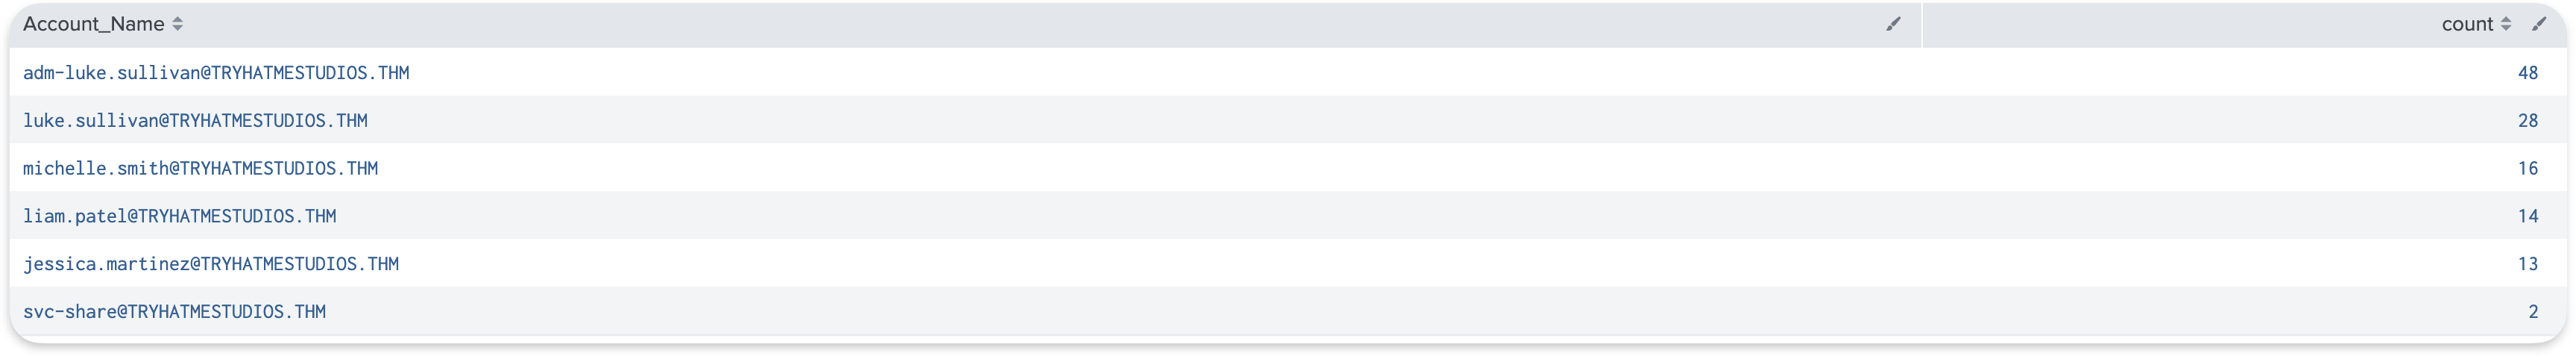
As shown in the results above:
- Top results show our baseline: normal, expected accounts accessing services regularly
- Bottom results show rare events: accounts that only appeared once or twice, which is where anomalies typically hide
If 90% of our service ticket requests come from known, authorized accounts in our environment, that's normal. But if we see an account at the bottom that only requested one or two service tickets, that stands out precisely because it's rare and deserves investigation.
This technique applies to any field in any event type, for example:
- Stack count by
Account_Nameto find unusual user accounts - Stack count by
Client_Addressto find unusual source IPs - Stack count by
Service_Nameto find unusual services being accessed - Stack count by
Ticket_Encryption_Typeto find unusual encryption methods
The rare values at the bottom are where we focus our investigation efforts.
Time-Based Patterns
Timing matters when evaluating whether activity is normal. Business applications are accessed during work hours, backup services run overnight, and batch jobs run within scheduled windows. When we see activity, we should ask ourselves whether the timing makes sense for that account and its purpose.
Understanding these patterns for our environment helps us know what to expect:
| Activity | Expected Time |
|---|---|
| User logins | Business hours (8 AM - 6 PM) |
| Backup account activity | Overnight (midnight - 4 AM) |
| Batch job accounts | Scheduled windows |
| Admin account usage | During maintenance windows |
Understanding these patterns helps us recognize when something deviates from the norm.
What character suffix identifies computer accounts in AD?
Using Event ID 4769, what is the MOST frequently requested service?
One of the frustrating things about Windows logging is that many useful events aren't logged by default. Critical categories, such as DS Access and detailed logging, are turned off by default. If our audit policies aren't configured correctly, we'll have gaps in our visibility, and some of the events we just covered simply won't appear.
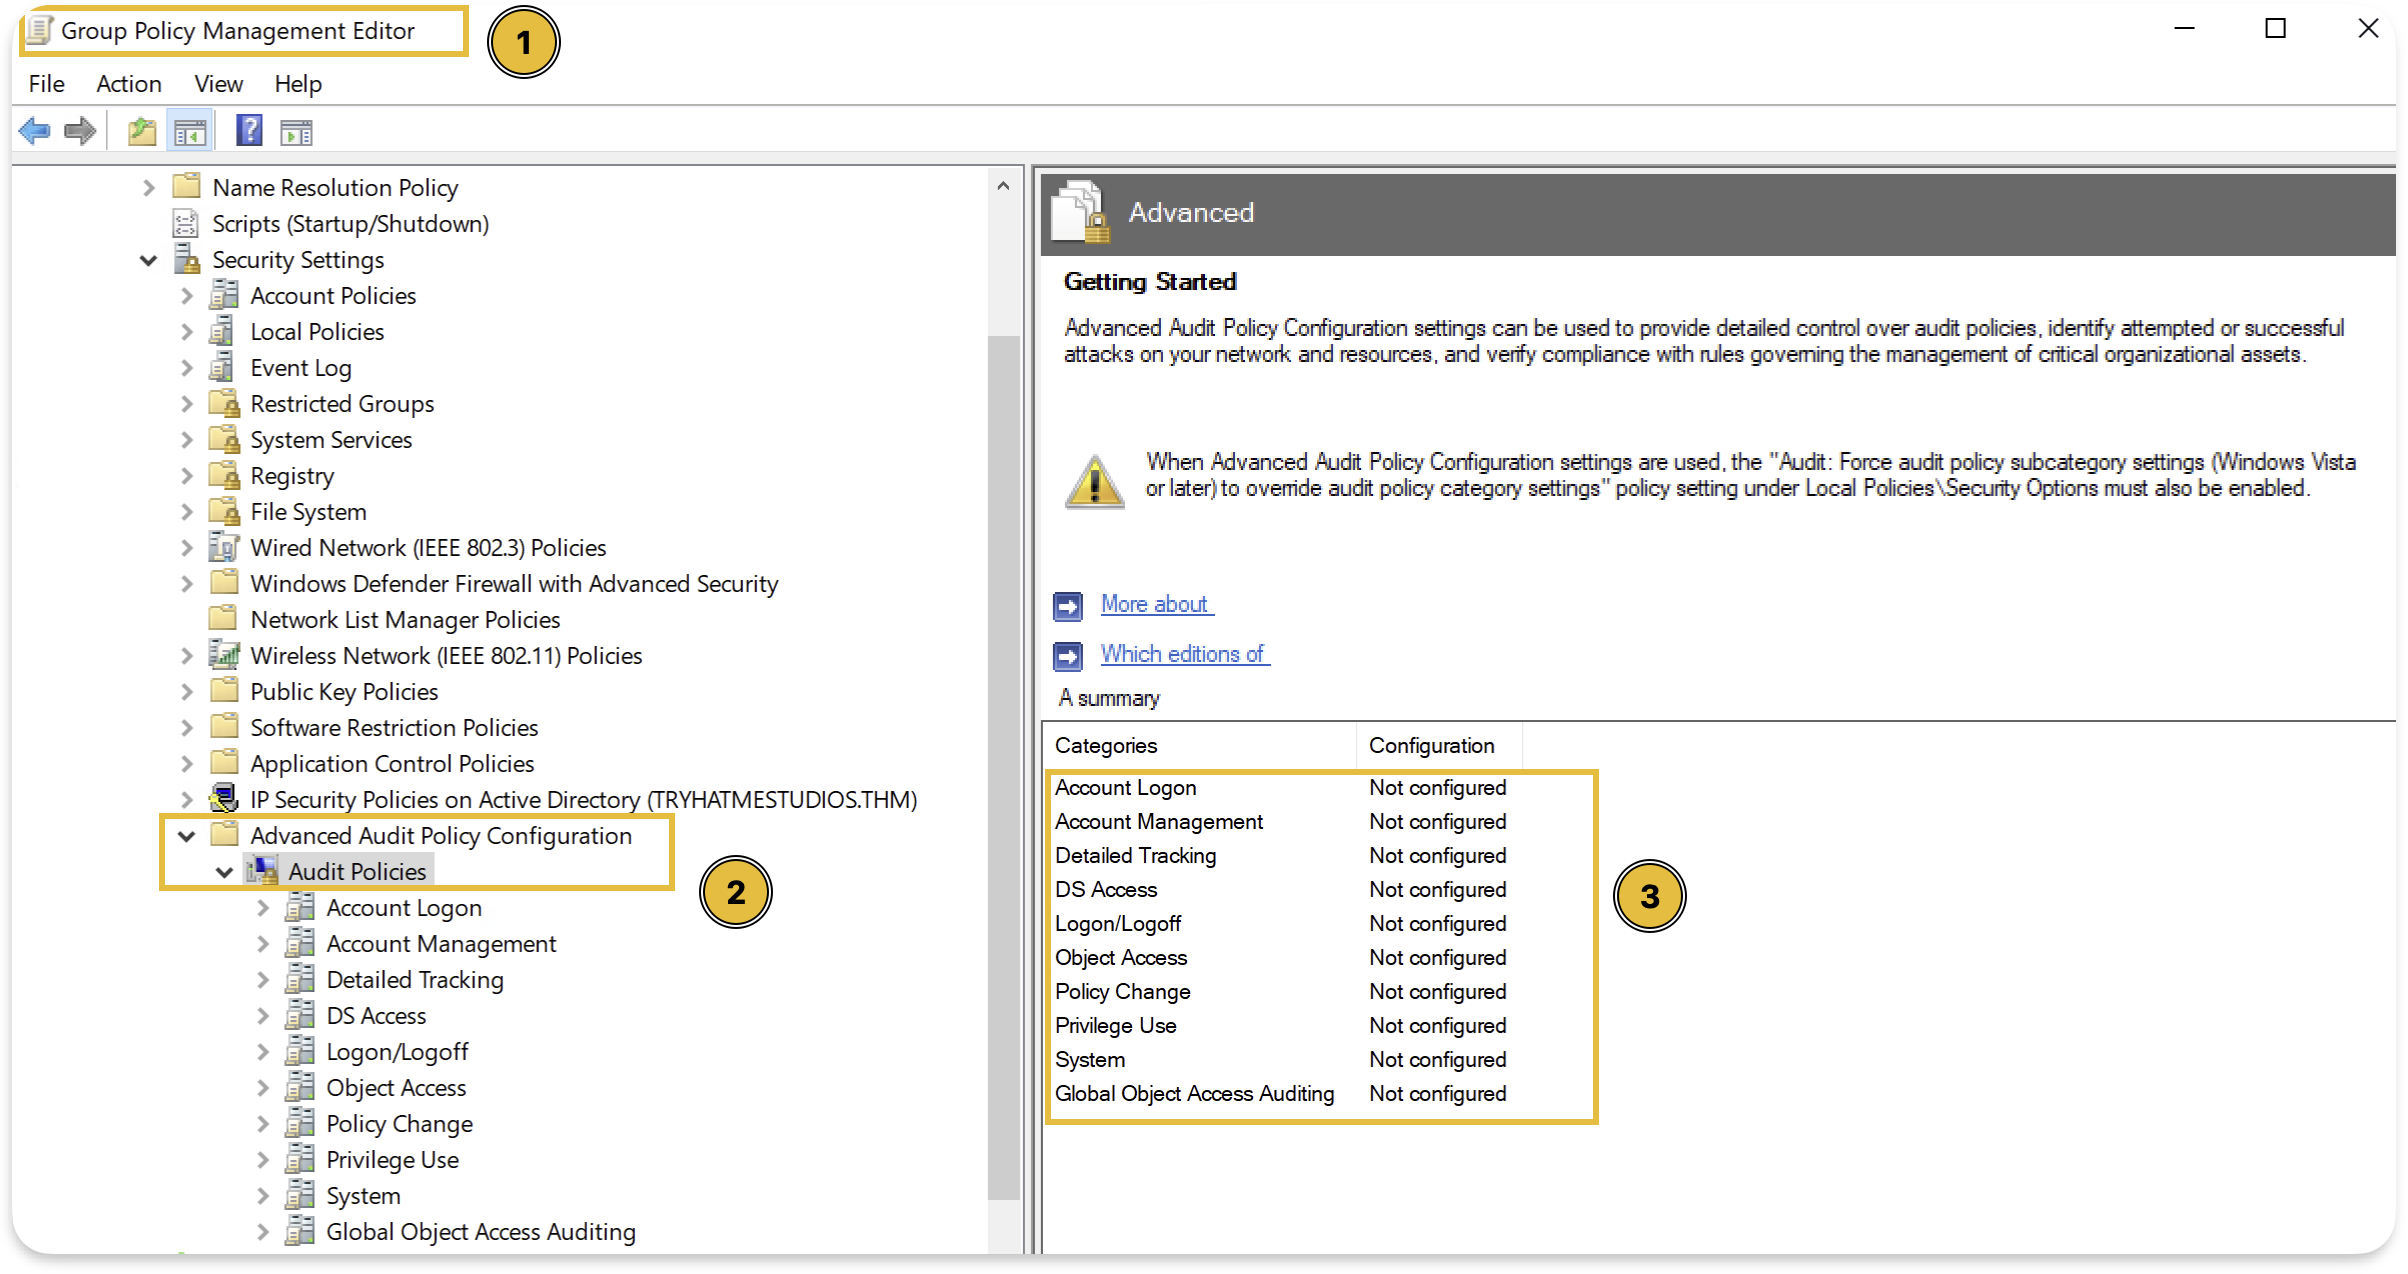
Advanced Audit Policy Configuration
The Advanced Audit Policy Configuration is found in Group Policy at: Computer Configuration → Policies → Windows Settings → Security Settings → Advanced Audit Policy Configuration → Audit Policies as shown below:
Here are the minimum settings for full visibility:
| Category | Subcategory | Setting | Events Generated |
|---|---|---|---|
| Account Logon | Credential Validation | Success, Failure | 4776 () |
| Account Logon | Authentication Service | Success, Failure | 4768, 4771 |
| Account Logon | Service Ticket Operations | Success, Failure | 4769 |
| Account Management | User Account Management | Success, Failure | 4720, 4722, 4724, 4725 |
| Account Management | Security Group Management | Success, Failure | 4728, 4732, 4756 |
| DS Access | Directory Service Changes | Success, Failure | 5136 |
| Logon/Logoff | Logon | Success, Failure | 4624, 4625 |
| Object Access | File Share | Success | 5140 |
After we have seen what each of these events captures in the previous tasks, this table should make more sense to us now. Each subcategory controls whether those specific events get logged.
Verifying Your Configuration
In a production environment, we can check current audit settings on a Domain Controller either from Group Policy Management Editor as shown above, or by running the following commands:
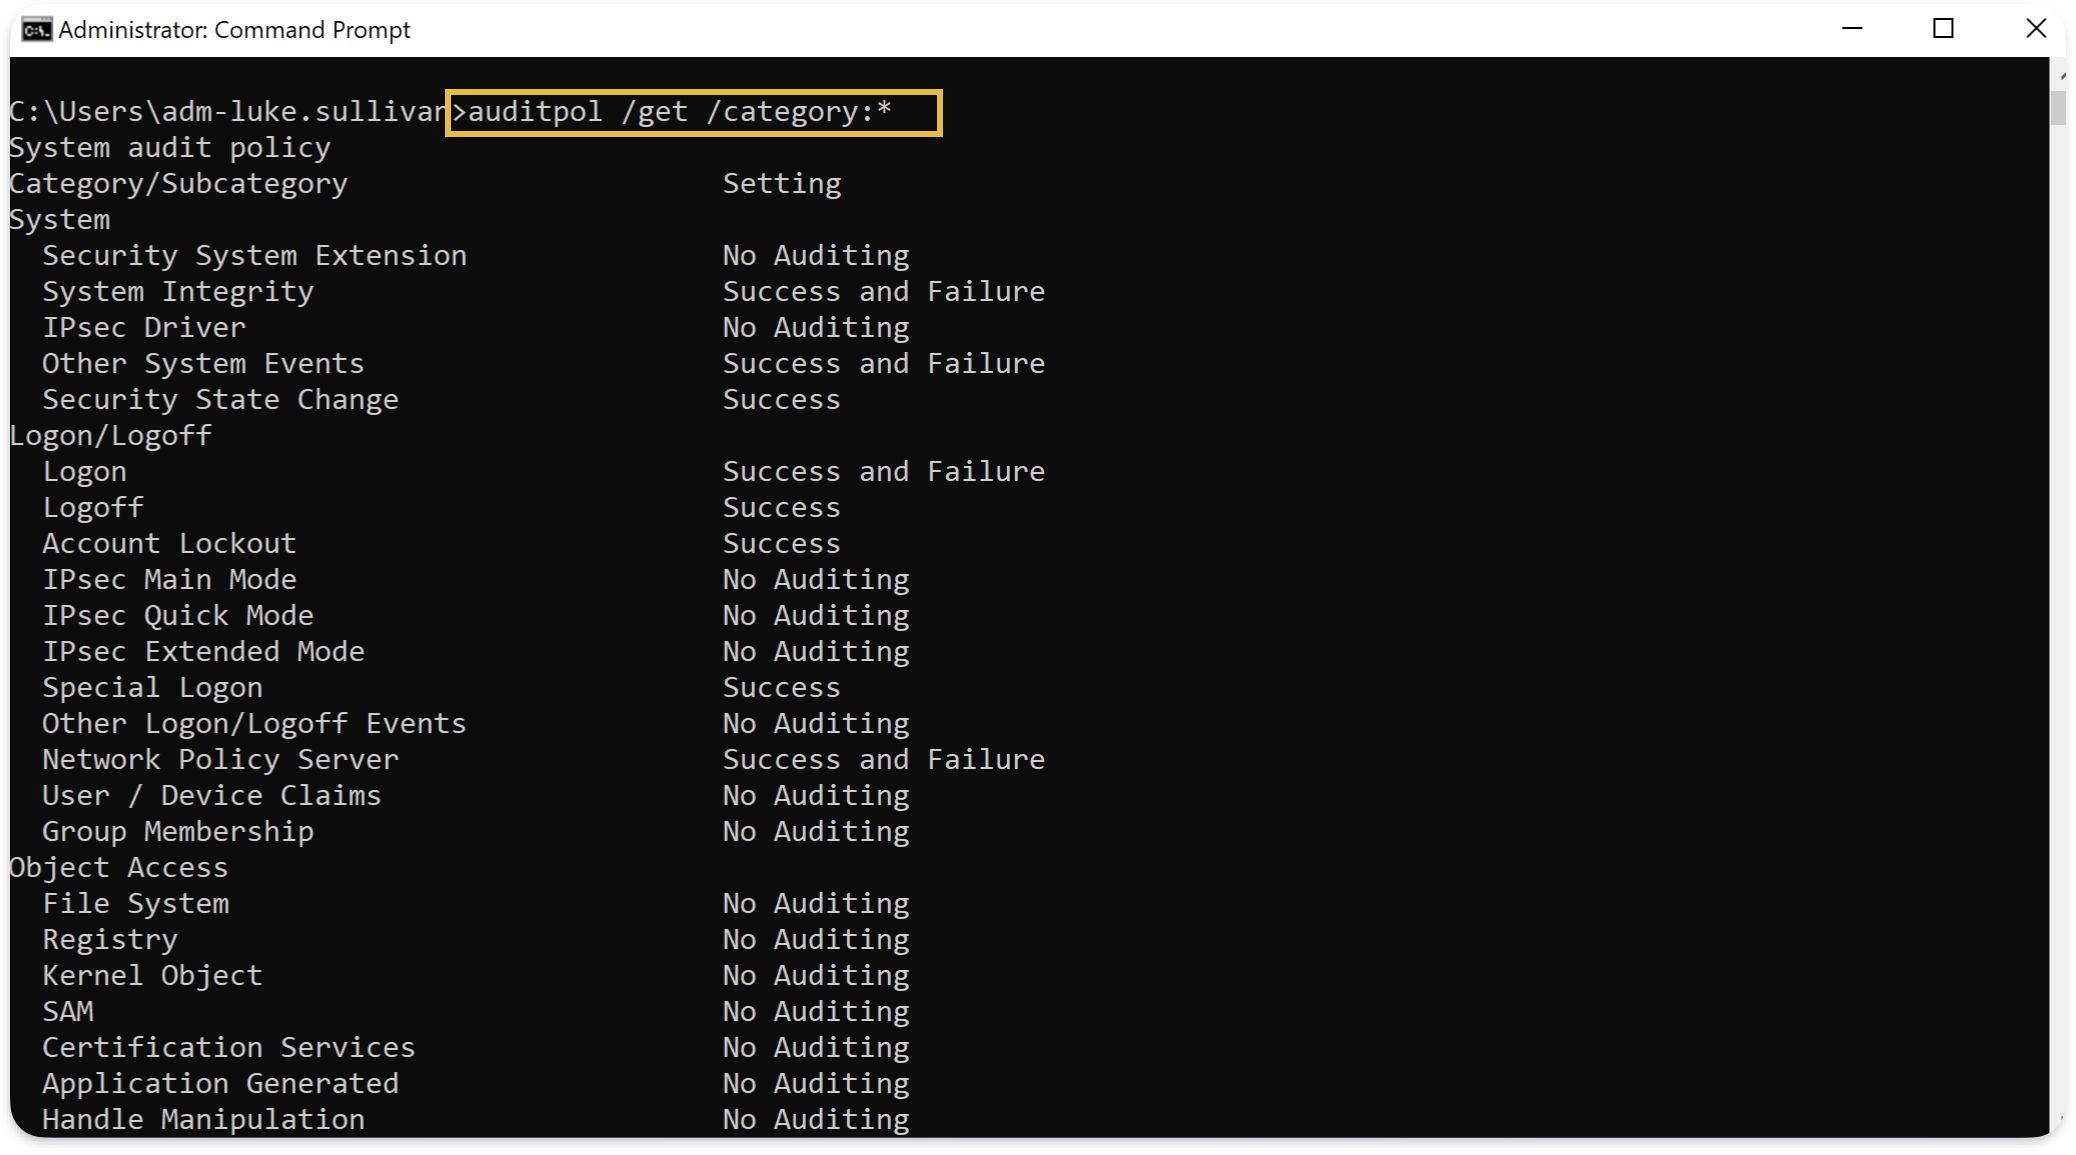
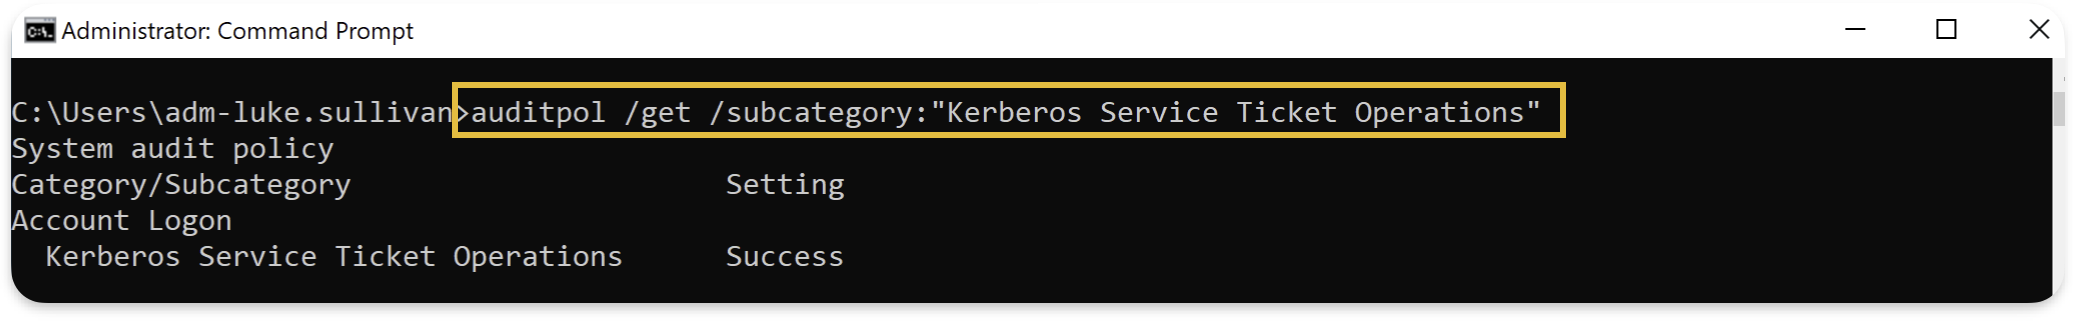
The output shows current audit settings. Each subcategory should show "Success and Failure" for the categories listed above.
What command displays all current audit policy settings on a domain controller?
Now that we've covered the concepts, let's put everything together with a practical investigation scenario.
Scenario
A new employee joined the company's marketing department yesterday. As part of the security team's onboarding verification process, we need to audit their account creation and first-day activity to ensure everything looks normal.
Use what you learned in the previous tasks to investigate this user activity in .
What is the name of the newly created account?
Who created this account?
What group was this user added to?
What was the source IP address of nathan.brooks's first TGT request?
We've now built the foundation for monitoring. We went through what protocols generate traffic, what events get logged, how to configure audit policies, and how to find anomalies using stack counting.
Takeaways
- , , , and generate most traffic, and understanding them helps us interpret events.
- Authentication events appear on DCs, logon sessions appear on targets, and we need both.
- Without proper configuration, many events aren't logged at all.
- Thousands of events per day are expected. Use stack counting to find anomalies.
- Individual events are data, but correlated sequences reveal what actually happened.
Click Check to finish this room.
Ready to learn Cyber Security?
TryHackMe provides free online cyber security training to secure jobs & upskill through a fun, interactive learning environment.
Already have an account? Log in