
Network Traffic Basics
Learn what network analysis is, why it is essential, how to collect network traffic and which tools are available
easy

To access material, start machines and answer questions login.
Network Traffic Analysis () is a process that encompasses capturing, inspecting, and analyzing data as it flows in a network. Its goal is to have complete visibility and understand what is communicated inside and outside the network. It is important to stress that is not a synonym for the tool Wireshark. It is more than that: It is a combination of correlating several logs, deep packet inspection, and network flow statistics with specific outlined goals (which we will discuss later on).
Knowing how to analyze network traffic is an essential skill, not only for an aspiring L1 analyst but also for many other blue and red team roles. As an L1 analyst, you need to be able to navigate through the sea of network information and understand what is normal and what deviates from the baseline.
In this room, we will focus on defining network traffic analysis, why you need it, what and how you can observe network traffic, and some of the sources and flows of network traffic you need to be aware of.
Learning Objectives
- Know what network traffic analysis is
- Know what can be observed
- Know how to observe network traffic
- Know typical network traffic sources and flows
Prerequisites
Continue to discover the purpose of network traffic analysis
Why should we analyze network traffic? Before we answer this question, let's look at the following scenario.
Tunneling and Beaconing
You are an analyst, and you receive an alert stating that an unusual number of queries are coming from a host named WIN-016 with IP 192.168.1.16. The logs on the show multiple queries going to the same TLD, each time using a different subdomain.
2025-10-03 09:15:23    SRC=192.168.1.16      QUERY=aj39skdm.malicious-tld.com    QTYPE=A
2025-10-03 09:15:31    SRC=192.168.1.16      QUERY=msd91azx.malicious-tld.com    QTYPE=A
2025-10-03 09:15:45    SRC=192.168.1.16      QUERY=cmd01.malicious-tld.com       QTYPE=TXT
2025-10-03 09:15:45    SRC=192.168.1.16      QUERY=cmd01.malicious-tld.com       QTYPE=TXT
Based on DNS logs, we can retrieve the following information:
- Query and querytype
- Subdomain and top-level domain: We can check tools like abuseDB or VirusTotal to check if the domain is malicious
- Host IP: We can identify the system sending out the DNS queries
- Destination IP: We can use tools like AbuseIPDB (opens in new tab) or VirusTotal (opens in new tab) to verify if the IP is flagged as malicious
- Timestamp: We can build a timeline mapping out the different suspicious queries
The DNS logs don't contain more information than that, so it is hard to draw a conclusion based on that information alone. We will need to inspect the DNS traffic more thoroughly and check the content of the DNS queries and replies. This will allow us to determine the nature of these queries and replies.
This scenario is a prime example of why we need network traffic analysis. Firewalls and other devices register DNS queries and their responses but not their content. Threat actors could, for example, use TXT records to send Command and Control instructions to a compromised system. We can discover this by inspecting the content of the DNS queries. The packet capture fragment below shows the content of a DNS reply that contains C2 commands.
Domain Name System (response)
    Transaction ID: 0x4a2b
    Flags: 0x8180 Standard query response, No error
        1... .... .... .... = Response: Message is a response
        .... .... .... 0000 = RCODE: No error (0)
    Questions: 1
    Answer RRs: 1
    Authority RRs: 0
    Additional RRs: 0
    Queries
        cmd1.evilc2.com: type TXT, class IN
    Answers
        cmd1.evilc2.com: type TXT, class IN, TTL 60, TXT length: 20
            TXT: "SSBsb3ZlIHlvdXIgY3VyaW91c2l0eQ=="
Why should we analyse network traffic?
Generally, we will use network traffic analysis to:
- Monitor network performance
- Check for abnormalities in the network. E.g., sudden performance peaks, slow network, etc
- Inspect the content of suspicious communication internally and externally. E.g., exfiltration via , download of a malicious ZIP file over , lateral movement, etc
From a perspective, network traffic analysis helps:
- Detecting suspicious or malicious activity
- Reconstructing attacks during incident response
- Verifying and validating alerts
Below are two more scenarios that illustrate the importance of network traffic analysis:
- Based on the logs for an end-user system, the system began to deviate from its normal behavior around 4 PM . Analyzing the network traffic going to and from this system, we found a suspicious request and were able to extract a suspicious ZIP-file
- We received an alert that an end-user system is sending many requests in comparison to baseline of the network. After inspecting the requests, we discovered that data was being exfiltrated using a technique called tunneling
Now that we know why we need network traffic analysis, let's continue with the next task to discover what exactly we can monitor.
What is the name of the technique used to smuggle C2 commands via DNS?
The best way to showcase the traffic we can observe in the network is by using the architecture implemented in nearly every device with a network interface: the /IP stack. The image below shows the different layers of the /IP model. Each layer describes the required information (headers) to pass the data to the next layer. The information included in each header, together with the application data, is precisely what we want to observe. Logs often include bits and pieces of these headers, but never the full packet details. This is why we need to do network traffic analysis.
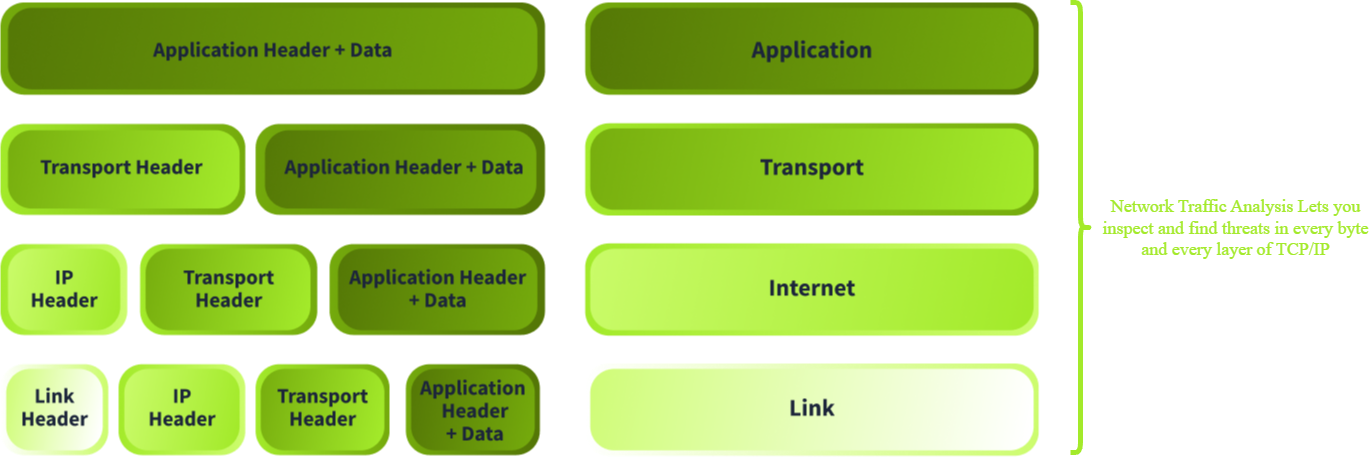
Application
On the application layer, we can find two important information structures: the application header information and the application data itself (payload). This information will change depending on which application layer protocol is used. Let's look at an example of .
The code snippets below show the application headers of a client sending a GET request and the server's response. Most web proxies and firewalls log this header data. What they don't log is the application data or payload. From the GET request, you can determine that the client is requesting a file named suspicious_package.zip. The server's response includes a 200 code, which means the request was accepted. However, what you can't see in the logs is the content of the ZIP file (highlighted in yellow).
Request
GET /downloads/suspicious_package.zip HTTP/1.1
Host: www.tryhackrne.thn
User-Agent: curl/7.85.0
Accept: */*
Connection: close
Response
HTTP/1.1 200 OK
Date: Mon, 29 Sep 2025 10:15:30 GMT
Server: nginx/1.18.0
Content-Type: application/zip
Content-Length: 10485760
Content-Disposition: attachment; filename="suspicious_package.zip"
Last-Modified: Mon, 29 Sep 2025 09:54:00 GMT
ETag: "5d8c72-9f8a1c-3a2b4c"
Accept-Ranges: bytes
Connection: close

[binary ZIP file bytes follow — 10,485,760 bytes]
Transport
The application data and header are segmented and encapsulated at the transport layer into smaller pieces. Each piece includes a transport header, in most cases TCP or UDP. Let's have a look at the firewall log entries below:
2025-10-13 09:15:32 ACCEPT TCP src=192.168.1.45 dst=172.217.22.14 sport=51432 dport=443 flags=SYN len=60
2025-10-13 09:15:32 ACCEPT TCP src=172.217.22.14 dst=192.168.1.45 sport=443 dport=51432 flags=SYN,ACK len=60logs often include the source and destination ports and the flags, but all the other fields are often not included. However, they are valuable for detecting certain types of attacks, such as session hijacking. Session hijacking can be detected by analyzing the sequence numbers included in the header. If the sequence numbers are suddenly far apart, further investigation is warranted. The output below shows a series of packets captured with Wireshark.
No.     Time        Source          Destination     Protocol Length  Info
1       0.000000    192.168.1.45    172.217.22.14   TCP      74      51432 → 80 [SYN] Seq=0 Win=64240 Len=0 MSS=1460
2       0.000120    172.217.22.14   192.168.1.45    TCP      74      80 → 51432 [SYN, ACK] Seq=0 Ack=1 Win=65535 Len=0 MSS=1460
3       0.000220    192.168.1.45    172.217.22.14   TCP      66      51432 → 80 [ACK] Seq=1 Ack=1 Win=64240 Len=0
4       0.010500    192.168.1.45    172.217.22.14   TCP      1514    51432 → 80 [PSH, ACK] Seq=1 Ack=1 Win=64240 Len=1460
5       0.010620    172.217.22.14   192.168.1.45    TCP      66      80 → 51432 [ACK] Seq=1 Ack=1461 Win=65535 Len=0
6 0.020100 192.168.99.200 172.217.22.14 TCP 74 51432 → 80 [PSH, ACK] Seq=34567232 Ack=1 Win=64240 Len=20 - The first 3 lines show a normal 3-way handshake
- Lines 4 and 5 show legitimate data transfer
- Line 6 shows a packet from another source trying to inject itself into the session. Note the massive jump in the sequence number
Internet
When the transport layer sends down a segment, the internet layer also adds its header. If the segment is larger than the Maximum Transmission Unit (MTU), it will be divided into fragments, and a header will be added to each of them. The fields that are most often logged are the source and destination IP and TTL. This is sufficient for most use cases. But, if we want to, for example, detect fragmentation attacks, we will need to inspect the fragment offset and total length fields as well. There are different variations of a fragmentation attack. For example, an attacker can create tiny fragments to evade the IDS or mess up the reassembly of fragments by using overlapping byte ranges. The example below shows overlapping byte ranges. The offset in line 3 (highlighted in yellow) overlaps with the one in line 2. This means that the complete packet can be reassembled one way or another. Attackers can use this technique to bypass an IDS, for example.
No.   Time       Source        Destination   Protocol Length Info
1     0.000000   203.0.113.45  192.168.1.10  UDP      1514    Fragmented IP protocol (UDP) (id=0x1a2b) [MF] Offset=0, Len=1480
2     0.000015   203.0.113.45  192.168.1.10  UDP      1514    Fragmented IP protocol (UDP) (id=0x1a2b) [MF] Offset=1480, Len=1480
3     0.000030   203.0.113.45  192.168.1.10  UDP       600    Fragmented IP protocol (UDP) (id=0x1a2b) Offset=1480, Len=64   <-- Overlap
4     0.000045   192.168.1.10  203.0.113.45  ICMP      98     Destination unreachable (Fragment reassembly time exceeded)
Link
Once the internet layer finishes encapsulation, the IP packet is sent to the link layer. The link layer adds its header as well, containing more addressing information. Most logs will display the source and destination MAC addresses. For certain types of attacks, for example, ARP poisoning or spoofing, the information in the logs won't be sufficient. For these types of attacks, we need the full packet and context. What you, for example, can't see in a log is when the MAC address appears from multiple interfaces or when many gratuitous ARP packets are sent out with conflicting MAC addresses. The example below shows a packet capture detailing an ARP poisoning attack. The host with IP 192.168.1.200 is replying to each ARP request with the same MAC.
No.   Time       Source           Destination      Protocol Length Info
1     0.000000   192.168.1.1      Broadcast        ARP      60     Who has 192.168.1.10? Tell 192.168.1.1
2     0.000025   192.168.1.10     192.168.1.1      ARP      60     192.168.1.10 is at 00:11:22:33:44:55
3     1.002010   192.168.1.200    192.168.1.1      ARP      60     192.168.1.10 is at aa:bb:cc:dd:ee:ff  <-- Attacker spoof
4     1.002015   192.168.1.200    192.168.1.10     ARP      60     192.168.1.1 is at aa:bb:cc:dd:ee:ff  <-- Attacker spoof
5     1.100000   192.168.1.10     172.217.22.14    TCP      74     54433 → 80 [SYN] Seq=0 Win=64240 Len=0
6 1.100120 192.168.1.200 172.217.22.14 TCP 74 54433 → 80 [SYN] Seq=0 Win=64240 Len=0 <-- Relayed via attackerLook at the HTTP example in the task and answer the following question: What is the size of the ZIP attachment included in the HTTP response? Note down the answer in bytes.
Which attack do attackers use to try to evade an IDS?
What field in the TCP header can we use to detect session hijacking?
In the previous task, we discussed what we can observe theoretically based on the /IP stack. Practically, it is more helpful to focus on specific sources and flows. A corporate network typically has some predetermined network flows and sources. We can group the sources into two categories:
- Intermediary
- Endpoint
The flows we can also group into two categories:
- North-South: Traffic that exits or enters the LAN and passes the
- East-West: Traffic that stays within the LAN (including LAN that extends to the cloud)
Let's explore each of them below.
Sources
As mentioned, two network traffic sources exist: endpoint and intermediary devices. These devices can be found within the LAN and WAN.
Intermediary Sources
These are devices through which traffic mostly passes. While they generate some traffic, it is significantly lower than what endpoint devices generate. Under this category, we can find firewalls, switches, web proxies, , , routers, access points, wireless LAN controllers, and many more. Maybe less relevant for us, but all the infrastructure of Internet Service Providers is also considered part of this category.
The traffic that originates from these devices comes from services like routing protocols (EIGRP, OSPF, BGP), management protocols (SNMP, PING), logging protocols (SYSLOG), and other supporting protocols (, STP, ).
Endpoint Sources
These are devices where traffic originates and ends. Endpoint devices take the bulk of the network bandwidth. Devices that fall under this category are servers, hosts, devices, printers, lab machines, cloud resources, mobile phones, tablets, and many more.
Flows
A network traffic flow is typically determined by the services available in the network, such as Active Directory, , HTTPS, and so on. In a typical corporate network, we can group these flows into North-South and East-West traffic.
North-South Traffic
NS traffic is often monitored closely as it flows from the LAN to the WAN and vice versa. The most well-known services in this category are client-server protocols like HTTPS, , , , , , and many more. Each of these protocols has two streams: ingress (inbound) and egress (outbound). All of this traffic passes the in one way or another. Configuring rules and logging properly are key to visibility.
East-West Traffic
EW traffic stays within the corporate LAN, so it is often monitored less. However, it is important to keep track of these flows. When the network is compromised, an attacker will often exploit different services internally to move laterally within the network. As we see below, there are many services within this category. Click on each category to see which services it contains.
Directory, Authentication & Identity Services
- / : Authentication/queries to Active Directory
- RADIUS / TACACS+: Network access control
- Certificate Authority issuing internal certifications
File shares & print services
- /CIFS: Accessing network drives
- IPP/LPD: Printing over the network
Router, switching, and infrastructure services
- traffic between hosts and the server
- broadcast messages
- Internal
- Routing protocol messages
Application Communication
- Database Connections: over
- Microservices APIs: or calls between services
Backup & Replication
- File Replication: Between data centers or to backup servers
- Database Replication: MySQL binlog replication, PostgreSQL streaming, and more
Monitoring & Management
- SNMP: Device health metrics
- Syslog: Centralized logging
- /: Traffic flow telemetry
- Other endpoint logs sent to a central logging server
Flow Examples
Let's have a visual look at some of the network flows mentioned above.
HTTPS
There are different variations of HTTPS network traffic flows. Let's examine a flow where the web does inspection:
A host requests a website; this request is sent to the NGFW, which includes a web . The web will act as the web server and simultaneously establish a new session with the actual web server and forward the clients' requests. When the web receives the answer from the web server, it inspects its contents and then forwards it to the host if deemed safe. To summarize, we have two sessions, one between the client and the and the other between the and the web server. From the client's point of view, it has established a session with the web server.

External
traffic within a corporate network starts when a host sends a query. The host sends the query to the internal server on port 53, which will then act on behalf of the host. First, it will check if it has an answer to the query in its cache; if not, it will send the query via the router, through the , to the configured servers. The answer will then follow the same path to the internal server, which will then forward it to the host. The network diagram below shows a simplified flow.

with
When a host opens a share to, for example, \\FILESERVER\MARKETING, an session is set up. First, authentication is done via . When a user logged in on the host, it authenticated with the Key Distribution Center on the Domain Controller and received a Ticket Granting Ticket to request "service authentication tickets". Now, the host requests a service ticket using the Ticket Granting Ticket it received earlier. The host then uses this ticket to establish the connection. Once the session is set up, the host can access the share. Below we see a simplified network diagram of the flow.

Which category of devices generates the most traffic in a network?
Before an SMB session can be established, which service needs to be contacted first for authentication?
What does TLS stand for?
Now that we have covered what we can and should observe in a network, let's examine how. As mentioned in the introduction, network traffic analysis focuses on combining multiple sources of information, analyzing them, finding patterns, and using the results to inform actions.
We can obtain these sources of information in multiple ways:
- Logs
- Full Packet Capture
- Network Statistics
Logs
Logs are our first entry into acquiring information about what is going on in the network. Each system and protocol in the network includes a way of logging information. It is essential to know that there is no universal standard for implementing logging on each system and protocol. Each vendor chooses how to implement logging for themselves. For example, Microsoft implements Windows Event Logs. Also, the data that is logged is up to the vendor. Most vendors will not log a full packet as it enters or exits the system. They will log some fields that they deem useful, such as a source IP address and a destination IP address. On the terminal below, we see some example logs of authentication on a host using the Syslog format and an web server access log that uses the CLF standard.
# Auth log
Oct  8 11:20:15 web01 sshd[2145]: Accepted password for gensane from 192.168.1.50 port 52234 ssh2

# Apache web server access log
192.168.1.50 - - [08/Oct/2025:11:20:18 +0200] "GET /index.html HTTP/1.1" 200 2326 "-" "Mozilla/5.0"
Even though there is no standard logging way, there are some protocols that offer a standardized way of sending log messages from devices to collectors, for example, Syslog and SNMP.
When the logs don't provide enough information, we must dig deeper. To do so, we need to correlate logs, inspect full packet captures, and check network statistics.
Full Packet Capture
In task three, we discussed what a full packet looks like. Now, we want to know how to capture and inspect those packets. To do this, we have two options:
- Install a physical network tap
- Configure port mirroring
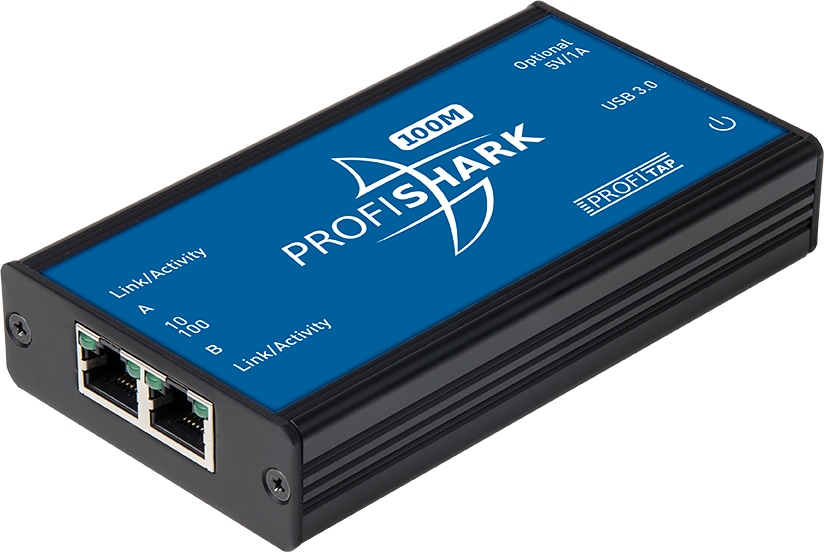
Network Tap
A network tap is a physical device you place inline in your network. These devices create a copy of all the network traffic that passes without affecting performance. That copied data is then forwarded to a packet capture box, IDS, or other system using the dedicated monitoring port. It is interesting to know that a TAP operates only on the link layer of the TCP-IP model; it does not need a MAC or IP address, because it copies the electrical/light signals and sends them to its monitoring port. This way, there is no added delay to the network. The image below shows an example of a network TAP.
Port Mirroring
Port mirroring is a software approach to copying packets from one port on an intermediary device to another that is attached to, for example, an IDS, packet capture box, or other systems. Each vendor has its own name. Cisco, for example, calls it SPAN. On the terminal below, we can see how to configure SPAN on a Cisco device. In this example, the packets going through fastEthernet0/1 are duplicated and sent to fastEthernet0/2.
Switch(config)# monitor session 1 source interface fastEthernet0/1
Switch(config)# monitor session 1 destination interface fastEthernet0/2
The image below shows what this would look like. The WIN-001 sends packets through the switch to communicate with the server. When the packet arrives at the switch, it gets duplicated and is also sent to the monitoring device.
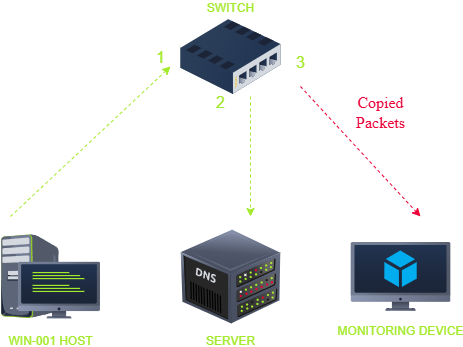
Note that the intermediary devices do not necessarily need to be physical, port mirroring can also be configured on a virtual devices such as a VMware vSwitch. Cloud environments also have specific services that offer mirroring. AWS, for example, offers VPC Traffic Mirroring.
Best Practices
When doing full packet capture, we need to take some things into account:
- Placement: Depending on which traffic we want to capture, we need to place the TAP or configure the mirror in the right place
- Duration: Full packet capture will require a proportionate amount of storage. If you capture traffic on a 1 Gbps line for a whole day, we would need an average of 10.8 TB of storage space. Imagine the amount of storage we need on 10Gb or 40Gb lines
- Mirror vs TAP: Physical taps offer close to zero performance reduction. Mirroring can impact performance when a huge amount of traffic passes through the mirrored port
Exercise: Open the static site and complete the two exercises by placing the tap in the correct position and uncovering the flag in the traffic. Fill in the flags at the end of this task. You can open the static site by clicking on the "View Site" button and the top of this task. The static site will open in split-screen. To open the static site in full screen, click the "Full Screen" button on the static site.
Tools
Now that we know how to do full packet captures lets have a look at the tools available to analyze these packets:
- Wireshark
- TCPdump
- / like Snort, Suricata and
These are some of the many tools that are available to analyze full packet captures. In the following rooms in this module we will focus on using Wireshark.
Network Statistics
Another great way to find anomalies in your network is to gather metadata about the data flowing through the network, such as counting the number of requests that a host sends out. A few protocols facilitate this. We will briefly discuss two of them: and .
is a protocol developed by Cisco that collects metadata about traffic flowing in a network. It is a great way to detect things like traffic, data exfiltration, and lateral movement. The image below shows a sample of output. As we can see, the sample does not contain individual packets but metadata about the flow of packets going from the source IP 12.1.1.1 to the destination IP 13.1.1.2.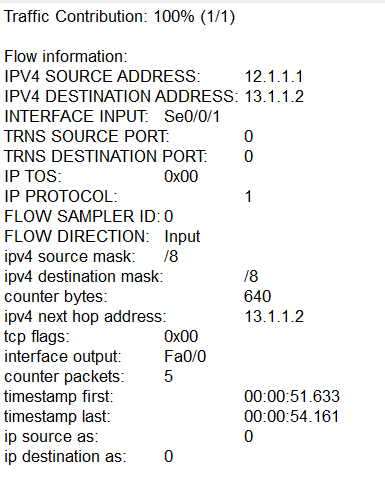
The Internet Protocol Flow Information Export protocol () can be considered as the successor to . was initially a proprietary protocol from Cisco. This means that the protocol was designed for Cisco systems only. Only from v9 on did Cisco include templating, so other vendors could adapt it to their devices. In collaboration with Cisco and other vendors, the created and released it as a vendor-neutral standard. It offers features similar to , but includes more flexibility in configuring which fields to capture.
To implement or , we don't need a whole new set of infrastructure or dedicated servers. Most vendors implement these protocols standard in their devices. We just have to enable and configure the protocol and have a place to send the metadata. You don't need a dedicated server for collecting this data; many NGFWs, , and have an implementation to collect and analyze flow data.
What is the flag found in the HTTP traffic in scenario 1? The flag has the format THM{}.
What is the flag found in the DNS traffic in scenario 2? The flag has the format THM{}.
Now that we know what is, why we need it, how to capture network traffic and analyze it; we are ready to get hands on with effectively analyzing network traffic using a tool called Wireshark. Proceed to the next room to get started with the basics of Wireshark.
I am ready to do some traffic analysis!
Ready to learn Cyber Security?
TryHackMe provides free online cyber security training to secure jobs & upskill through a fun, interactive learning environment.
Already have an account? Log in