
Key Artifacts for DFIR
Explore what artifacts to collect from a compromised host during DFIR.
medium


To access material, start machines and answer questions login.
Once you have access to OpenDoor's compromised network, it's time to collect the forensic artifacts. At least a dozen hosts are compromised, and the attacker may still be active, so your goal is to gather the artifacts that answer the most about the attack in the shortest period of time. In this room we'll cover what to collect from the Windows hosts, and in the next, we'll answer how.
Learning Objectives
- Learn what forensic artifacts exist and what they can reveal
- Build the "collection pack" from the artifacts you'll learn about
- Explore the limitations you might face during a real engagement
- Practice collecting and analyzing the artifacts explained in the room
Prerequisites
- Complete the Accessing a Compromised Network room
- Remind yourself of the OpenDoor scenario
You are an external specialist hired by OpenDoor LTD, a large UK-based real estate company, to investigate a security incident. A 2500-user Active Directory network has been compromised and data has been exfiltrated. OpenDoor's IT team noticed the attack and isolated the network before ransomware encryption. Now, it's your turn.
Lab Access
Throughout the tasks, you will need to access a Windows machine. Start it now by clicking the Start Machine button below, and use it according to the task instructions. You will need to use DefenseBox for this room or set up your own DFIR box and connect via OpenVPN.
For a smooth experience, we highly recommend using the target and DefenseBox over OpenVPN. The credentials for DefenseBox are DFIRUser:Secure!, and the credentials for the target VM are shown below.
Set up your virtual environment
Target Machine Credentials
Use it to access the target from DefenseBox or via OpenVPN.
Let's begin!
The best chance for a "quick win" during a major is to review the event logs.
Logs may reveal every attack step, so always include them in your collection pack.
Windows Event Logs
Windows event logs are generated by the in real time and can reveal a lot of things other artifacts can't reveal reliably: authentication attempts, traces, commands, and much more if properly configured. Event tampering is also very uncommon among adversaries, so the logs you'll review can typically be trusted. A few examples of what event logs can answer:
- Who logged on to MAIL-01, when, and from where? → Security log, event ID 4624
- Did anyone access the Contracts share last week? → Security log, event ID 5140
- What is that "svcuser", who created it, and when? → Security log, event ID 4720
- What PowerShell cmdlets were seen on -04? → PowerShell log, event ID 4104
- What processes were spawned by malware.exe? → log, event ID 1 and 5
Event Logs Collection
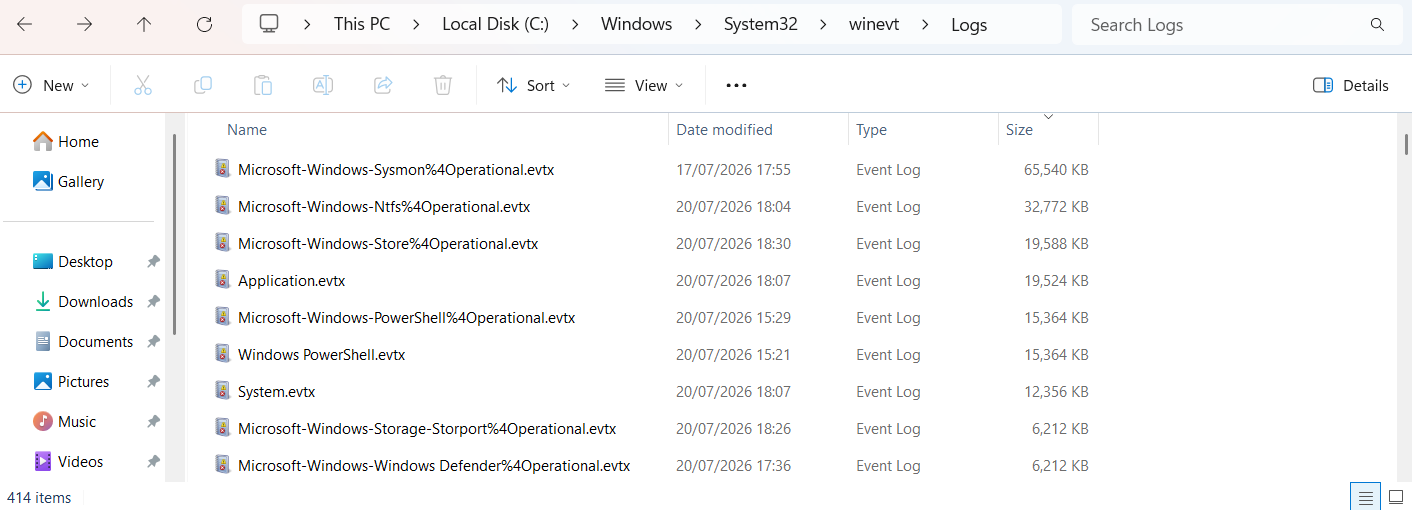
The event logs are organized in files, often called log channels or just logs: Security.evtx, System.evtx, and hundreds more. They are all located in the C:\Windows\System32\winevt\Logs\ folder, which you can just copy and process on your DefenseBox. The average size of the folder is 50-400 MB, but it can reach a few gigabytes on some configurations.
On DefenseBox, you can read the logs with the default Event Viewer, or export them to CSV with EvtxECmd and read them in another viewer or ingest the file into a SIEM. EvtxECmd is part of Eric Zimmerman's Tools (opens in new tab), which we will use extensively throughout the path. Here is how to parse the logs with EvtxECmd, assuming they are exported to the "Export" folder:
           # 1. Export the EVTX logs to the "Export" folder
# 2. Run EvtxECmd and receive a single merged CSV file
C:\Users\Administrator\Export> EvtxECmd.exe -d EventLogs --csv ./ --csvf evtx_merged.csv
Once the CSV is ready, the two popular options to parse it are Timeline Explorer, a convenient viewer, or a with a quick upload feature, such as Splunk. Timeline Explorer is sufficient for small log files or when you already know what to hunt for, but for bigger files, a SIEM option would be much more convenient.
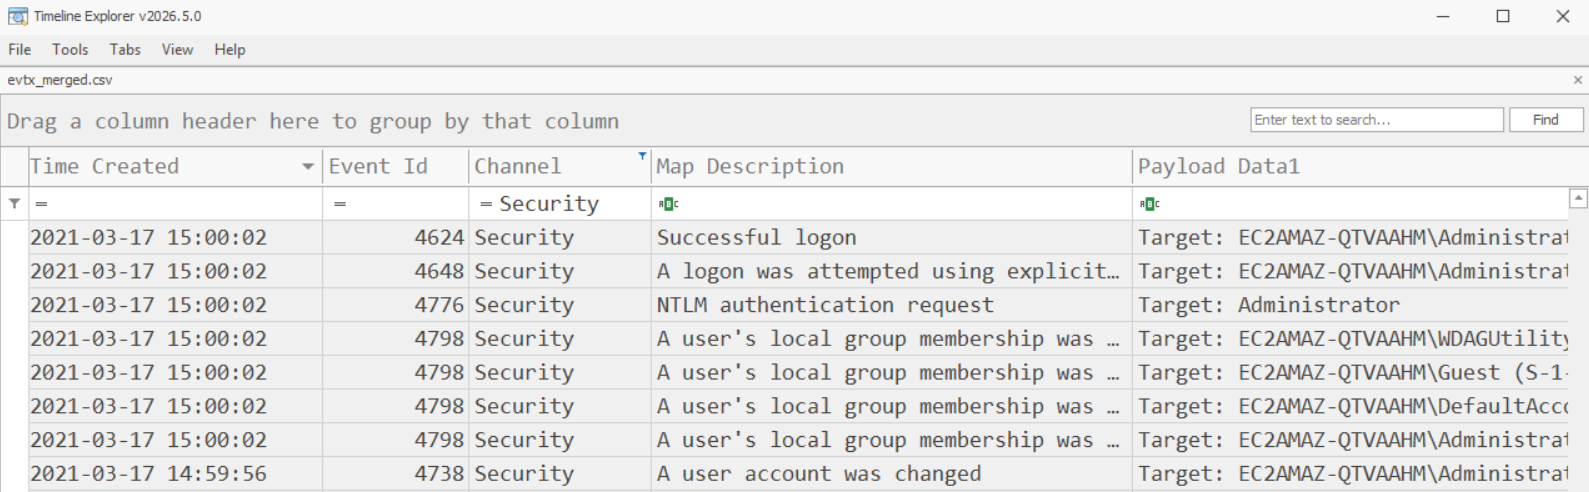
Option A: Read the parsed event logs in Timeline Explorer
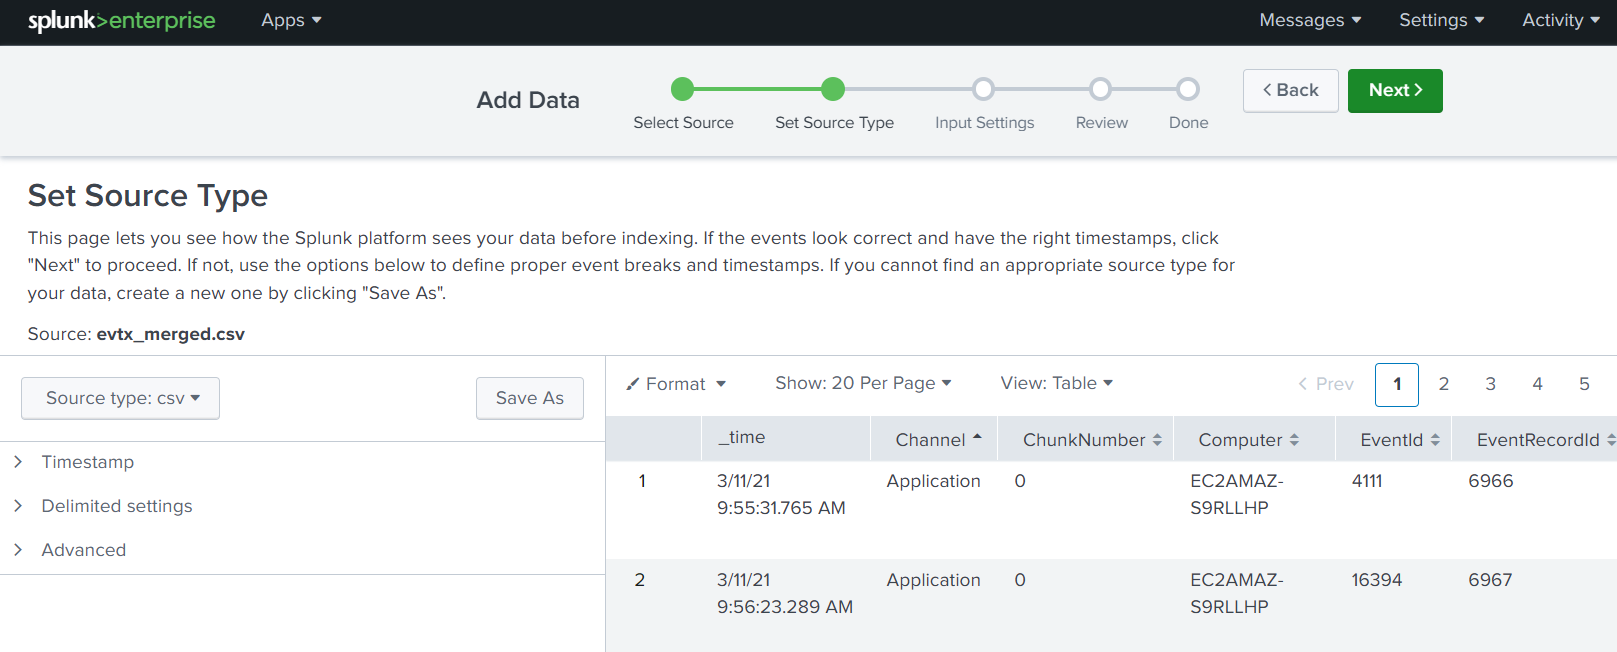
Option B: Ingest the CSV to Splunk (Settings > Add Data > Upload)
Logging Pitfalls
Properly configured logs make most DFIR work trivial, as they reveal every step of an attack and can be correlated against each other. The problem is, logs are never properly configured. In real engagements, you are guaranteed to hit at least one issue that forces you to rely on sources beyond the event logs. Below are some of the challenges you can face:
| Challenge | Description |
|---|---|
| Data retention |
|
| Disabled channels |
|
| Log tampering |
|
Summary
Always include event logs in your DFIR collection pack, regardless of the host. Most forensic tools acquire the entire EVTX folder by default, but if you're constrained by collection size for any reason, you can pull just the highest-value channels instead. The exact list will vary with the case, but here is a starting point:
Logged by Default
Security.evtx: Your #1 channel, at least because it reveals logon events (Event ID 4624 and 4625)System.evtx: Tracks services (Event ID 7040 and 7045), shutdowns, USB and driver events, and moreWindows PowerShell.evtx: Can reveal PowerShell launch and its launch command lineMicrosoft-Windows-Windows Defender%4Operational.evtx: Defender detections and AV eventsMicrosoft-Windows-TerminalServices-RDPClient%4Operational.evtx: RDP logins from the machineMicrosoft-Windows-TerminalServices-LocalSessionManager%4Operational.evtx: logins to the machine
Disabled by Default
Microsoft-Windows-PowerShell%4Operational.evtx: Reveals full, decoded PowerShell commandsMicrosoft-Windows-Sysmon%4Operational.evtx: If installed, Sysmon can solve the incident on its own
Practice
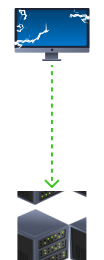
For this lab, if you're using DefenseBox, you can collect the logs and other artifacts via SMB. On the target VM, run net use M: \\DEFENSEBOX-IP\C$ /user:DFIRUser, enter the password, and you will see a new mapped drive. Then, you can easily transfer the files from the target (#3 on the image) to any folder on DefenseBox (#2 on the image). In real engagements, though, it's better to use intermediate storage such as a shared server.
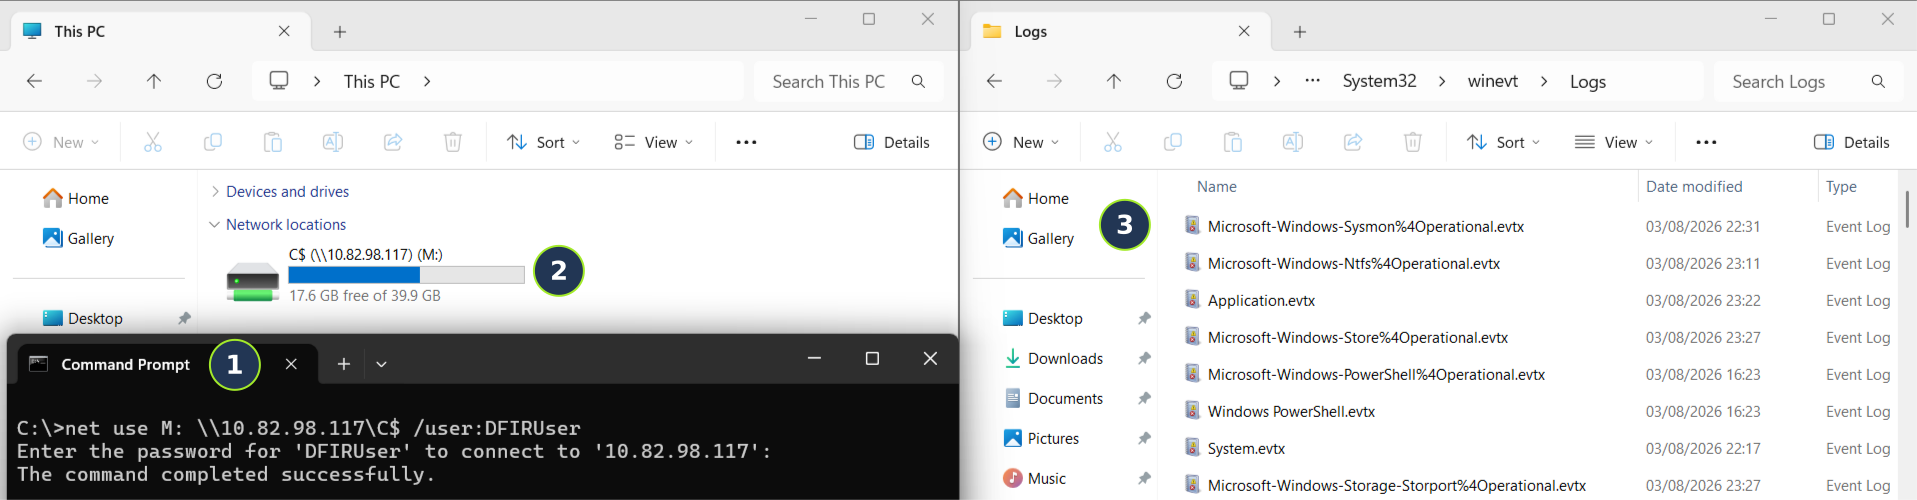
Your target for today is JMP-, OpenDoor's jump host that divides public-facing subnets from the internal network. The previous investigation led you to believe the attackers moved laterally to it, so let's quickly copy the lab event logs to DefenseBox and start the triage.
How many EVTX files are present in the event log folder?
Export and analyze the Security logs on the DefenseBox.
What user was brute-forced according to the 4624/4625 events?
Are Sysmon logs present to show the process events after the logon? (Yea/Nay)
Soon after, the user moved laterally to another host via RDP.
What hostname was that according to the RDPClient EVTX logs?
Logs from third-party applications can greatly complement logs.
Let's focus on two common examples: web access logs and browser history.
Web Access Logs
, , Nginx, and other web servers don't record incoming requests in the EVTX event logs. Instead, they write to plain-text files (C:\inetpub\logs\LogFiles\W3SVC*\*.log for IIS). These files are easy to parse, lightweight to store, and often persist for months or years, giving you a long historical window. You can collect them the same way as EVTX, just by copying the whole folder. The only challenge you might face is locating them on disk, since every app may write its logs to a different folder.
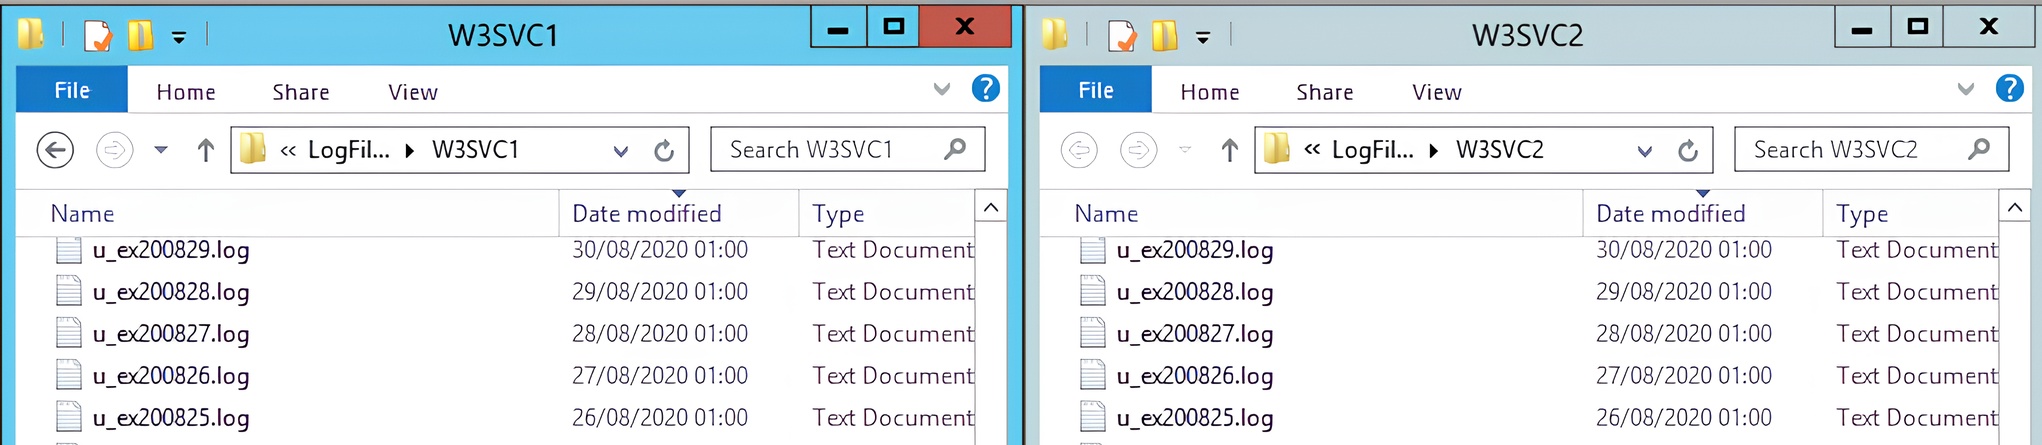
The web logs also cover a blind spot that event logs can't. Sysmon might show you that IIS on WEB-SRV01 (w3wp.exe) is spawning suspicious child processes like whoami, but it can't tell you why. To understand what triggered that process, you need the web logs: the exact URL, status codes, response length, source IP, and more, often revealing the exploit that caused whoami to launch (shell.aspx web shell in the example below):
           2026-07-23 08:14:02 10.0.0.15 GET /index.html - 80 - 203.0.113.42 Mozilla/5.0 - 200 0 0 132
2026-07-23 08:15:47 10.0.0.15 GET /shell.aspx cmd=whoami 80 - 116.109.216.74 Mozilla/5.0 - 200 0 0 61
2026-07-23 08:16:03 10.0.0.15 GET /shell.aspx cmd=dir 80 - 116.109.216.74 Mozilla/5.0 - 200 0 0 740
2026-07-23 08:16:29 10.0.0.15 GET /shell.aspx cmd=ping+-n+1+8.8.8.8 80 - 116.109.216.74 Mozilla/5.0 - 200 0 0 3120
You are encouraged to collect web access logs any time you're investigating a device with a web panel: a public website, email server, VPN gateway with a web interface, or similar. Then, if other evidence confirms the attack started from a web server, its logs would be your only way to determine which specific vulnerability was exploited and how to remediate the attack.
Browser History
A valuable artifact from infected workstations. Browser history can confirm whether the user was phished, accessed a malicious download website, or "googled" things that can confirm an insider threat or malicious employee intentions. Unlike cookies and saved passwords, browser history is not encrypted and can be exported from these locations:
- Edge:
C:\Users\<user>\AppData\Local\Microsoft\Edge\User Data\Default\History - Chrome:
C:\Users\<user>\AppData\Local\Google\Chrome\User Data\Default\History - Firefox:
C:\Users\<user>\AppData\Roaming\Mozilla\Firefox\Profiles\*\places.sqlite
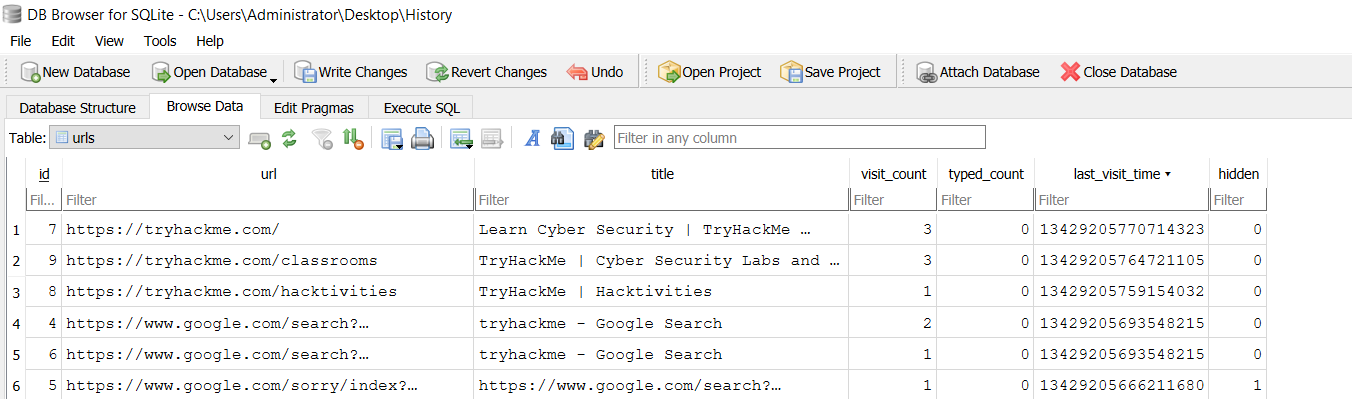
All modern browsers store history in SQLite databases, which you can open with DB Browser for SQLite (GUI) or export to CSV using SQLECmd (CLI), both of which are already installed on the DefenseBox. For Edge and Chrome, the SQL table you want is urls, shown in the image below:
Other Logs
Web access logs and browser history are common, tested artifacts you can safely collect and analyze. However, be very careful with other applications' logs, especially those coming from homemade or unmaintained software. Since their logging is rarely built with security in mind, the chance you'll find anything useful there is typically low. Be aware that the custom logs can be:
- Noisy: It's common to read 5 GB of application logs and find nothing useful there for
- Buggy: Apps may skip the events due to bugs in the logging, and you will never know it
- Undocumented: Good luck interpreting event code 0x500802 in some closed-source software
Summary
Always add web access logs to your collection pack when investigating web servers, and browser history when investigating workstations. As for other third-party logs, you'll rarely need them immediately, so it's best to leave them out of the pack and come back to the host later, once you've exhausted the traditional artifacts and know exactly what to hunt for in those logs. Otherwise, you risk going down a rabbit hole, wasting time on debug noise for no result.
Practice
In addition to the event logs, capture IIS logs from the JMP- server and the browser history of all users. The chance they will help in this scenario is small, but it's still important to check every artifact before building a final timeline. You can view the browser history file using DB Browser for SQLite on DefenseBox.
Before the brute-force, the attacker scanned the local IIS server.
What user-agent did the attacker use, according to the web logs?
What was the last Google search of j.stevenson before the attack?
Since logs are rarely present in full, you'll need to collect other forensic evidence as well.
Windows generates many different artifacts and stores them on disk or in the registry.
On-Disk Artifacts
Many Windows features, like those for program optimization or telemetry collection, can be used to reconstruct almost the entire story of how a system was used. Some attack chains can be uncovered entirely with OS artifacts without the need for event logs. You will learn many such artifacts throughout the path, but let's briefly review the examples stored on disk:
- (
C:\Windows\Prefetch\*.pf)
Proves a specific executable ran, its run count, first/last run timestamps, and more - SRUM (
C:\Windows\System32\sru\SRUDB.dat)
Shows per-application resource usage and network bytes sent/received over ~30 days - Recent Files (
C:\Users\<user>\AppData\Roaming\Microsoft\Windows\Recent Items)
Lists recent files a user opened in Explorer, with original paths, timestamps, and more - PowerShell History (
C:\Users\<user>\AppData\Roaming\Microsoft\Windows\PowerShell\PSReadLine\*)
Stores the history of entered commands, similar to .bash_history on Linux
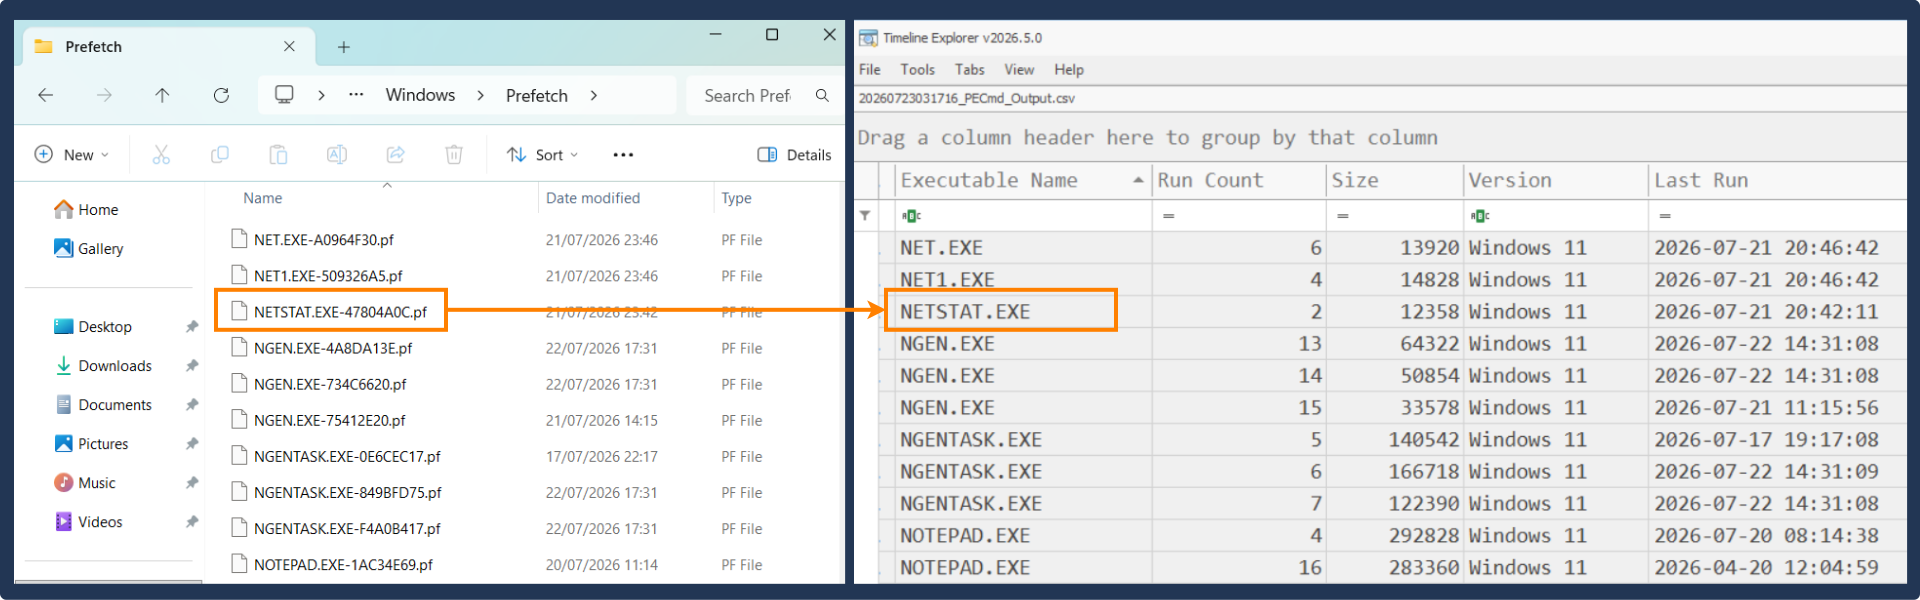
Each of the artifacts is stored in its own format, and some require specialized tools to be collected and parsed. For example, Prefetch entries can be parsed with PECmd, also part of Eric Zimmerman's Tools:
           # Run PECmd and receive a merged CSV from all *.pf files
C:\Users\Administrator\Export> PECmd.exe -d C:\Windows\Prefetch --csv ./
Registry Artifacts
The registry is a database that stores most of Windows and user settings. If you ever wondered, "Where does Windows keep this information?" the registry would likely be the answer. It is organized in the form of logical hives (e.g., HKLM\SYSTEM hive), backed by a file on disk (e.g., C:\Windows\System32\config\SYSTEM file). Below is how the registry works behind the scenes:
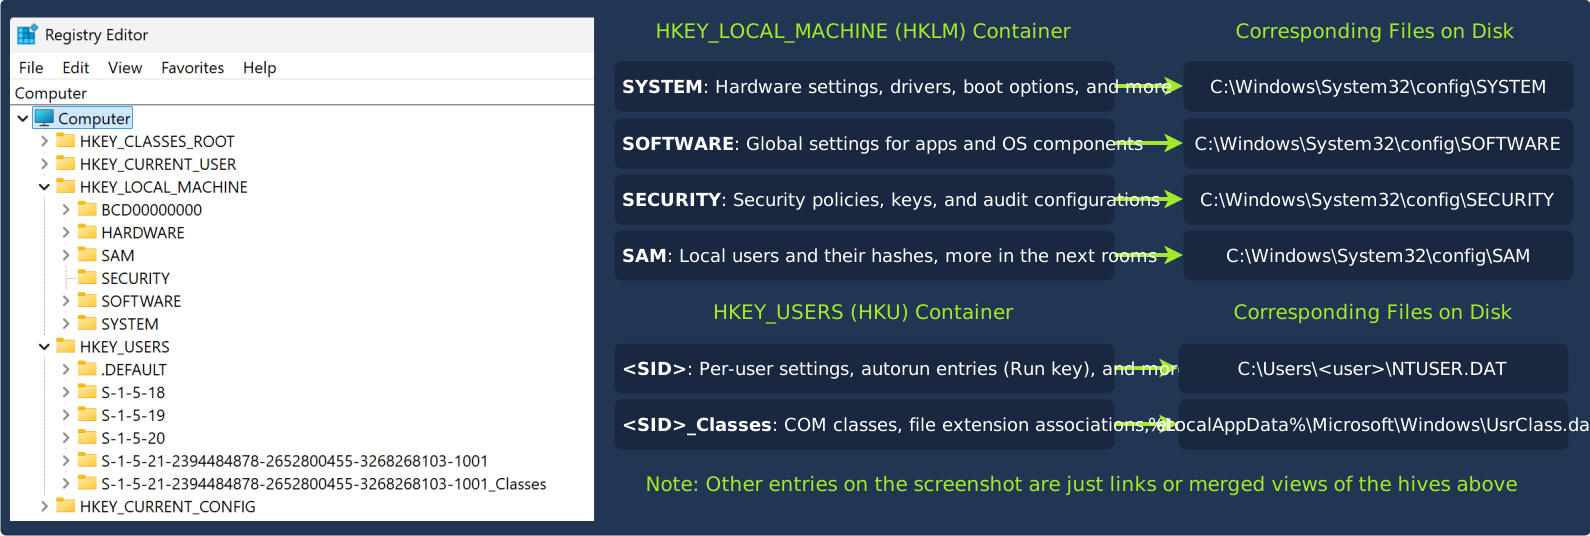
The registry is a gold mine for forensic analysis. Whenever you install a program, use a network share, connect via RDP, add something to autorun, or do any other action on your Windows device, the registry often records it, sometimes for an indefinite period. Here are just a few of the DFIR artifacts found in the registry:
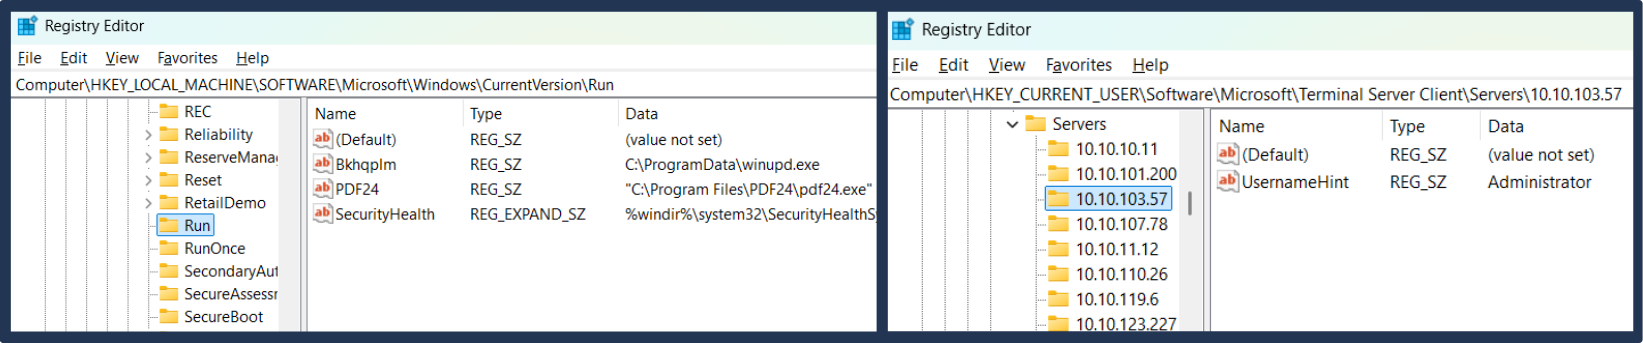
- Run Keys (e.g.,
HKLM\Software\Microsoft\Windows\CurrentVersion\Run)
Lists programs set to autorun on login, a common persistence method (see the image below) - Terminal Server Client (
HKU\<SID>\Software\Microsoft\Terminal Server Client\Servers)
Saves hosts that the device has ever connected to via RDP (see the image below) - AppCompatCache (
HKLM\SYSTEM\CurrentControlSet\Control\Session Manager\AppCompatCache)
Shows paths and modification times of executables the OS evaluated for compatibility - Amcache.hve (
C:\Windows\AppCompat\Programs\Amcache.hve)
Records the SHA-1 hash and full path of executables present on the system.
Note that .hve is a separate registry hive, not loaded by Registry Editor
Lastly, be aware that the live registry doesn't sync to disk in real time, so you need to grab the registry files plus the transaction logs (the LOG1 and LOG2 below). These logs hold recent changes not yet written to disk and can be merged back with tools like Registry Explorer. Alternatively, you can use the reg save command (e.g., reg save HKLM\SYSTEM C:\SYSTEM.hiv) to get a clean version of the hive. The method also helps if the hives are locked by the OS and can't be copied manually.

Basic System Information
The more you know about the system and its current state, the easier it is to interpret the event logs and collected artifacts. Most of the information can be taken from the registry, but it's more convenient to collect basic system information separately. Jumping ahead, the collection can be performed with custom scripts, KAPE modules, or Velociraptor queries. Check out the simplest script example below:
           # System info: hostname, OS version, hardware, timezone, uptime
systeminfo

# Logged-on users and active sessions
query user; query session

# Network state and configuration
ipconfig /all; route -p print; netstat -anob

# Local users, groups, and shares
net user; net localgroup Administrators; net share

# Running processes with full command line
Get-CimInstance Win32_Process | Select-Object *

# Scheduled tasks and Windows services
schtasks /query /v /fo list; Get-CimInstance Win32_Service | Select-Object *
Summary
On-disk and in-registry OS artifacts can often reveal as much as properly configured logs, and throughout the path you will learn the exact artifacts useful for detecting every common technique. In the next room, , you will see what exact artifacts are collected during enterprise engagements.
Practice
Neither event nor application logs revealed what happened on the host. Let's see if the OS artifacts we explored can make the difference. You are encouraged to try PECmd to parse Prefetch, Timeline Explorer to read the output, and Registry Explorer to interact with the exported registry. All these tools are present on DefenseBox.
Prefetch revealed Sliver C2 masking as a Microsoft Office updater.
What .pf file confirms its execution from the C:\ProgramData directory?
The C2 persisted in the registry to launch on logon.
What is the Run registry key used for persistence?
The adversary also ran PowerShell discovery commands.
What is the last command seen in the victim's history file?
Windows is always installed on an filesystem, which adds its own forensic evidence.
Let's split it into three categories: file attributes, file content, and NTFS metadata files.
File Attributes
NTFS stores many attributes for each file: timestamps, permissions, flags like "hidden" or "system", and Alternate Data Streams (ADS), if any. All of these matter in , and you can use them to complement your investigation. For example, once other artifacts suggest a host is infected, you can return to it and run to:
- List all files created or modified within the incident time range
- List all files with the "hidden" or "system" attribute flag in suspected directories
- List downloads with a Zone.Identifier ADS (Mark of the Web (opens in new tab)), revealing their origin URL
           Resolve-Path "C:\Users\*\Downloads" |
ForEach-Object { Get-ChildItem $_.Path -Recurse -File -Force -EA 0 } |
ForEach-Object {
    $ads = Get-Content $_.FullName -Stream Zone.Identifier -EA 0
    if ($ads) {
        Write-Output "`n$($_.FullName) [Created: $($_.CreationTime)]"
        $ads
    }
}
File Content
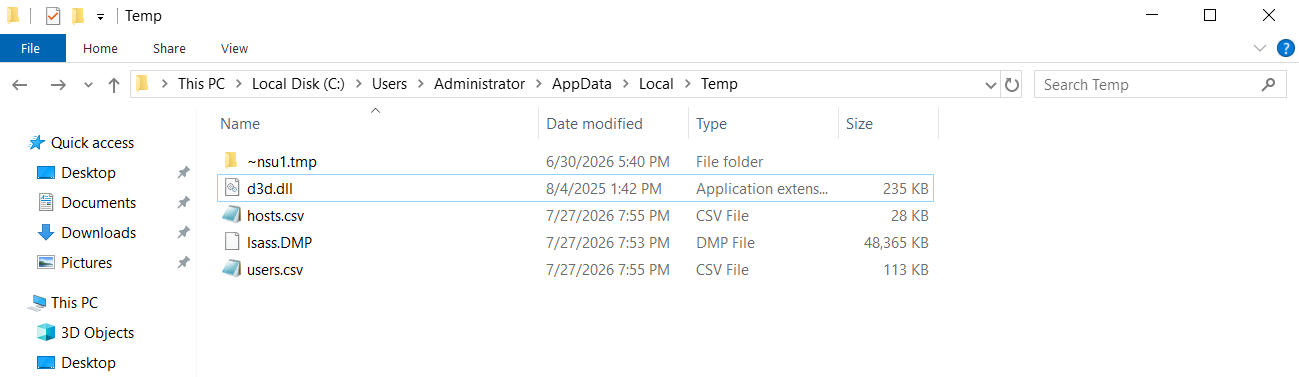
If the listings above revealed interesting files, you can come back to the system and collect them. This is very important, as malware binaries can then be analyzed and attributed to a threat group, config files can point to the attack infrastructure, and archives with collected data can identify what exactly the adversaries accessed and exfiltrated. Below is a representation of what was found in the Temp folder in a recent incident:
NTFS Metadata Files
The file attributes can help only if files currently exist on the system. If the files were deleted by an adversary, you'd need to use the NTFS metadata files instead, namely $MFT, $LogFile, and $UsnJournal. These files are invisible in Explorer but can be accessed and copied with specialized tools like FTK Imager:
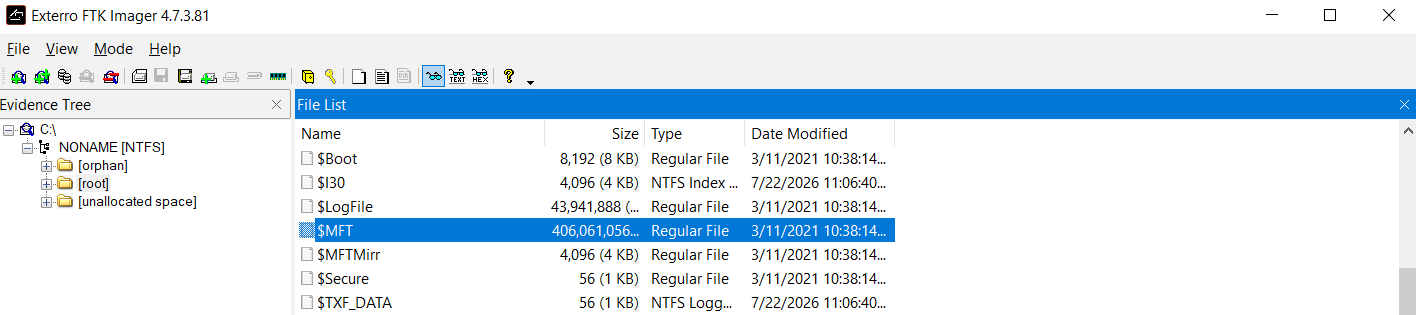
The $MFT (Master File Table) tells you what files are on the volume now, the $UsnJournal (Update Sequence Number Journal) gives you a history of file copying, modification, and deletion, and the $LogFile is a transactional log for the most recent changes. We will explore all three artifacts in detail in the following rooms, but here is a rough idea of how it can reveal usage and deletion of Mimikatz (mimi.exe):

Summary
NTFS metadata files are easy to acquire and complement the OS artifacts well: while OS artifacts largely center on program execution and user activity, NTFS artifacts focus on file operations, including for long-deleted files. You should always add them to your collection pack. The only blocker might be the size of the $MFT, which can weigh a few gigabytes on busy servers. If that's a concern, exclude it and come back to the host later, if required (and grab the malware files you spotted while you're there).
Practice
We haven't covered how to parse the NTFS metadata files, so they have already been parsed and placed in the Export folder on the Desktop. Open the CSV files with Timeline Explorer and identify the technique that allowed the attacker to move to the .
When was Mimikatz dropped to the Public directory?
Answer Example: 2026-07-25 15:30:45
Three minutes later, Mimikatz dropped a .txt file.
What is the absolute path to the created file?
The attacker copied Mimikatz without stripping its Mark of the Web.
What URL is shown once you adjust and run the script from the task?
The previous tasks covered basic artifacts you should collect in most scenarios.
Now, let's explore a more situational evidence source - volatile memory ().
Memory Forensics
Memory forensics is unique because RAM can reveal either everything or nothing. Get lucky, and you'll recover deleted files and see the malware's process, file, and network activity no worse than with . Get unlucky, and gain nothing after hours of acquisition. What decides your luck is the delay between the malicious activity and the acquisition. Collect memory while the beacon is still running, and you'll uncover a lot; do it hours after it exited, and you'll get only fragments (or nothing, if the system stayed in active use):

Volatility and MemProcFS
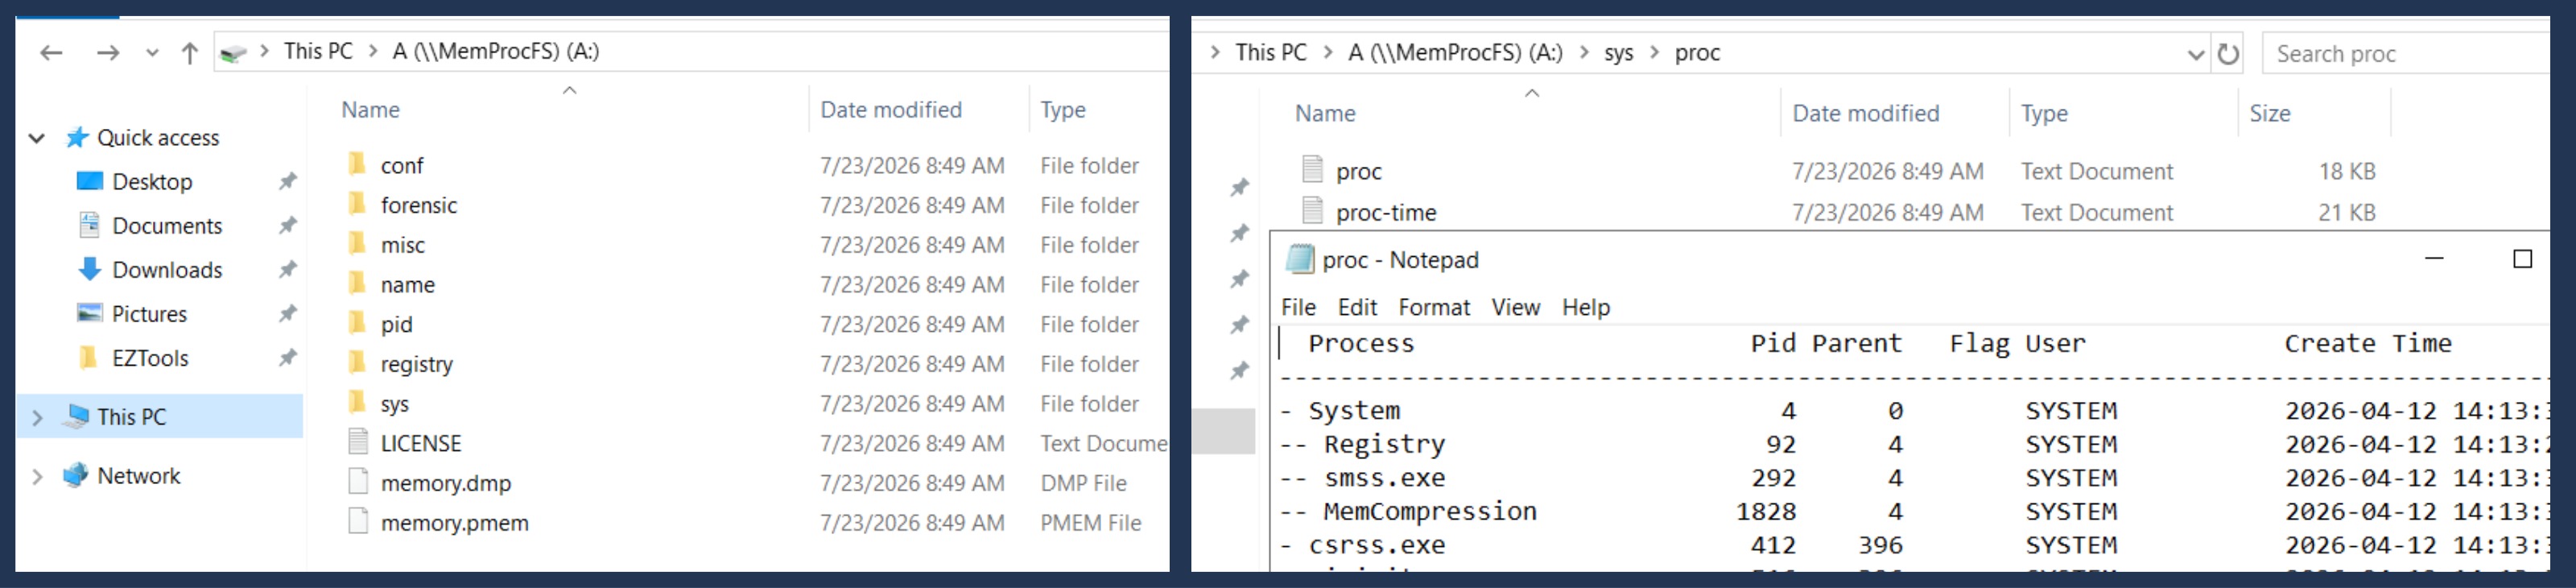
Memory can be acquired on a live host using tools like DumpIt, and then analyzed with either Volatility 3 or MemProcFS. The first one uses a plugin system (e.g., vol.py -f wks-01.mem windows.psscan to carve for process structures directly from memory), and the second represents the memory as a virtual filesystem you can navigate with Explorer, similar to /proc in . We will explore both tools later in the path, but here is a quick screenshot from MemProcFS to get the idea:
Pros of Memory Acquisition
- Can recover deleted files, shellcode, and sometimes event logs and CMD/PS history
- Reveals in-memory execution and process injections that leave no trace on disk
- Gives visibility into a broad range of activity: file, process, and network events
- Most valuable when investigating live ransomware and C2 agents:
- Can reveal in detail what the malware did (like with Procmon)
- Can expose C2 configs and keys, pointing to the C2 infrastructure
- In rare scenarios, can also reveal ransomware decryption keys
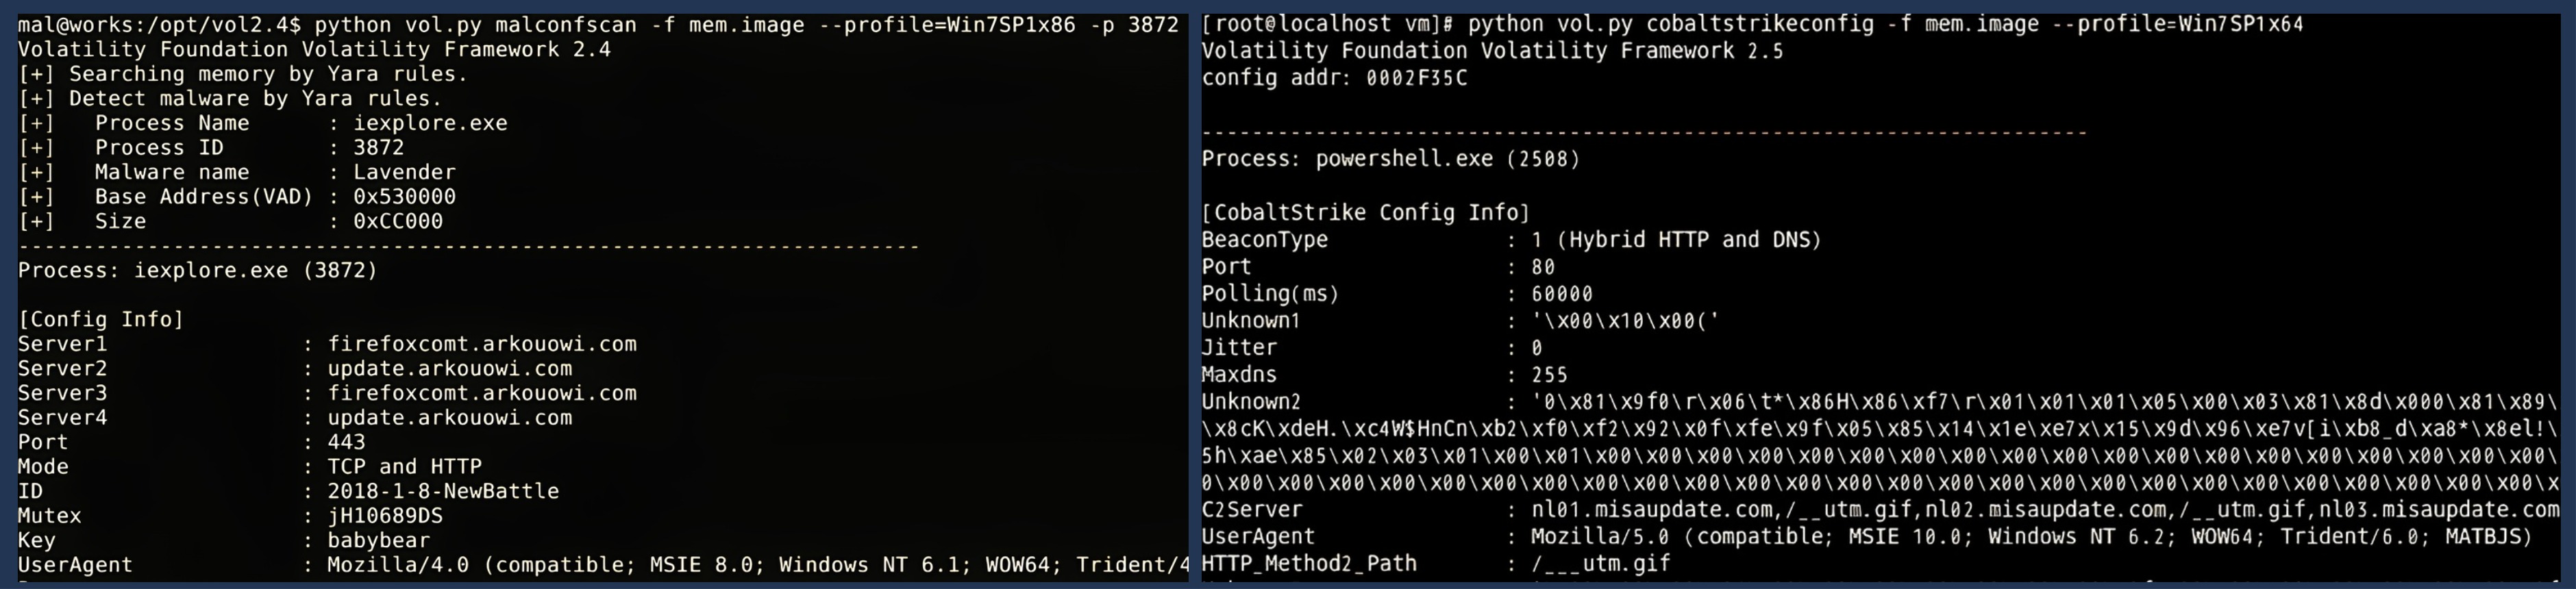 How memory forensics can reveal C2 configs inside the injected processes (JPCERT blog (opens in new tab))
Cons of Memory Acquisition
| Challenge | Description |
|---|---|
| High effort to acquire |
|
| High effort to analyze |
|
| Unreliable output |
|
Summary
Memory can reveal a lot about an attack, but it can't be acquired at scale as easily as event logs or artifacts. A common approach is to collect the other artifacts first across all suspected devices, and then selectively grab memory dumps only from the hosts where you need to dig deeper into malware activity. In practice, most questions about the attack are already answered before you ever reach for memory, so memory forensics is a relatively rare activity on traditional incident response projects.
What DFIR tool represents the memory as a virtual filesystem?
Another situational evidence source is a raw disk (bytes).
It has its pros and cons; let's find out what they are.
Disk Forensics
The previous tasks focused on collecting individual files and registry hives from the infected system. Full disk acquisition takes the opposite approach: instead of selecting artifacts, you capture everything. In a typical workflow, you need an external drive large enough to hold the target disk, boot the device from external media, and copy the entire SSD byte-for-byte to the external drive using software such as FTK Imager. The result is a disk image in E01 or raw/dd format:
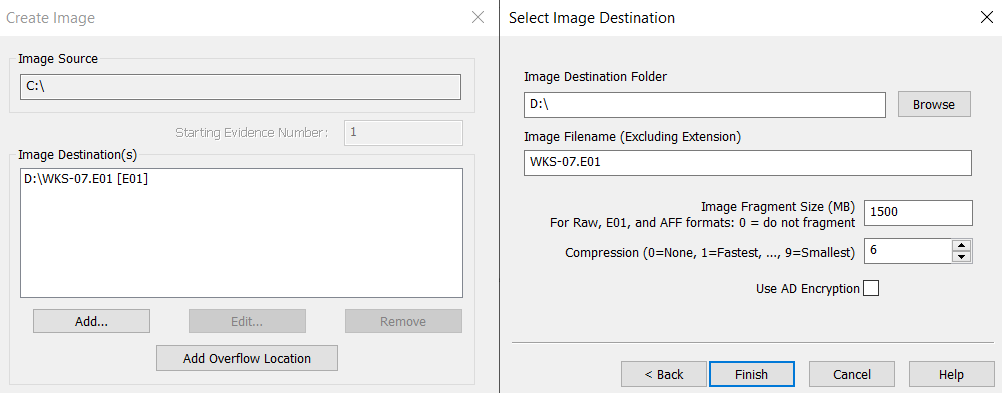
Pros of Disk Acquisition
- A disk image with a documented is the standard for legal proceedings
- You work against a read-only copy, so your analysis never alters the original evidence
- Because it captures unallocated space, disk imaging can recover deleted files
- Multiple tools can parse the image and carve the files for you, such as Autopsy
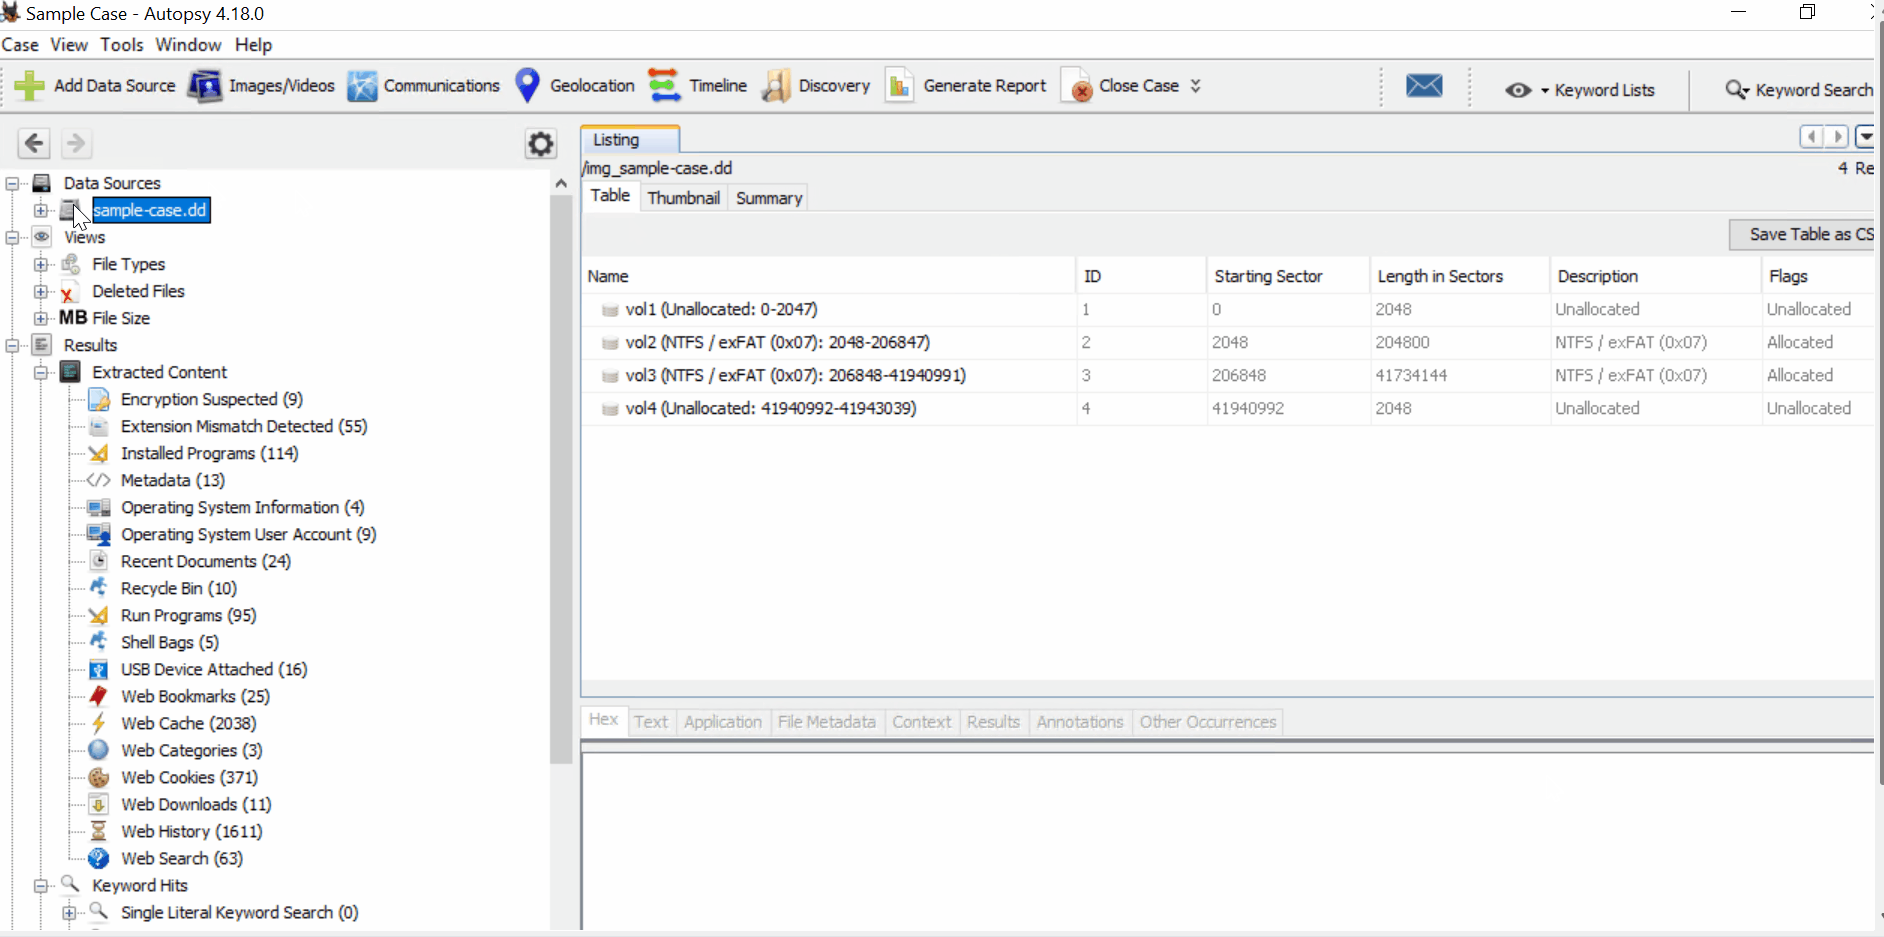
A screenshot from Autopsy, a popular tool for disk image forensics
Cons of Disk Acquisition
| Challenge | Description |
|---|---|
| Complex acquisition |
|
| Time constraints |
|
| Scaling constraints |
|
Summary
Disk imaging is great for law enforcement because you can guarantee the forensic soundness of the data and use it in court. It is also useful for investigating insider threats (viewing and recovering their browser history, emails, chat messages, and copied files). However, for classic ransomware intrusions, disk imaging is not worth the effort, as you collect everything to use just a few percent of it. The artifacts we covered earlier should be enough, and in the next rooms you will see how to collect and use them efficiently.
Which of the mentioned tools can be used to acquire both NTFS files and disk images?
Always-Collect Artifacts
In this room, we covered what to collect and briefly touched on the tools and techniques used to acquire, parse, and analyze the artifacts. We'll return to this topic throughout the path to learn how to collect them with , CyLR, or at scale with Velociraptor. Three artifact categories should always be collected regardless of the host: event logs, artifacts, and artifacts. Let's summarize the pros and cons of each.
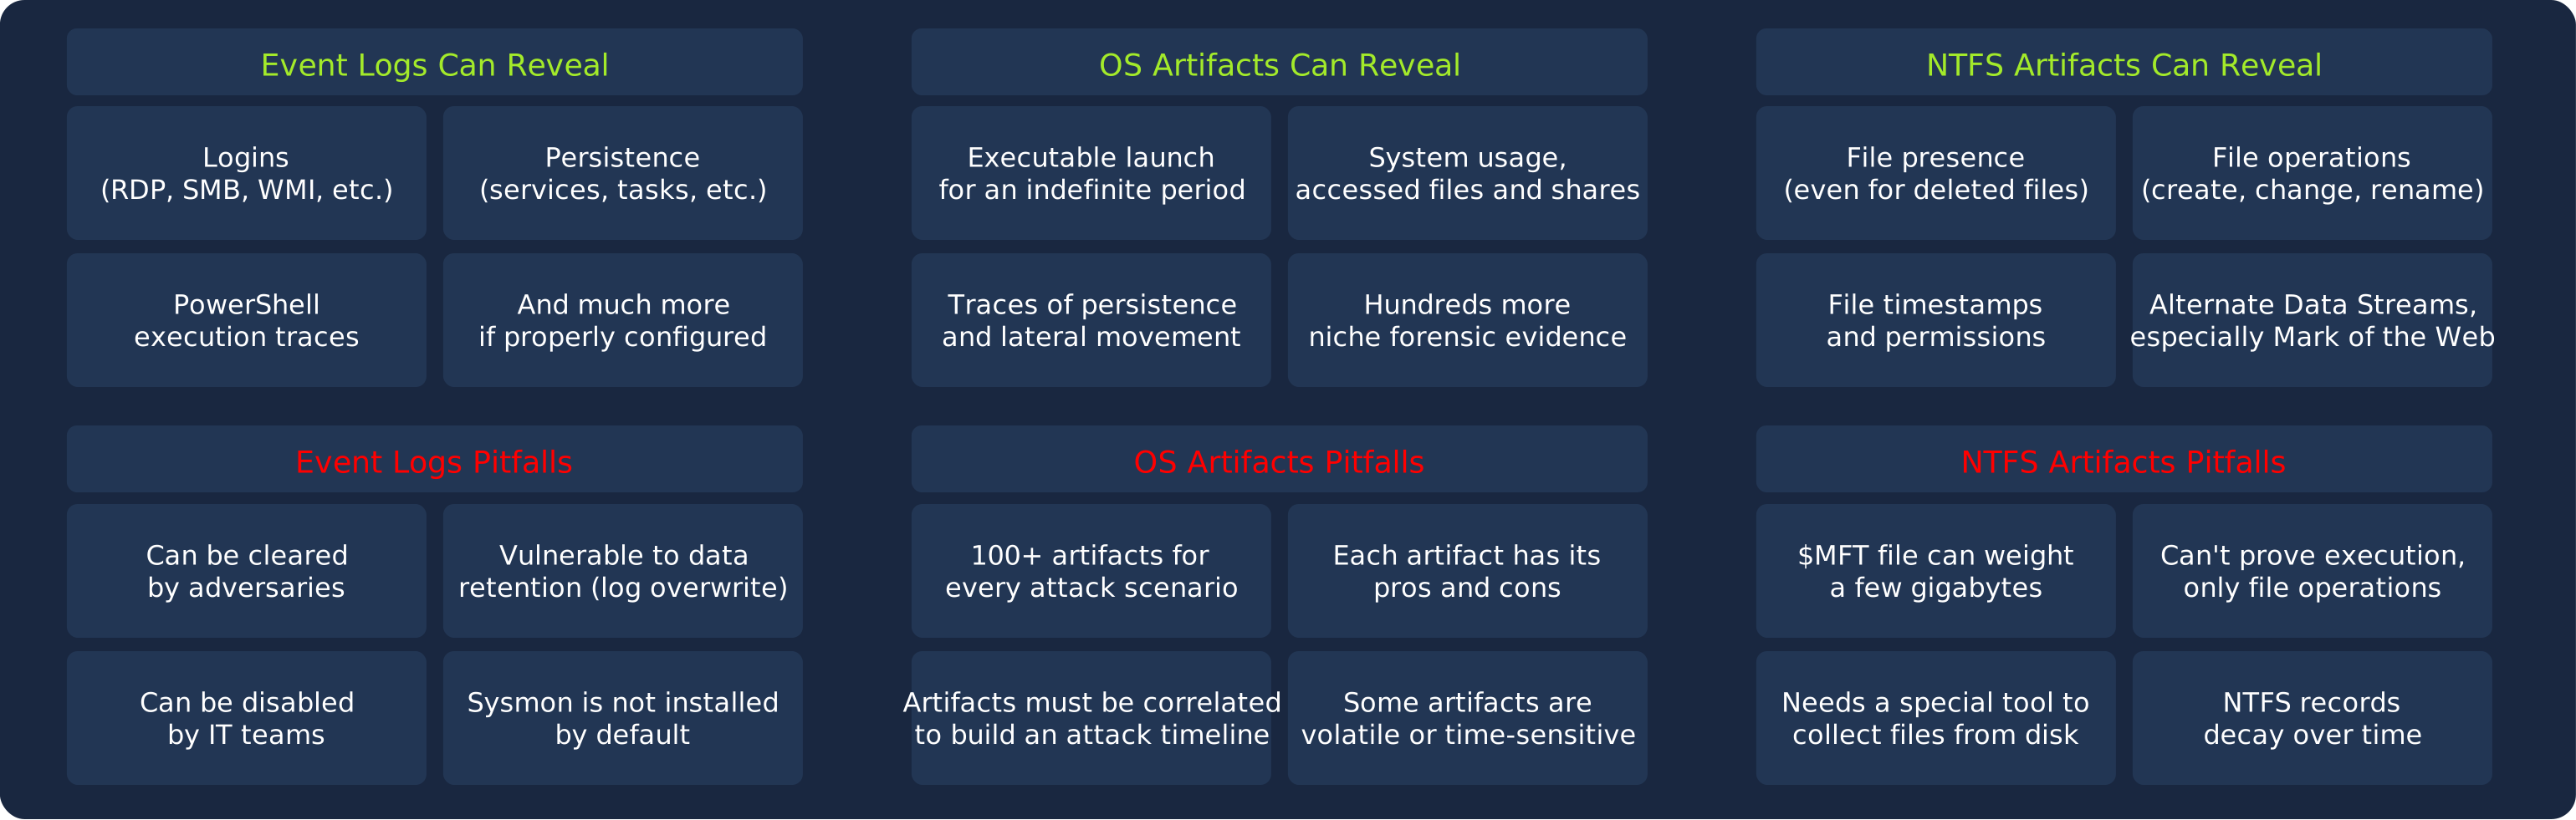
Situational Artifacts
Application logs, memory captures, and disk images are situational. Collect them when the investigation requires it, not from every suspected host by default. Full memory and disk collection at scale will overwhelm your team and the customer, and there is a high chance you'll never need this evidence. Triage with the always-collect artifacts first, then acquire the captures only on the hosts that need a closer look.
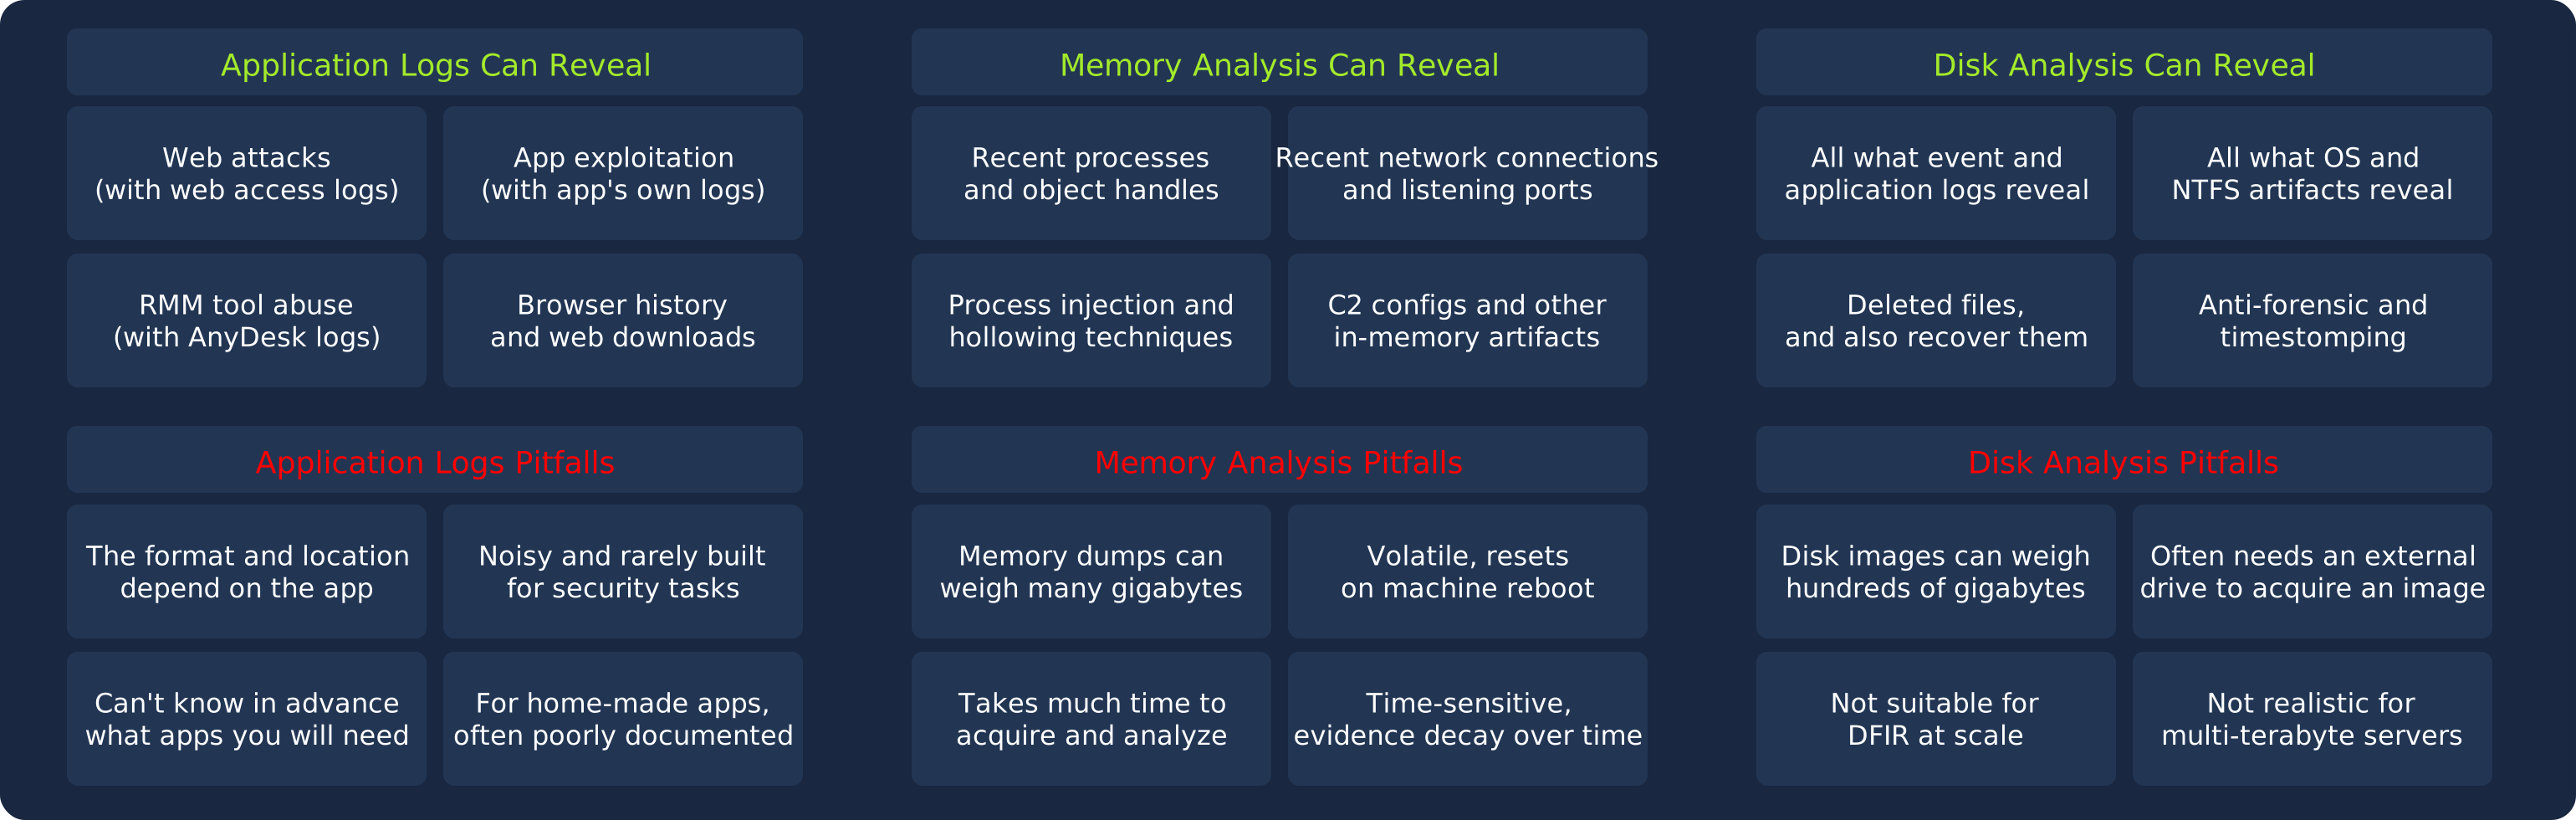
Complete the room!
Ready to learn Cyber Security?
TryHackMe provides free online cyber security training to secure jobs & upskill through a fun, interactive learning environment.
Already have an account? Log in